Characterization of Ultrashort Optical Pulses
With Third-Harmonic-Generation Based
Triple Autocorrelation
Tzu-Ming Liu, Yin-Chieh Huang, Gia-Wei Chern, Kung-Hsuan Lin, Yu-Chueh Hung, Chih-Jie Lee, and
Chi-Kuang Sun, Senior Member, IEEE
Abstract—We present a method to obtain complete information of femtosecond pulses. By measuring triple-optical autocorrelation directly with third-harmonic generation, without spectral informa-tion, a temporal pulse shape can be obtained by analytical calcula-tion without direccalcula-tion-of-time ambiguity. Combining the resulting optical pulse shape with its corresponding optical spectrum, the exact phase and color variations in time can all be recovered with a Gerchberg–Saxton algorithm through an iterative calculation with an ( ) complexity.
Index Terms—Pulse characterization, third-harmonic genera-tion, triple correlation.
I. INTRODUCTION
T
HE ULTRASHORT optical pulse is an increasingly im-portant tool for many fields, from basic physics, chemistry, and biomedicine to applications including micro-machining and high-bandwidth optical communications. Its short optical dura-tion allows us to study and utilize ultrafast time-domain events. Therefore, for most of these temporal applications, measuring the ultrashort optical pulse shape is a crucial diagnosis. Recent advances in ultrafast technology have pushed optical pulse du-ration below 5 fs, which is so fast that electronic devices (streak camera, etc.) are too slow to measure the evolution. Many tech-niques were developed to characterize the temporal pulse shape [1]–[5]. By far, the most common mean to evaluate femtosecond optical pulses is optical autocorrelation measurement based on second-harmonic generation (SHG) [1], [2]. An incident pulse is split into two replicas with relative temporal delay. These two pulses are then recombined in an SHG crystal. Thus, the gener-ated SHG signal, with one photon contributed from each pulse, is usually detected with a photomultiplier tube and the variation of detected photocurrent with delay yields the pulse autocorre-lation function(1)
Manuscript received April 24, 2002; revised July 23, 2002. The work of T.-M. Liu was supported by SIS Corporation. This work was supported by the National Science Council of Taiwan, R.O.C., under Grant 90-2112-M-002-051.
T.-M. Liu, Y.-C. Huang, G.-W. Chern, K.-H. Lin, and C.-K. Sun are with the Department of Electrical Engineering and Graduate Institute of Electro-Op-tical Engineering, National Taiwan University, Taipei 10617, Taiwan, R.O.C. (e-mail: [email protected]).
Y.-C. Hung and C.-J. Lee are with Department of Electrical Engineering, Na-tional Taiwan University, Taipei 10617, Taiwan, R.O.C.
Digital Object Identifier 10.1109/JQE.2002.804268.
A proper measurement of autocorrelation can provide estima-tion on the pulse duraestima-tion, and with the aid of high-order non-linearity [3]–[5], some pulse asymmetry information can also be extracted without direction-of-time ambiguity. However, the complete temporal optical pulse shape cannot be determined directly from these previously proposed two-arm correlations [1]–[5] due to limited information in the measurements.
To obtain the exact optical pulse shape, an extra dimension of information is required for measurement. In the late 1960s, Blount et al. had proposed that by measuring the triple-cor-relation function, the temporal intensity of a pulse can be analytically calculated without direction-of-time ambiguity [6]. Moreover, computer simulation also showed that this suggested method is quite insensitive to noise [7]. This proposed triple-op-tical autocorrelation has been implemented previously with a cascade of SHG and sum frequency generation [8]. However, for pulse-formation dynamic study and other applications including optical coherent controls [9]–[11], we not only need the complete knowledge of pulse intensity variation in time, but also the color variation in time. As a Fourier correspondence in frequency-time transformation, determination of color variation in time means phase reconstruction of the measured optical pulses. Just like several other proposed methods (including frequency-resolved optical gating (FROG) [12], SPIDER [13], photodiode-based phase-retrieval ultrafast waveform measure-ments [14], [28] and phase and intensity from correlation and spectrum only (PICASO) [15], [16]), temporal data itself is not enough to provide color (or phase) variation information and extra spectral measurement is needed. In this paper, we add spectral information into triple-optical-autocorrelation measurements to make the triple-autocorrelation method capable of providing a complete knowledge of laser pulses. With the measured temporal intensity of an optical pulse and its corresponding spectral intensity obtained with a spectrom-eter, exact intensity and phase variations in time can all be recovered with the Gerchberg–Saxton (GS) algorithm through an iterative calculation with an complexity. We have employed a single-staged third-harmonic-generation (THG) based triple-optical autocorrelation for direct pulse-shape measurement (TOAD), which is different from the two-staged implementation previously demonstrated [8], [17]. With these established procedures, optical pulse shapes can be directly calculated from TOAD measurement, and its phase variation can be exactly retrieved thereafter.
1530 IEEE JOURNAL OF QUANTUM ELECTRONICS, VOL. 38, NO. 11, NOVEMBER 2002
II. TOAD: PRINCIPLES
For an optical pulse, time-dependent intensity can be expressed in the frequency domain as
(2) where and are magnitude and phase of in the frequency domain. After beam splitting, three replicas of the laser pulse could be focused on a THG crystal. By varying the time delays and between three replica pulses and recording the THG signal generated with one photon from each replica, the background-free triple-optical autocorrelation
(3) can be directly obtained. Then we can use it and its bispectrum , the Fourier transform of the triple-optical-autocor-relation function, to calculate and [6] with
(4) and
(5) The temporal optical pulse shape can then be fully de-termined by substituting them into (2).
III. OBTAININGPULSESHAPEWITHTHG-BASEDTRIPLE
AUTOCORRELATION
The optical pulses used to demonstrate this concept came from a mode-locked Cr : forsterite laser operating around 1230 nm with a typical bandwidth of 12 nm [Fig. 2(a)]. The average output power was 280 mW with a 110-MHz repetition rate. By using beam splitters, the laser output beam was split into three mutual parallel and equal-distance replicas. Computer-con-trolled translation stages were used to introduce delays among them. Through an objective (54-18-15, Special Optics), each 60-mW beam was subsequently focused into the THG crystal with a 5- m spot size. The THG crystal we employed was a 0.45- m-thick p-type gallium nitride, which was grown on double-side polished sapphire and buffered with 1.45- m-thick AlGaN. Our previous experiments had employed the same Cr : forsterite laser to demonstrate enhanced THG in the GaN thin film due to close resonance of defect/doping levels and bandtail states [18]. With the help of interface and defect resonant-enhanced THG virtual transitions [18] in the p-doped GaN thin film, 2 nW of THG power can be generated with 180 mW of incident power. If there are temporal overlaps among
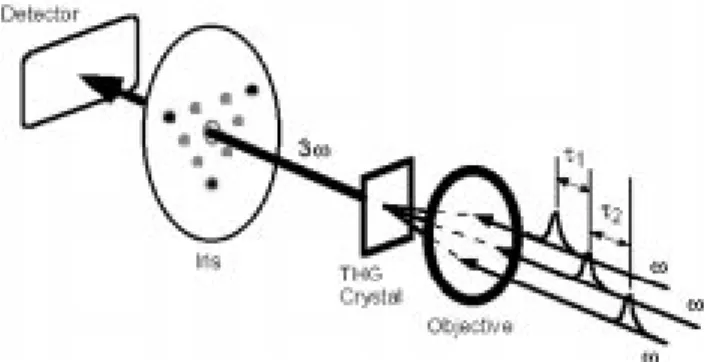
Fig. 1. Diagrammatic representation of THG-based triple-optical autocorrelation.
Fig. 2. (a) Fundamental spectrum of the mode-locked Cr : forsterite laser pulses. (b) The corresponding THG spectrum.
each pulse, ten possible THG beams will be generated in dif-ferent spatial directions due to difdif-ferent combinations of three individual photons. The middle THG beam will be the signal generated with one photon from each pulse replica according to momentum conservation law. As shown in Fig. 1, the THG beam that contained triple-optical-autocorrelation information was spatially selected with an iris. The generated THG signals were so strong that they can be directly observed with naked eyes and can be directly detected with a Si-based photodetector [18]. Finally, we used an optical filter to block any possible fundamental and SHG [18] lights and the generated THG signal was detected with a CCD-based spectrometer. The use of a spectrometer helped us to distinguish the THG signals from other multiphoton photoluminescence [18]–[20]. Fig. 2(b) is the measured THG spectrum, which centered at 410 nm with 4-nm full-width at half-maximum (FWHM). We integrated the spectral energy of THG signal as the intensity data point of TOAD. An example of the measured TOAD trace is shown in Fig. 3(a), which is a single-peaked pulse under typical laser
Fig. 3. Two THG-based TOAD traces for pulses from a modelocked Cr : forsterite laser. (a) Single-peaked pulse under typical laser operation. (b) Misaligned laser cavity—distorts the output pulse shape into a multiple-peaked structure.
operation. As a comparison, we misaligned the laser cavity in order to distort the output pulse shape into a multiple-peaked structure. Its TOAD trace is shown in Fig. 3(b), which extends to several picoseconds and shows more features than the previous case. Both of the results have a diagonal symmetry, which is the characteristic of the TOAD-autocorrelation func-tion. Following (2)–(5), their corresponding temporal pulse shapes can then be directly obtained and are displayed in Fig. 4 (solid curve). We have also measured the background-free SHG autocorrelation for the typical pulse by using the same GaN sample as the SHG crystal. The measured autocorrelation trace (solid curve in Fig. 5) agrees well with the reconstructed autocorrelation trace made from the TOAD obtained (dotted curve in Fig. 5).
IV. PHASERETRIEVAL
As was theoretically proven by Huiser, Drenth, and Ferw-erda in 1976, with exact knowledge of the temporal intensity of an optical pulse (that can be obtained by TOAD) and its cor-responding spectral intensity (that can be easily obtained with a spectrometer), its phase and color variations in time can be determined with a GS algorithm [21], [22]. Although there are ambiguities in the GS algorithm [23], for optically realizable functions, only pulses with complete temporal and spectral sym-metry will cause a twofold ambiguity [22]. Excluding this ambi-guity, the temporal phase variation can be uniquely determined with an complexity in contrast to other SHG-based tech-niques [12]. If the twofold ambiguity occurs due to a completely symmetric pulse shape or spectral shape, they can be distin-guished with an auxiliary measurement such as insertion of an optical window with known dispersion. In our developed GS algorithm, the TOAD-recovered temporal intensity
Fig. 4. Recovered temporal intensities (solid curves) and phases (dotted curves) corresponding to the THG-based TOAD traces in Fig. 3.
Fig. 5. Measured SHG autocorrelation trace (solid curve) and the reconstructed autocorrelation trace (dotted curve) made from TOAD-obtained
I(t) in Fig. 4(a).
and an initial guessed temporal phase form the initial condi-tion of the iteracondi-tion loop. For each iteracondi-tion, the temporal elec-tric-field signal (including magnitude and phase) is first Fourier transformed to frequency domain with its spectral magnitude re-placed by tje square root of the measured optical spectrum, then it is inverse transformed to time domain with its temporal mag-nitude replaced by square root of . At the end of the loop, the program evaluated the cost of the data by
(6)
which is the root-mean-square between (estimated intensity of the present iteration) and . As iteration loops go on, if the cost stays at a steady value, the present estimated temporal data will be registered and the phase will be rolled away from the original value by several times the phase difference between the present and the previous ones. This phase-rolling procedure acts as mutation in Genetic algorithm and prevents guessed data
1532 IEEE JOURNAL OF QUANTUM ELECTRONICS, VOL. 38, NO. 11, NOVEMBER 2002
Fig. 6. (a) Fundamental spectrum of the mode-locked Ti : sapphire laser pulses and (b) the corresponding THG spectrum.
from being trapped in local minima [24]. This process goes on after several mutations until the phase is recovered with an ac-ceptable cost.
With this developed phase-retrieval method and a spectral measurement, we obtained the temporal phases of laser pulses in previous cases (see dotted curves in Fig. 4). The misaligned case [Fig. 4(b)] shows stronger second-order dispersion and higher order dispersion than typical case [Fig. 4(a)] in time domain.
V. CHARACTERIZING THEDISPERSION OFPULSES
Utilizing the developed GS algorithm, we performed a dispersion measurement with laser pulses passing through a dispersive window. The study was performed on a mode-locked Ti : sapphire laser (Tsunami, Spectra-Physics). The wavelength of laser output pulses was centered at 780 nm with a typical bandwidth of 9 nm [Fig. 6(a)]. The average output power was 650 mW with a 82-MHz repetition rate. For the Ti : sapphire output pulse-shape measurement, an objective (54-17-30, Special Optics) focused each laser beam (70 mW) to 6- m spot sizes and an interference filter, centered at 260 nm, was used to block fundamental, SHG, and multiphoton-induced photolumines-cence. Other setups of TOAD measurements were the same as those in the Cr : forsterite output pulse-shape measurement. The THG signal was generated with the same p-doped GaN thin film described above for Cr : forsterite laser characterization utilizing surface THG effects in AlGaN/sapphire interface [25]. Finally, the collected THG spectrum showed a center wavelength of 260-nm, one third of its fundamental wavelength, with 2-nm FWHM [Fig. 6(a)]. The measured THG-based TOAD trace for typical pulses from a mode-locked Ti : sapphire laser is shown in Fig. 7(a). In order to introduce the optical dispersion for investi-gation, we placed a 2-cm-thick BK7 window before the TOAD measurement system. According to the dispersion relation given by Schott Glass, the corresponding second-order dispersion
Fig. 7. THG-based TOAD traces for output pulses from a mode-locked Ti : sapphire laser (a) with and (b) without BK7 window.
Fig. 8. Recovered temporal intensities (solid curves) and phase profiles (dotted curves), corresponding to the TOAD traces in Fig. 7.
evaluated at a wavelength of 780 nm is 930 fs . Fig. 7(b) shows the measured TOAD trace after introducing the dispersion window with a shape similar to but larger than Fig. 7(a), which implies pulsewidth broadening due to introduced positive optical dispersion. Fig. 8(a) and (b) shows their corresponding optical pulse shapes directly obtained from the measured TOAD traces in Fig. 7(a) and (b). Pulsewidth broadening from 130 fs [solid curve in Fig. 8(a)] to 162 fs [solid curve in Fig. 8(b)] can be found. After applying the phase retrieval program with the measured optical spectrum [Fig. 6(a)] to both cases, their corresponding temporal phases can also be determined (dotted curves in Fig. 8).
Fig. 9. Fourier-transformed optical intensity (solid curves) and phase (dotted curves) spectra, corresponding to the temporal traces in Fig. 8.
With a complete knowledge of the pulses, we can then apply the Fourier transformation on these temporal optical signals to obtain their corresponding spectral distribution information (as shown in Fig. 9), including magnitude and phase informa-tion, and retrieve their dispersions from the phase-determined spectra (dotted curve in Fig. 9). We found that the second-order dispersion was increased from 870 to 1800-fs , with a positive difference which agreed well with the expected value.
Compared to SHG, THG can be generated in any material, taking advantage of the interface inhomogeneity. Here we picked a GaN thin film grown on top of a sapphire substrate as THG crystal due to its wide bandgap and its availability in our laboratory just to demonstrate the feasibility of complete pulse shape and phase determination of femtosecond optical pulses with the THG-based TOAD. Although the THG efficiency is 10 in our case with the GaN thin film, the signal can already be easily detected by a Si-based photodetector without amplifiers. Moreover, some efficient THG crystals have been reported recently. Yelin et al. focused 130-fs pulses at a wave-length of 1.5 m on nematic liquid crystal and achieved 10 THG efficiency in a volume as small as 5 m [26]. Zhang et al. applied the technique of quasiperiodic optical superlattice (QPOS) on LiTaO and got 27% THG at a wavelength of 0.48 m [27]. These progresses in THG crystal can improve the THG efficiency, and therefore the signal-to-noise ratio of TOAD.
VI. PHASEVERIFICATIONWITHFROG
To verify the above demonstrated phase-retrieval method with an independent technique, we characterize the pulses shown in Fig. 9(a) right after the TOAD measurements by using a SHG FROG. The SHG crystal we used in the FROG system was a 0.3-mm-thick BBO (CASIX), which is cut at a 29.2 phase-matching angle for a wavelength of 800 nm. Its phase-matching bandwidth (16 nm) at 780 nm is much larger than the bandwidth (9 nm) of our mode-locked Ti : sapphire
Fig. 10. FROG trace of laser pulses corresponding to Fig. 7(a).
Fig. 11. FROG-recovered spectral intensity (Gaussian-like solid curve) and its corresponding twofold degenerate phases (solid curve and dash-dotted curve). These results are compared with data in Fig. 9(a) (dotted curves).
laser. With this BBO, we measured the SHG-spectra of back-ground-free autocorrelations [(1)] at different delay to form a FROG trace (Fig. 10). Thus, retrieved optical intensity and phase spectra are shown in Fig. 11 as solid curves. Because the autocorrelation function has direction-of-time ambiguity, there are twofold degenerate phase solutions with the method of SHG-FROG. The intensity and the phase with positive dispersion agree well with the recovered results by using THG-based triple autocorrelation (shown as dotted curves in Fig. 11). This result also supports the capability of accurate phase retrieval by the developed GS algorithm.
VII. SUMMARY
In conclusion, we demonstrated a method to obtain com-plete information of femtosecond pulses. First, we realized THG-based triple-optical autocorrelation for direct optical pulse-shape measurement. Since THG is allowed for any materials, our developed technique can be easily realized with little modification on the common autocorrelation setup with a thin film of wide-bandgap materials. This time-domain technique allows quick and easy determination of the measured optical pulse shape without iterative algorithms. For further information on the color or phase variation in time, with the help of a measured optical spectrum, a simple GS algorithm (with complexity) can uniquely determine it except for pulses with complete temporal and spectral symmetry that will cause a twofold ambiguity.
ACKNOWLEDGMENT
The authors thank Prof. E. P. Ippen for the stimulating tech-nical discussions. Also, for providing the GaN sample, they
1534 IEEE JOURNAL OF QUANTUM ELECTRONICS, VOL. 38, NO. 11, NOVEMBER 2002
thank Y. Smorchkova, S. Keller, S. DenBaars, and U. Mishra from University of California at Santa Barbara. One of the au-thors, T.-M. Liu, would like to thank SIS Corporation for their support.
REFERENCES
[1] M. Maier, W. Kaiser, and J. A. Giordmaine, “Intense light bursts in the stimulated Raman effect,” Phys. Rev. Lett., vol. 17, pp. 1275–1277, Dec. 1966.
[2] E. P. Ippen and C. V. Shank, Ultrashort Light Pulses-Picosecond
Techniques and Applications, S. L. Shapiro, Ed. Berlin, Germany: Springer-Verlag, 1977, p. 83.
[3] D. H. Auston, “Measurement of picosecond pulse shape and background level,” Appl. Phys. Lett., vol. 18, pp. 249–251, Mar. 1971.
[4] E. P. Ippen and C. V. Shank, “Dynamic spectroscopy and subpicosecond pulse compression,” Appl. Phys. Lett., vol. 27, pp. 488–490, Nov. 1975. [5] P. Langlois and E. P. Ippen, “Measurement of pulse asymmetry by three-photon-absorption autocorrelation in a GaAsP photodiode,” Opt. Lett., vol. 24, pp. 1868–1870, Dec. 1999.
[6] E. I. Blount and J. R. Klauder, “Recovery of laser intensity from corre-lation data,” J. Appl. Phys., vol. 40, pp. 2874–2875, June 1969. [7] B. Wirnitzer, “Measurement of ultrashort laser pulses,” Opt. Commun.,
vol. 48, pp. 225–228, Dec. 1983.
[8] T. Feurer, S. Nidermeier, and R. Sauerbrey, “Measuring the temporal intensity of ultrashort laser pulses by triple correlation,” Appl. Phys. B, vol. 66, pp. 163–168, Feb. 1998.
[9] A. M. Weiner, D. E. Leaird, G. P. Wiederrecht, and K. A. Nelson, “Fem-tosecond pulse sequences used for optical manipulation of molecular-motion,” Science, vol. 247, pp. 1317–1319, Mar. 1990.
[10] W. S. Warren, H. Rabitz, and M. Dahleh, “Coherent control of quantum dynamics—The dream is alive,” Science, vol. 259, pp. 1581–1589, Mar. 1993.
[11] N. H. Bonadeo, J. Erland, D. Gammon, D. Park, D. S. Katzer, and D. G. Steel, “Coherent optical control of the quantum state of a single quantum dot,” Science, vol. 282, pp. 1473–1476, Nov. 1998.
[12] D. J. Kane and R. Trebino, “Characterization of arbitrary femtosecond pulses using frequency-resolved optical gating,” IEEE J. Quantum
Elec-tron., vol. 29, pp. 571–579, Feb. 1993.
[13] C. Iaconis and I. A. Walmsley, “Spectral phase interferometry for direct electric-field reconstruction of ultrashort optical pulses,” Opt. Lett., vol. 23, pp. 792–794, May 1998.
[14] T.-W. Yau, Y.-Y Jau, C.-H. Lee, and J. Wang, Tech. Dig. Conf. Laser and
Electro-Optics, Baltimore, MD, May 23–28, 1999, pp. 263–264.
[15] J. W. Nicholson, J. Jasapara, W. Rudolph, F. G. Omenetto, and A. J. Taylor, “Full-field characterization of femtosecond pulses by spectrum and cross-correlation measurements,” Opt. Lett., vol. 24, pp. 1774–1776, Dec. 1999.
[16] J. W. Nicholson, M. Mero, J. Jasapara, and W. Rudolph, “Unbalanced third-order correlations for full characterization of femtosecond pulses,”
Opt. Lett., vol. 25, pp. 1801–1803, Dec. 2000.
[17] T.-M. Liu, Y.-C. Huang, K.-H. Lin, G.-W. Chern, C.-J. Lee, Y.-C. Hung, and C.-K. Sun, “Triple-optical autocorrelation for direct optical pulse-shape measurement,” Appl. Phys. Lett., vol. 81, pp. 1402–1404, Aug. 2002.
[18] C.-K. Sun, S.-W. Chu, S.-P. Tai, S. Keller, U. K. Mishra, and S. P. DenBaars, “Scanning second-harmonic/third-harmonic generation mi-croscopy of gallium nitride,” Appl. Phys. Lett., vol. 77, pp. 2331–2333, Oct. 2000.
[19] C.-K. Sun, J.-C. Liang, J.-C. Wang, F.-J. Kao, S. Keller, M. P. Mack, U. Mishra, and S. P. DenBaars, “Two-photon absorption study of GaN,”
Appl. Phys. Lett., vol. 76, pp. 439–441, Jan. 2000.
[20] S.-W. Chu, I.-H. Chen, and C.-K. Sun, “Four photon induced fluores-cence in Gallium Nitride,” in Tech. Dig. Focus on Microscopy, Kaoh-siung, Taiwan, R.O.C., Apr. 2002, paper TaB3, p. 51.
[21] R. W. Gerchberg and W. O. Saxton, “Phase determination from image and diffraction plane pictures in the electron microscope,” Optik, vol. 34, pp. 275–284, Dec. 1971.
[22] A. M. J. Huiser, A. J. J. Drenth, and H. A. Ferwerda, “On phase retrieval in electron microscopy from image and diffraction pattern,” Optik, vol. 45, pp. 303–316, July 1976.
[23] P. Schiske, “Uniqueness and ambiguity in phase determination from image and diffraction pattern intensities,” Optik, vol. 40, pp. 261–275, May 1974.
[24] R. W. Gerchberg, “The lock problem in the Gerchberg–Saxton algorithm for phase retrieval,” Optik, vol. 74, pp. 91–93, Oct. 1986.
[25] T. Tsang, “Optical third-harmonic generation at interfaces,” Phys. Rev.
A, vol. 52, pp. 4116–4125, Nov. 1995.
[26] D. Yelin, Y. Silberberg, Y. Barad, and J. S. Patel, “Phase-matched third-harmonic generation in a nematic liquid crystal cell,” Phys. Rev. Lett., vol. 82, pp. 3046–3049, Apr. 1999.
[27] C. Zhang, H. Wei, Y.-Y. Zhu, H.-T. Wang, S.-N. Zhu, and N.-B. Ming, “Third-harmonic generation in a general two-component quasiperiodic optical superlattice,” Opt. Lett., vol. 26, pp. 899–901, June 2001. [28] Tech. Dig. Conf. Laser and Electro-Optics, pp. 263–264, 1999.
Tzu-Ming Liu was born in Keelung, Taiwan, R.O.C.,
in 1977. He received the B.S. degree in electrical en-gineering from National Taiwan University, Taipei, R.O.C., in 1999 where he is currently working toward the Ph.D. degree.
Since 1999, he has been with the Ultrafast Optics Group, Department of Electrical Engineering and Graduate Institute of Electro-Optical Engineering, National Taiwan University. His current interests include carrier dynamics in semiconductor materials, ultrafast solid-state lasers, multiphoton confocal microscopy, and nonlinear optics.
Yin-Chieh Huang was born in Taipei, Taiwan,
R.O.C., in 1977. He received the B.S. degree in electrical engineering in 1999 and the M.S. degree in electrooptical engineering in 2001, both from National Taiwan University, Taipei, Taiwan, R.O.C.
Since 2001, he has been with the Industrial Tech-nology Research Institute, Hsinchu, Taiwan, R.O.C.
Gia-Wei Chern was born in Chia Yi, Taiwan,
R.O.C., in 1974. He received the B.S. degree in electrical engineering in 1996 and the Ph.D. degree in electrooptical engineering in 2001, both from National Taiwan University, Taipei, R.O.C.
In 2001, he joined the Ultrafast Optics Group, Department of Electrical Engineering and Graduate Institute of Electro-Optical Engineering, National Taiwan University, as a post-doctorate researcher.
Kung-Hsuan Lin received the B.S. degree in
elec-trical engineering in 2001. He is currently working toward the Ph.D. degree at the Graduate Institute of Electro-Optical Engineering, National Taiwan Uni-versity, Taipei, Taiwan, R.O.C.
Yu-Chueh Hung received the B.S. degree in electrical engineering from
Na-tional Taiwan University, Taipei, Taiwan, R.O.C., in 2001
Chih-Jie Lee received the B.S. degree in electrical engineering from National
Chi-Kuang Sun (M’96–SM’01) was born in Tainan,
Taiwan, R.O.C., in 1965. He received the B.S. degree in electrical engineering from National Taiwan Uni-versity, Taipei, Taiwan, R.O.C., in 1987 and the M.S. and Ph.D. degrees in applied physics from Harvard University, Cambridge, MA, in 1990 and 1995, re-spectively.
He was a Visiting Scientist at the Research Laboratory of Electronics, Massachusetts Institute of Technology, Cambridge, between 1992 and 1994, working on femtosecond carrier dynamic studies of semiconductors and metals. From 1995 to 1996, he was with the National Science Foundation’s Center of Quantized Electronics Structures (QUEST), University of California, Santa Barbara, as an Assistant Research Engineer, conducting research on quantum dots, GaN, microcavities, and high-speed communication devices and systems. He is now an Associate Professor in the Graduate Institute of Electro-Optical Engineering and Department of Electrical Engineering, National Taiwan University. His research interest is primarily concerned with femtosecond laser technology, high-speed optoelectronic devices, ultrafast phenomena, novel quantum structures, GaN, and biomedical optics.
Dr. Sun is a Member of the American Physical Society and the Optical Society of America, and a Senior Member of the IEEE Laser and Electro-Optics Society. He was the recipient of year 2000 C. N. Yang Outstanding Young Researcher Award from Association of Asian Pacific Physical Society.