行政院國家科學委員會專題研究計畫 成果報告
兩種行為上分化的果蠅種族之基因表現差異研究
研究成果報告(精簡版)
計 畫 類 別 : 個別型 計 畫 編 號 : NSC 96-2311-B-002-004- 執 行 期 間 : 96 年 01 月 01 日至 96 年 07 月 31 日 執 行 單 位 : 國立臺灣大學醫學院臨床醫學研究所 計 畫 主 持 人 : 王弘毅 共 同 主 持 人 : 方淑 計畫參與人員: 臨時工:王晨帆 報 告 附 件 : 出席國際會議研究心得報告及發表論文 國際合作計畫研究心得報告 處 理 方 式 : 本計畫可公開查詢中 華 民 國 97 年 03 月 10 日
I
行政院國家科學委員會補助專題研究計畫
█ 成 果 報 告
□期中進度報告
種化初期基因表現之調節
計畫類別:█ 個別型計畫
□ 整合型計畫
計畫編號:NSC
96-2311-B-002-004-執行期間:
96
年
1
月
1
日至
96
年
7 月
31
日
計畫主持人:王弘毅
共同主持人:方淑
計畫參與人員: 王晨帆
成果報告類型(依經費核定清單規定繳交):█精簡報告 □完整報告
本成果報告包括以下應繳交之附件:
█赴國外出差或研習心得報告一份
□赴大陸地區出差或研習心得報告一份
□出席國際學術會議心得報告及發表之論文各一份
□國際合作研究計畫國外研究報告書一份
處理方式:除產學合作研究計畫、提升產業技術及人才培育研究計畫、列管計
畫及下列情形者外,得立即公開查詢
□涉及專利或其他智慧財產權,□一年□二年後可公開查詢
執行單位:台灣大學臨床醫學研究所
中
華
民
國
97
年
3
月
10
日
Abstract
In this study, we used microarray technology to study the transcription differentiation between different races of Drosophila melanogaster. In single line study, there are 1138 genes differentially expressed between Z30 (Z line) and Fr (M line). For pool-line study, number of differentially expressed genes reduced to 435. These results indicate that majority of differentially expressed genes between different lines are polymorphic. In addition, even though Z/M races are at incipient stage of speciation, a large number of genes is involved during this process. We also analyzed the genes by their functional categories. Three out of four over-represented categoriesarebehaviorrelated,including “Behavioral interaction between organisms“,“Regulation ofbehavior“,and “Reproductivebehavior“,correlating nicely with our expectation that behavior related genes would contribute the difference between M and Z races. This study also demonstrates the feasibility of pool line strategy in identifying race-defining genes. In single line study, genes related to behavior regulation,including “Behavior”,“Reproductivebehavior”, and “Behavioralinteraction between organisms”,also showed up. Combining the results from pool-line and single-line hybridization, three out of four functional categories are related to behavior regulation, including “regulation ofbehavior”,“behavioralinteraction between organisms,and “reproductive behavior”.Based on this result, we are confident that our strategy of identifying race-defining genes is applicable. By applying the current methodology we should be able to find genes corresponding to racial differentiation. Further study on population genetics and gene functions will help us to understand the mechanism of speciation.
III 摘要 本研究利用基因體微陣列分析兩種不同亞種果蠅基因表達之差異。我們首先在不同亞種各取一 個品系的果蠅進行分析,發現在 Z30 與 Fr 有 1138 個基因的表現兩有顯著差異。接著我們再不同亞 中多個品系的果蠅合在一起比較,發現有 435 個基因有顯著差異。這個結果顯示大部分表現量有差 異的基因在不同亞種中具有多型性。另一方面,即使在種化早期階段,也有數百個基因表達量有所 差異。我們進一步分析這些基因的功能。在單一品系方面,與”行為”,”生殖行為”,"生物體間交 互作用的行為”有關的基因在我們的基因中有比例過高的情形。顯示利用微陣列的技術,我們確實 找到與亞種分化有關的基因。在多的品系的比較中,比例顯著較高的項目有,”行為”,”生殖行為”, "生物體間交互作用的行為”,以及”行為調控”等。進一步分析這些基因的功能有助於吾人了解族群 分化的相關機制。 關鍵字:微陣列,種化,分化
Background
One of the major challenges facing modern biology is to understand the genetic mechanisms causing speciation. The difficulty stems largely from our lack of knowledge at the fundamental genetic level. For example, how do phenotypical distinctions emerge and reinforce between species? What are the underlying genes? What forces drive their divergence? In order to get some insights into these questions, several recent studies have focus on genes that cause fitness reduction in hybrids that are intermediate in phenotype between organisms. The reduced fitness can range from ecological
maladaptation or behavioral aberration to inviability or sterility. The loci that underlie such reductions in fitnessmightbeconsidered “speciation gene”(Wu and Ting 2004). At least five cases of speciation genes have been confirmed so far. Most bear a strong signature of positive selection [for review see (Wu and Ting 2004)].
Practically, the effortsofidentifying “speciation gene”aretremendous.Forageneto divergein function,itneedsto bereleased from itsoriginalfunction niche(genetic‘niche-release’). So,speciation genes are often non-essential, with functions that are only loosely coupled to reproductive isolation.
Consequently,phenotype that defines the class of genes that we are interested in usually does not contain a hint of the original function for which each of these genes evolved.For example,the range of the molecular identity forseveral“speciation genes”,aswellastheunderlying principle,isbroad.Three cases are related to transcriptional regulation (Xmrk (Zechel et al. 1988; Wittbrodt et al. 1989), OdsH (Sun, Ting, and Wu 2004), and Hmr (Barbash et al. 2003)), supporting the common postulate that species divergence is regulatory in nature (King and Wilson 1975). Moreover, in desat2 (Greenberg et al.
2003),which is not a regulatory gene, the change during incipient speciation is nevertheless in the
regulatory region.In addition, the speciation events for the contemporary species usually occurred tens or hundreds of thousands generations before. With such level of divergence, the footnotes left by forces driving their divergence become blurred and difficult to identify. To facilitate our effort of identifying ‘speciation genes’,weneed a simple system which is at the incipient stage of speciation with robust phenotypic differences that are strictly genetically determined.
The Zimbabwe race of D. melanogaster vis-a-vis the cosmopolitan populations may be such a system (Wu et al. 1995). Females from most Z lines (for Zimbabwe) do not mate with males from M lines (for melanogaster of the cosmopolitan type), whereas the reciprocal crosses experience much weaker or no isolation. The extent of variation in sexual behaviors among natural isolates has been documented (Hollocher et al. 1997a). The genes for the female preference and male attractiveness behaviors are mapped to all three major chromosomes thatareIII> II>> X ≥ 0 (Hollocher et al. 1997b). The behavioral polymorphisms, together with the absence of obvious postmating isolation, suggest that this system of sexual isolation may represent speciation at the very incipient stage. Among the many genetic studies of sexual isolation (Tan 1946; Kawanishi and Watanabe 1981; Zouros 1989; Venter et al. 2001) none is perhaps closer to the initial stage of speciation than the Z-M isolation. The behaviors are also robust in different environmental or physiological conditions. The robust behaviors, the nascent
2
2006) between the Z- and M-types, justify naming the Zimbabwe and nearby populations a separate race of D. melanogaster.
Furthermore, because sexual isolating mechanisms that act before fertilization ("ethological" isolating mechanisms ) are thought to precede the evolution of postzygotic isolating mechanisms (inviability and sterility), Z-M behavior races might give us some insights to understand the genetic basis of sexual isolation and early stages of species formation.
Drosophila melanogaster is a model organism with excellent genetic and genomic resources that
are ideal for genetically dissecting complex traits, including the ability to clone chromosomes, replicate genotypes, and rear large numbers of individuals under uniform environmental conditions; publicly available mutations and deficiency stocks useful for mapping; abundant segregating variation in natural populations that can readily be selected in the laboratory to produce divergent phenotypes a complete well annotated genome sequence; and several platforms for whole-genome transcriptional profiling.
Many researches on genetics of speciation have been conducted. The Z-M isolation of drosophila
melanogaster and microarray provide us a very powerful way to study what happened in speciation at
genome-wide expression level. What kinds of genes changed their expression level? What role does the natural selection play? Does M type race evolve faster then Z type as it does at sequence level? From thisproposal,weexpectto defineagroup oflocithatarecandidatesof“speciation gene”.Further study on these genes may shed light on this‘themystery ofmysteries’speciation question.
Materials and Methods
Experimental design Since Z-M behavior races are at early stage of divergence, most of the differences
between any single M and Z lines are probably irrelevant to racial differences.
Given a hypothetical example shown in the Fig. 1, there are nine differences between Z1 and M1, but four of them are the polymorphic with five of them in M and one in Z lines. As we are interested in the genes displaying differences between races, the polymorphic within race groups would be less useful for our purpose. Under such circumstance, one has to examine many lines to get the genes differentiating two races. This can be done by scrutinizing the transcription profiles individually from each line. While one may obtain robust result by such practice, it is a time and cost-consuming strategy. Alternatively, samples from same racial group can be pooled to conduct microarray experiments. M1 M2 M3
D
MZ Z1 Z3 Z2Pooling samples in biomedical studies has now become a frequent practice among many researchers. For example, >15% of the datasets deposited in the Gene Expression Omnibus Database involve pooled RNA samples (Kendziorski et al. 2005). The practice of pooling biological samples has been used in different application areas (Gastwirth 2000), e.g. for the detection of certain medical conditions and estimation of prevalence in a population. In spite of divergent views on the wisdom of pooling samples in the context of detecting differential gene expressions using microarrays (Churchill and Oliver 2001; Peng et al. 2003; Affymetrix 2004; Shih et al. 2004; Jolly et al. 2005), two main arguments supporting the practice of pooling biological samples are that biological variation can be reduced by pooling RNA samples in microarray experiments (Churchill and Oliver 2001) and that financial cost can be reduced.
Microarray hybridization. One hundred to 250 three-to-five-day-old female flies are starved for one
hour prior to sedation on ice. Heads are dislodged from the bodies using sieves after flies were snap
frozen in liquid nitrogen. TRIzolR Reagent (GIBCO BRL) is used for RNA extraction. After precipitation, the RNA is then re-suspended and purified with phenol and chloroform. cDNA syntheses are carried out by Array 900 expression array detection kit(GenisphereInc.)with manufacture’sprotocol.Arraysare from DGRC (Drosophila Genomics Resource Center) of Indiana University. We hybridize and wash the samples according to the protocol from DGRC (Cherbas 2005).
Array analyses. Arrays are scanned using a GenePix Axon scanner and data are extracted using GenePix
6 to give Cy3 and Cy5 intensities. The flowing analyses are conducted in R computing environment (http://www.r-project.org). We first transforme the data using spatial-intensity joint loess. This is done with R/maanova package (Wu and Churchill 2005). The transformed log2-intensites for all 15552 spot
measures yijkare subjected to a normalization model of the form yij= μ + Ai+ Dj+ ADij+ εij,whereμ is
the sample mean, Aiis the effect of the ith array (i = 1-12), Djis the effect of jth dye(Cy3 orCy5),and εij
is the stochastic error. ADij is the interaction involving dye and array. In this model, array (Ai) is modeled
as random effect and was assumed to have a normal distribution with a mean of zero (N(0, )).2A
The residuals from normalization model are subjected to gene specific models of the form rijk= μ +
Ai+ Dj+ Gk+ εijk, where g is the average intensity associated with a particular gene; Gkis kth genotype
(k = 1- 8). Array (Ai) here represents as spot effects on the arrays and is also treated as random effect in
the gene specific models. T-test is performed to identify differentially expressed gene between different lines and species. Four kinds of t tests namely, standard t test ; global t test, using an estimate of error variance that is pooled across all genes; regularized t test, combing information from gene-specific and global average variance estimates by using a weighted average of the two as the denominator for a gene-specific t test; and Fs test proposed by Cui et al 2003 (Cui and Churchill 2003) are conducted to access number of differentially expressed genes. We also carry out permutation analysis by randomizing the residuals (within each gene) from the fitted null model 1,000 times and re-computing t-statistics.
4
Results
Pool line study
30 flies from 10 different lines of M and Z races were pooled before RNA extraction. Six array hybridizations have been done with 3 cy3-labeled M race RNAs hybridized with 3 cy5-labeled Z race RNAs and vice versa. After image analysis, background correction, and normalization, the log-2 expression intensities were analyzed using a linear mixed model with fixed effect for different fly lines and a random effect for arrays. T-tests were applied to call genes significantly deferential expressed between M and Z races. Table 1 gives number of significant genes. At P value of 0.001, there are 453 genes differentially expressed between M and Z races.
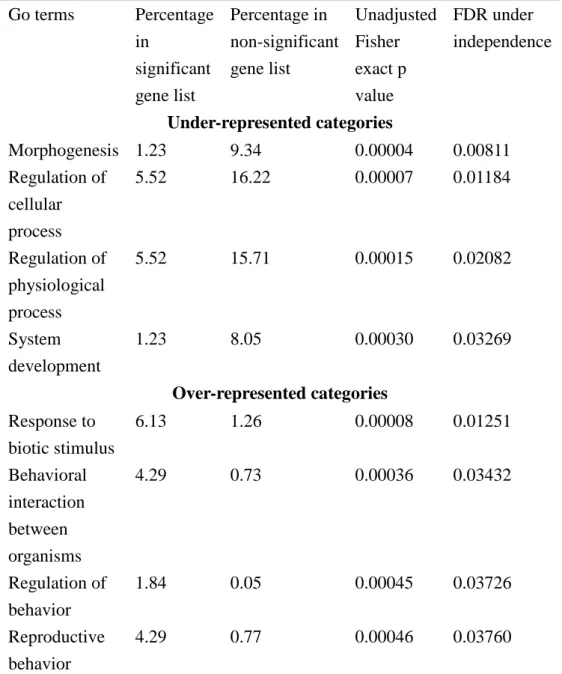
The genes were divided into 2 gene lists: significant and non-significant under p<0.001 between Z and M. Then the associations between biological process and the two gene lists was tested at GO level 3 with FatiGo [72]. The GO terms with significant difference between the two lists were shown in Table 2. The differentially expressed genes were under-represented in five categories: regulation of cellular process, morphogenesis, organ development, cell communication and regulation of physiological process. This indicates that the expression of genes in these five categories may be under strong stabilizing selection, which also consistent with the important role they play in lives. Three out of four over-represented categoriesarebehaviorrelated,including “Behavioralinteraction between organisms“, “Regulation ofbehavior“,and “Reproductivebehavior“,correlating nicely with ourexpectation that behavior related genes would contribute the difference between M and Z races. This study also
demonstrates the feasibility of pool line strategy in identifying race-defining genes. Table 1. Numbers of differentially expressed genes between M and Z behavioral races under different P value and FDR (in parenthesis).
<1e-04 <0.001 <0.01 <0.025 <0.05 # of genes 212 (36) 453 (98) 1106 (280) 1678 (432) 2347 (662)
Single line study
We also carried out single line comparison. cDNA from Z30 (Z race) was labeled with Cy3 and hybridized with Cy5-labeled Fr (M race) cDNA. We also did dye swap. After image analysis,
background correction, and normalization, the log-2 expression intensities were analyzed using a linear mixed model with fixed effect for different fly lines and a random effect for arrays. T-tests were applied to call genes significantly deferential expressed genes. At P = 0.001 level, there are 1138 genes
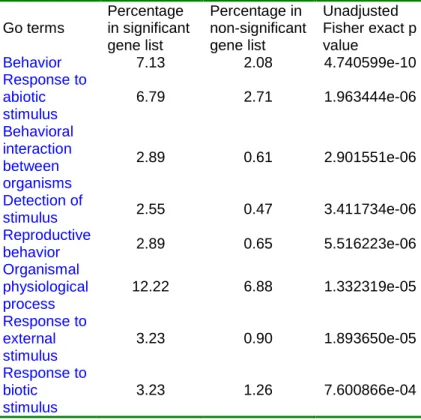
differentially expressed between Fr and Z30. Table 3 lists over-represented Go categories. While many categoriesrelated to “Responseto stimuli”arein thelist,genesrelated to behaviorregulation,including “Behavior”,“Reproductivebehavior”,and “Behavioralinteraction between organisms”,also showed up.
Table 2. List of under- and over-represented Go categories for significant genes from pooled sample hybridization. Go terms Percentage in significant gene list Percentage in non-significant gene list Unadjusted Fisher exact p value FDR under independence Under-represented categories Morphogenesis 1.23 9.34 0.00004 0.00811 Regulation of cellular process 5.52 16.22 0.00007 0.01184 Regulation of physiological process 5.52 15.71 0.00015 0.02082 System development 1.23 8.05 0.00030 0.03269 Over-represented categories Response to biotic stimulus 6.13 1.26 0.00008 0.01251 Behavioral interaction between organisms 4.29 0.73 0.00036 0.03432 Regulation of behavior 1.84 0.05 0.00045 0.03726 Reproductive behavior 4.29 0.77 0.00046 0.03760
6
Single vs. pool line results
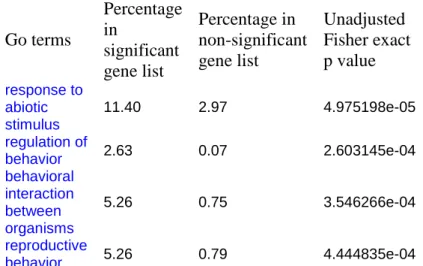
As mentioned above, genes identified by pooled sample represent mean differences and may have very different phenotype distribution (see background and significance section). To access the variability of these genes, we compared the result from pooled vs. single lines. Number of genes obtained from single line study is about 2.5 times greater than significant genes from pool line hybridizations. This difference is actually expected as single line hybridization includes many polymorphic genes within each race (Fig. 3). Of 453 significant genes, 255 are overlapped with Fr and Z30 comparison. This 56% (255/453) of overlap seems to suggest the inconsistence between two experiments. Because the genes selected by single line hybridization should include all the pool line identified genes. However, gene expression as a complex trait may have the same mean with very different distribution. That is pool line identified genes may have different means with largely overlapped distribution and not be segregated between races. In this case, it is not necessary that two random chose lines are also different at the same set of genes. On the other hand, the true race-defining genes should include a group of genes with their function related to racial differences which is mating behavior. The intersection of two experiments should represent or be close to true race-defining genes. The over-represented functional categories for genes overlapped between pool and single line study are listed in Table 4. As expected, three out of four functional categories are related to behaviorregulation,including “regulation ofbehavior”,“behavioral interaction between organisms,and “reproductive behavior”.
Based on Table 4, we are confident that microarray technique practically used in our lab can produce consistent and reliable results. In addition, our strategy of identifying race-defining genes is
Table 3. Over-represented Go categories for significant genes from Z30 and Fr hybridization. Go terms Percentage in significant gene list Percentage in non-significant gene list Unadjusted Fisher exact p value Behavior 7.13 2.08 4.740599e-10 Response to abiotic stimulus 6.79 2.71 1.963444e-06 Behavioral interaction between organisms 2.89 0.61 2.901551e-06 Detection of stimulus 2.55 0.47 3.411734e-06 Reproductive behavior 2.89 0.65 5.516223e-06 Organismal physiological process 12.22 6.88 1.332319e-05 Response to external stimulus 3.23 0.90 1.893650e-05 Response to biotic stimulus 3.23 1.26 7.600866e-04
applicable. By applying the current methodology we should be able to find genes corresponding to racial differentiation. Further study on population genetics and gene functions will help us to understand the mechanism of speciation.
Table 4. Over-represented Go categories for genes overlapped between pooled samples and single line hybridization.
Go terms Percentage in significant gene list Percentage in non-significant gene list Unadjusted Fisher exact p value response to abiotic stimulus 11.40 2.97 4.975198e-05 regulation of behavior 2.63 0.07 2.603145e-04 behavioral interaction between organisms 5.26 0.75 3.546266e-04 reproductive behavior 5.26 0.79 4.444835e-04
出席國際學術會議心得報告
計畫編號 NSC 96-2311-B-002-004 計畫名稱 兩種行為上分化的果蠅種族之基因表現差異研究 出國人員姓名 服務機關及職稱 王弘毅 台灣大學臨床醫學研究所 會議時間地點 2007 年 6 月紐西蘭基督城 會議名稱 Evolution 2007發表論文題目 Transcription regulation at incipient stage of speciation 一、參加會議經過
Evolution 2007 是 Society for the Study of Evolution, American Society of Naturalists, 以及 Society of Systematic Biologists 等三個學會所聯合舉辦的年度會議。也是演化生物學界兩大年 度盛會之一,今年首度移師至紐西蘭舉辦。
本次會議包括,親源地理(Phylogeography),分子演化(Molecular Evolution),種化
(Speciation),生態遺傳(Ecological genetics),生物資訊(Bioinformatics),動物遺傳育種(Animal mating/breeding system),植物交配系統(Plant mating systems),族群遺傳(Population genetics), 入侵生物(invasive species),數量遺傳(Quantitative genetics),行為演化(Behaviour evolution), 基因體學(Genomics),蛋白質體學(Protemics),生物地理(Biogeography),共演化(Coevolution), 適應(Adaptation),群聚演化(Evolution of ecological community),性擇(Sexual selection),保育 生物學(Conservation biology),性的演化(Evolution of sex)等 20 個主題。
由於紐西蘭位於南太平洋,與大部分的大陸分離甚久,長久的隔離使得紐西蘭孕育出獨 特的生物相。因此紐西蘭是研究島嶼隔離與物種演化的絕佳地點,生物地理學的研究是紐西 蘭以及其附近島嶼國家的重點研究項目。所以在這次的會議中,關於生物地理以及其相關的 研究是重點報告的項目之一。 本次會議的另一個重點在於研究表現型(phenotype)與基因型(genotype)的關係。近年來由 於基因體工具的快速發展,使得在模式動物中研究表現型與基因型的關係成為可能。其中一 個例子是研究果蠅耐熱以及抗寒機制的基因。其實驗設計如下圖,首先選取名為 Or2b 的果蠅 品系,並將之置於兩種不同溫度下培養。經過 60 代之後,兩組果蠅已經各自適應了不同溫度 環境。並且由於經過 60 代的近親交配(inbreeding),兩組果蠅內部的基因多樣性均已消失,而 成為一單一化的族群。 在得到這樣的兩個族群之後,研究人員萃取其 RNA 並比較兩者基因表達量的改變。由 於這兩個族群是來自同一原始族群經過 60 代溫度選擇所形成的,不同表達量的基因,很可能 與溫度適應友直接的相關。 另一方面,研究人員將兩個族群的果蠅交配並且再將第一代的子代彼此交配產生第二代
子代(F2)。F2 果蠅被放置在不同的溫度環境中,觀察並記錄牠們對不同溫度的反應得到其表 現型。之後再利用已知的遺傳標誌(genetic marker)分析不同果蠅的基因型,並且與表現型比 較,找出與溫度適應有關的染色體片段。 比較染色體片斷與 cDNA microarray 所得到的基因,兩者相符的基因就很有可能是控制 溫度適應的基因。在得到這些基因後進一步分析不同基因的功能,可以連結控制溫度適應的 基因以及其表現型之間的關係。 二、與會心得 本次會議除了一般的口頭報告之外,還針對特定的議題邀請專家學者發表一系列的研究 成果。其中是一個是關於太平洋上島嶼原住民的起源。不同的研究利用遺傳,文化,考古與 語言等等資料,以不同的證據與角度來探討發生在四五千年前“南島民族”的擴散與遷移。 其中根據語言學的方式所得到的”語言”親緣樹,顯示了台灣原住民的語言不但即有可 能是所有南島語系中最原始的語言,更是保有了最多樣,最特殊的語系。根據此一推論,配 合其他如考古學與文化上的證據,研究者提出了所謂"Express train"假說,也就是現今所有的 西太平洋原住島民與紐西蘭原住民,都可能是在短時間內由台灣擴散出去。 然而根據遺傳學的證據,台灣原住民是由菲律賓或其他大洋州島嶼遷徙而來的。因此這 兩種方法所得到的推論完全相反。兩個假說都有其立論基礎與支持證據,爭論也未完全終止。 可惜的是台灣的生物學家在這一個問題的研究上聲音實在不大,空有最豐富的研究材 料,卻只有零星的研究與薄弱的證據,在科學的討論中很難的有發言的餘地。
國際合作計畫赴國外研究心得報告
計畫編號 NSC 96-2311-B-002-004 計畫名稱 兩種行為上分化的果蠅種族之基因表現差異研究 出國人員姓名 服務機關及職稱 王弘毅 台灣大學臨床醫學研究所 出國時間及地點 美國芝加哥 合作研究機構 芝加哥大學 合作計畫名稱 合作計畫主持人 吳仲義 出國事由 研究 一、內容及成果:During this trip to Chicago, I discussed with Chung-I Wu and Mary Sara McPeek about the
way to quantify proportion of cis- and tran- component derived from microarray study. This part
along with our previous results is now submitting to PNAS.
二、建議事項 NA
三、攜回資料
Please see attachment below.
Classification: Biological Science
Title: Genetic architecture of expression differences between Drosophila races - Analysis of chromosome substitutions
Hurng-Yi Wang1*, Yonggui Fu2,3*, Mary Sara McPeek4, Xuemei Lu2,3, Sergey Nuzhdin5, Anlong Xu2,3, Mao-Lien Wu6, and Chung-I Wu6
1. Graduate Institute of Clinical Medicine, National Taiwan University, 7 Chung-Shan South Road, Taipei, Taiwan 100
2. State Key Laboratory for Biocontrol, Department of Biochemistry, College of Life Sciences, Sun Yat-Sen University, 135 Xingang Xilu, Guangzhou, Guangdong, P. R. China 510275
3. International Center for Evolutionary and Genomic Studies, Sun Yat-Sen University, 135 Xingang Xilu, Guangzhou, Guangdong, P. R. China 510275
4. Department of Statistics, University of Chicago
5. Section of Evolution and Ecology, University of California Davis
6. Department of Ecology and Evolution, University of Chicago, 1101 E 57thSt, Chicago, IL, USA 60637
* these authors contributed equally to this work
Corresponding author:
Hurng-Yi Wang
Graduate Institute of Clinical Medicine, National Taiwan University, 7 Chung-Shan South Road, Taipei, Taiwan 100
TEL: +886 2 23123456 ext 6614 FAX: + 886 2 23709820
Chung-I Wu
Department of Ecology and Evolution, University of Chicago, 1101 E 57thSt, Chicago, IL, USA 60637
TEL: +1 773 7023234
Manuscript information: 16 text pages, 1 figure, and 5 tables
Abstract
The separation of cis- and trans-regulation of gene expression is straightforward if the genetic architecture is simple. However, cis- and trans-control may coexist and interact epistatically, thus blurring their distinction. To dissect the genetic architecture of expression variation at the
genomic level, we analyzed the full set of chromosome substitution lines between the two
behavioral races of Drosophila melanogaster. Our observations: 1) Only about 3% of the genes with an expression difference are purely cis-regulated. In fact, relatively few genes are governed by simple genetics as nearly 80% of expression differences are controlled by at least two
chromosomes. 2) For 14% of the genes, cis-regulation does play a role but usually in conjunction with trans-regulation. This joint action of cis- and trans-effects, either additive or epistatic, is referred to as inclusive cis-effect. 3) The percentage of genes with inclusive
cis-effect increases to 32% among genes that are strongly differentiated between the two races. 4) We observed a non-random distribution of trans-acting factors, with a substantial deficit on the second chromosome. Between Drosophila racial groups, trans-regulation of expression difference is extensive and cis-regulation often evolves in conjunction with trans-effects.
Introduction
Knowledge of the genetics of complex traits is fundamental to modern medicine, agriculture and evolutionary biology. Among all complex traits, gene expression as phenotype may be most amenable to genetic analysis. The first question about expression regulation naturally is whether there is a cis-component. (Cis-regulation refers to the control of expression by the gene itself while trans-regulation refers to the influence of the genetic background.) The partition of cis- vs. trans-component of expression regulation makes it possible to identify at least one gene controlling the phenotype, namely the expressed gene itself. Many studies have elegantly addressed the first question at various levels of divergence. For example, one may measure the expressions of two alleles at the locus of interest in a common genetic background. Because the collection of
trans-acting factors in the same cellular environment is assumed to affect the two alleles equally, asymmetric allelic expression implies differences due to cis-regulatory divergence1-3.
A second, and presumably more difficult, question is how strong cis-regulation is relative to trans-regulation, as well as to the interactions between the cis- and trans-components. Many genes could be simultaneously regulated by both cis- and trans- elements. Imagine that the different expression of an X-linked gene between two species is controlled jointly by its cis-element and two transcription factors, one on each of the two autosomes. It is the X-II-III interaction that dictates the expression level. In an experiment that replaces the X- element, one may conclude 100% cis-effect but, in a separate experiment that replaces the transcription factor on II, one may conclude 100% trans-effect. In principle, the estimated total cis- and trans-effect could exceed 100%. Few studies have tackled the complexity of the genetic control of gene expression.
To answer the second question, we need to quantify the various components of expression regulation that include cis-, trans- and cis- by trans- control. The use of a large number of segregates in F2 crosses allows examination of both cis- and trans-acting regulatory variation4-6. Such an analysis, however, requires extensive genotyping on various recombinant lines. In addition, with the association of thousands of markers and genes, it is literally impossible to quantify the relative contribution of cis-, trans-, and their interaction. A simpler alternative is to construct the whole chromosome substitution lines which would enable us to measure the expressions under different chromosome combinations reproducibly.
The genetic architecture, specifically the relative contribution of cis- and trans-regulation, may depend on the extent of divergence between the subjects under comparison. Between two randomly chosen genomes from the same population, it is possible that the 5’-regulatory regions have not differentiated much and the cis-component may be small. When two genomes have diverged, both cis- and trans-effect would become greater and their relative magnitude becomes less predictable.
Clearly, the level of divergence should be an important parameter in the analysis of cis- vs. trans-effect. However, genetic differences between species generally make their hybrids unhealthy resulting in difficulties in chromosome replacement. On the other hand, individuals or lines from same population may be too similar to have much cis-effect. Populations that have shown some degree of phenotypic divergence provide a reasonable balance. The Zimbabwe race of D.
melanogaster vis-à-vis the cosmopolitan populations are thus well suited to such a purpose.
In this study, we used a standard M (Fr) and Z line (Z30). These two lines have been extensively analyzed for their behavioral, physiological and molecular divergence7-14. The purpose of this study is to dissect the genetic architecture of transcription regulation. By comparing the expression differences between the two parental (Fr and Z30) and six substitution lines (constructed by Hollocher et al.7; see Fig. 1 and Materials and Methods), we were able to determine the
contribution of cis-, trans- and cis-by-trans components to gene expression.
Result
The experimental design is given in Fig. 1. We shall designate the 2 pure lines (Fr and Z30) and the 6 whole-chromosome substitution lines as ZZZ (i.e., Z30), MZZ, ZMZ, ZZM, MMZ, MZM, ZMM and MMM (Fr), respectively. Each letter in this triplet notation designates the origin of the X, II, and III chromosome. The IV chromosome is not monitored and is a mixture of Fr and Z30 when the substitution lines were constructed. Note that the 3 major chromosomes in each
substitution line were extracted as a whole without recombination (see Hollocher et al.7).
After image analysis, background correction, and normalization, the log-2 expression intensities were analyzed using a linear mixed model with fixed effect for different fly lines and a random effect for arrays. The residuals from the normalization model were subjected to gene specific models of the form rijk= μ + Ai+ Dj+ Gk+ εijk, where Gkis kth genotype (k = 1- 8) and
will be specifically modified in each section below.
We first identified genes that are differentially expressed between ZZZ and MMM by t-test. Four kinds of t-tests were used and we considered only genes that pass all four t-tests. The genetic control is then analyzed by studying the expression in the 6 substitution lines. At a false discovery rate (FDR) of 0.01, 188, 493, 534, and 15 genes on the X, II, III, and IV chromosome, respectively, were found to be differentially expressed between MMM and ZZZ (Table S1). These genes are distributed among the 4 chromosomes much like the rest of the genome (P=0.23 by2test). The mean expression ratio of the more highly expressed line over the less highly expressed line is 1.69. In the following analysis, we did not include the 15 genes on the IV chromosome, as the
substitution lines could not be identified by their IV chromosome origin.
Average effects across all genes.
The full model for the genetic control of expression differences is given as
rijk= μ + Ai+ Dj+ ChrX+ ChrII+ ChrIII+ ChrX,II+ChrX,III+ ChrII,III+ ChrX,II,III+ εijk(1).
With 3 chromosomes, the expression of each gene can potentially be explained by 7 different terms –the 3 single-chromosome effects (ChrXetc), the 3 interaction terms between any 2 of the 3
chromosomes (ChrX,IIetc) and the highest level interaction with all 3 chromosomes. To apply
this model, we took two different approaches. In the first approach, we computed the proportion of variance contributed by each of the seven terms, averaged across all 1215 genes (=188+493+534, see above). In the second approach, we examined the relative contribution of each term for each individual gene. Although we are mainly interested in the genetic control for each gene, the average patterns across loci, which usually have better statistical support, may provide the corroborative evidence to the gene-by-gene analysis.
The average proportions of variances contributed by the 7 terms are given in Table 1. These proportions are presented for genes on each chromosome separately as well as jointly. Note that the 4 interactive terms collectively account for 32.3% (=27.1% + 5.19%) of the total variance.
Testing models of pure cis*- and pure trans*- control
In this section, each gene was individually analyzed. We first tested the two simplest models of genetic control. In the pure cis- model, the expression level is fully controlled by the gene itself with no influence from the genetic background. In the pure trans-model, the expression is controlled entirely by the genetic background with no input from the expressed gene.
Here, we have to distinguish between chromosomal cis-effect and genic cis-effect. Because the genetic resolution is at the whole chromosome level, we use the notations, cis*- and trans*-effect, for the whole-chromosome analysis in the statistical models. cis*-effect is the combined effect of the (true) genic cis-effect and all trans-effects of genes on the same chromosome of the expressed locus. In other words, cis*-effect is an over-estimate of the true cis-effect and trans*-effect does not include same-chromosome trans-effects. In Table 2, we present the cis*-and trans*- effect; the true cis-effect will be estimated in Table 3.
Likelihood ratio test was preformed for the pure cis*-effect model which is rijk= μ + Ai+ Dj
+ Chrl+ εijk, where l is the chromosome from which the expressed gene is located (l = X, II or III).
The alternative model expands the “Chr”term above into the full model of Eq. (1) above. In Table 2, it is shown that the cis*-effect model is accepted over the alternative full model for only a small fraction of genes. At the nominal acceptance rate of 5%, the percentages of genes regulated by a complete cis* effect on X, II, and III chromosome are 6.9%, 2.4%, and 10.1%, respectively, with an average of 6.5%. Given that the cis*-effect (at only 1.5% above the nominal rate of 5%) is still an overestimate of the genic cis-effect, it seems safe to conclude that not many genes
between the Z and M lines are purely cis-regulated. As a corollary, 93.5% of the genes must have a trans-component in their regulation.
We next test the complete trans-*effect model in which gene expression is controlled
exclusively by trans-chromosomes (e.g., the II and III chromosomes for X-linked genes). The null model of this test is rijk= μ + Ai+ Dj+ Chrm+ Chrn+ Chrm,n+ εijk, where m and n are the two
trans-chromosomes (m, n = X, II, III). The alternative is again the full model described above. At P = 0.05, the percentages of genes regulated entirely by the trans*-effect are 7.4%, 37.1%, and 4.5% for the X, II, and III chromosome, respectively (Table 2). Because the sums of the two rows of Table 2 are far below 100%, the bulk of genes must be jointly regulated by cis- and trans-chromosomes.
A surprising finding in Table 2 is that genes on chromosome II appear to be subjected to weak cis*-control and relatively strong trans*-control. Given the near parity in gene number between the two autosomes, such a chromosome-wide difference in transcription regulation demands an explanation. The answer appears to be a difference in trans-regulating capacity across chromosomes (see below).
Selecting the best model for each gene
The criteria for pure cis-* and pure trans*-effect by the likelihood ratio test above may be too stringent to have much explanatory power. An alternative is to search for the best model for each gene by applying the backward selection method with Akaike information criterion (AIC15). In this analysis of model selection, each of the seven terms of genetic effect in Eq. (1) is sequentially removed according to AIC, until further removal resulted in worse fit. Different search criteria including Bayesian information criterion (BIC) and likelihood ratio test (LRT) were also used for
supplement (Table S2 & S3).
In our analysis, 77 genes could not be unambiguously assigned to a specific model and were removed from further analysis. Among the 1138 genes analyzed, the best model is a
single-chromosome effect model for 21.4% of the genes (Table 3). In these cases, only one of the three terms, ChrX, ChrIIor ChrIII, is needed in the selected model. A more complex 2-chromosome
model is as follows: All models that include the ChrX,IIterm or contain both the ChrXand ChrII
terms are grouped into the X+II two-chromosome category, provided that all other terms containing the chromosome III effect are not needed. A parallel procedure is used for X+III and for II+III, respectively. Among these categories, 28.6% of the genes can be explained by the control of two different chromosomes (that act either independently or jointly). Lastly, all three major
chromosomes are necessary to explain the expression differences for 50% of the genes. To conclude, nearly 80% of the genes are regulated by two or three different chromosomes for their expression.
Note that Table 1 and Table 3 present very different information. For example, (X,II) in Table 1 is for the interactive term only, whereas “X and II”in Table 3 indicates the presence of effects from both X and II, which include both interactive and additive terms. In Table 1, the average contribution of a single chromosome ranges from 6.7% to nearly 40%. It is therefore not
unreasonable to see only 21.4% of genes whose expression variation is entirely attributed to the effect of one single chromosome.
Multi-chromosome control can be either addtive or epistatic. In Table 3, 326 genes are controlled by 2 chromosomes. Among them, 241 (73.3%) have the interactive term, ChrX,II,
ChrX,III, or ChrII,III, of Eq. (1). Among the 569 genes under the control of all 3 chromosomes, 560
(98.3%) of them have at least one interactive term. In total, 70.3% ([241+560]/1138) of the genes in Table 3 are influenced by epistatic interactions. Since we cannot account for epistatic
interactions between genes on the same chromosome, the percentage 70.3% could be a conservative estimate. In comparison, Table 1 shows that the average contribution of the epistatic component to the total variance of expression across all loci is about 32%, as mentioned above. Thus, while the average epistatic effect is 32%, for nearly 30% (100% - 70.3%) of the genes, the epistatic effect is statistically indistinguishable from 0%.
Estimating the pure cis-effect at the genic level
The proportion of genes controlled solely by the cis*-chromosome is estimated to be 9.6% (Table 3 and Row 1 of Table 4). Since the chromosomal cis*-effect includes both the genic cis-effect and intra-chromosomal trans-effect, the estimate of 9.6% is most likely an overestimate of the genic cis-effect. (Without *, cis- denotes genic cis-effect.) The question is how many genes, if any, would show a genic cis-effect if the overestimation is removed.
In this section, we will estimate the proportion of genes that are controlled solely by the cis-element. This proportion is of course no higher than 9.6%. (In the next section, we will estimate the proportion of genes that show a genic cis-effect, accompanied by some trans-effects in the background.) Previously, Osada et al. (2006) used the same set of lines as this study on the Affymetrix arrays. In their observations, the difference in gene expression between the two pure lines (ZZZ and MMM) is correlated with gene expression difference between two substitution lines that differ in the chromosome where the gene is located (see their Fig. 1). They suggested that the Z-M expression differences have a detectable (genic) cis-effect.
To estimate the genic cis-effect, we need to evaluate the intra-chromosomal trans-effect and subtract this effect from the whole chromosome cis*-effect. Here, we assume that
intra-chromosomal and inter-chromosomal trans-effects are comparable. In Table 1, the
trans-effect of X on the II chromosome accounts for 21.14% of the variance. The corresponding percentage for the III chromosome is 20.56%. The two numbers are close with an average of 20.84%, suggesting that the trans-regulating strength of X is similar across target chromosomes. For chromosomes II and III, the interchromosomal trans-effects are 7.7% and 32.5%, respectively. Thus, each chromosome’s trans-effect appears comparable on different target chromosomes, but there is a large difference in the average trans-effect of each chromosome. The difference is particularly notable between the two autosomes. Although the II and III chromosomes are roughly of the same size, the proportion of variance contributed by the latter is more than 3 fold as high as that contributed by the former. In contrast, the X chromosome contributes as much as 2/3 of that of chromosome III while it is slightly greater than half the size of the latter.
A most interesting feature of Table 1 is the difference between cis*- and trans*-effects. For X, the cis*-effect is 30.33% whereas the two trans*-effects are 21.14% and 20.56%, respectively. The difference between the cis*- effect and the average trans*-effect, at 9.49%, is highly significant (P < 10-8). In the last column of Table 3, we refer to this difference as “genic cis-effect”. The patterns are also true for the two autosomes with the genic effects are 5.27% and 7.05%,
respectively (P < 10-6). We estimate the genomewide genic cis-effect at about 6.7%.
The similar procedure may now be applied to estimating the number of genes that are under pure cis-regulation (or those that have a cis-component in the next section). In Table 3, when the number of genes with expression difference on each chromosome is adjusted for the size of chromosome, the cis-effect is also detectable. For example, the effect of X on X is seen in 24 genes (per ~2000 genes), but in only 9.7 or 12.7 genes for the effect of X on II or X on III,
respectively. The average of the two latter numbers is considered the trans-acting effect of X. In the last column of Table 3, the transacting effects per 2000 target genes are shown to be 11.2, 3.4 and 20.1 for X, II and III, respectively. Again, each chromosome’s trans-effect appears
comparable on different target chromosomes, but there is a large difference in the average trans-effect of each chromosome. Adjusted for its size, Chromosome II is deficient in its transacting effect in comparison with the other two.
The number of differentially expressed genes on each chromosome that are under cis*-effect is reproduced in Row 1 of Table 4. The estimated number of genes that have a genic
cis-component is thus the difference between the number on Row 1 of Table 4 and the estimated number of genes under same-chromsome trans-control (see Methods). For example, the number for the X chromosome is 12.8 (=24-11.2), or 7.5%, as shown in Row 2 of Table 4. For II and III, the proportions are 2.2% and 2.7%, respectively. For the genome as a whole, 3.2% of genes are purely cis-regulated (genic cis-effect only).
Estimating the inclusive cis-effect at the genic level
In the Z-M system, the proportion of differently expressed genes that are purely cis-regulated, at 3.2%, is almost negligible. A more useful estimate may be the proportion of genes with a detectable cis-effect regardless of the presence or absence of other effects. We suggest the term “inclusive cis*-effect”which is defined as follows. Inclusive cis*-effect for any X-linked genes is the summation of terms that include X. In other words, the effect is defined as including any combination of the following four terms in the selected model: Chr + Chr +Chr + Chr .
We first estimate the number of X-linked genes with an inclusive cis*-effect, which is 142 (=24+11+38+69 from Table 3), shown under the heading of X in Table 4. These are cases where the X chromosome plays a role (singly or jointly with other chromosomes) in the expression of X-linked genes. The same procedure is used for other chromosomes. On average, 78% of the expression differences have an inclusive cis*-effect and Chromosome II indeed has the lowest percentage of such genes (Row 3 of Table 4).
Like the estimation of genic cis-effect shown in Row 2 of Table 4, we extrapolate the inter-chromosomal trans-effect (which is observable) to estimating the intra-chromosomal
trans-effect. We shall use X-linked genes as an example. We need to estimate the cis-effect of x, x+II, x+III and x+II+III, where the lower case x denotes individual X-linked genes (rather than the whole X chromosome). The cis effect of x, in terms of the number of genes affected, has been shown to be 12.8 in Row 2. The cis-effects of x+II, x+III and x+II+III are estimated to be 2.76, 0 and 3.9, respectively (see Materials and Methods). The inclusive cis-effect for X-linked genes is therefore 19.5 (=12.8+2.76+0+3.9), or 11.4% of the affected genes. Across all chromosomes, 13.9% of genes have an inclusive cis-effect (Row 4).
In summary, only 3.2% of differentially expressed genes are purely cis-regulated but, when inclusive cis-effect is considered, 13.9% are cis-regulated. This comparison means that i) trans-effect dominates the regulation of gene expression at this level of divergence, and ii) when there is cis-effect, cis-regulation often occurs in a genetic background where trans-regulation is also in operation. The conclusion is consistent with the estimate of the average genic cis-effect across all genes, which is 6.7% of the total variation as shown in Table 1.
cis-effects in race-differentiating vs. non-race differentiating genes
We now address the issue whether the relative strength of cis-regulation increases as the level of divergence increases. Among the 1138 genes of Table 3, 238 are considered the more divergent group by the following criteria. In a separate study using multiple M and Z lines, 421 genes were labeled “race-differentiating”(Fu et al. submitted). For each of these 421 genes, the mean
expression of the 24 M lines is significantly different from that of the 15 Z lines at FDR < 0.01. Among the 421 genes, 238 are also represented in the set of 1138 genes analyzed in Table 3 and are referred to as “race-differentiating”genes. The remaining 900 genes are “non race-differentiating” as their expressions are different both between the Fr (the MMM line) and Z30 (ZZZ) lines and among different M and different Z lines.
We computed the average genic cis-effects separately for the two groups of genes, as shown in the last column of Table 1. When all genes are considered, genic cis-effect accounts for 6.7% of the expression variation. This proportion increases to 8.83% for race-differentiating genes and decreases to 5.95% for non-race differentiating genes. The difference is 2.88% (P < 0.05, two tailed t-test).
In Table 5, we again analyzed each gene individually. For race-differentiating genes, the percentages of genes with an inclusive cis-effect are 45.1%, 32.3% and 29.6% for X, II and III, respectively; the average is 32.0% (the lower half of Table 5). For “non-race differentiating” genes, the percentages of genes with a significant inclusive cis-effect are 14.3%, 15.3%, and 10.9% for X, II and III, respectively; the average is 13.2% (Table 5). The proportion of genes that have a cis-regulatory component is more than 2.5 times higher among “race-differentiating”genes than among the set that are not race-differentiating. Moreover, the magnitude of changes for
race-differentiating genes is generally higher than for the non-race differentiating ones. The mean fold differences are 2.32 for the former and 1.59 for the latter.
Discussion
By analyzing the complete set of chromosome substitution lines between the M and Z races, we have been able to quantify the relative contribution of cis- and trans-regulation, as well as the interaction of the two components. Previous studies focused on cis and trans regulation mainly tried to identify the existence of cis and trans components6, 16-18. Recently, using pyrosequencing technology, Wittkopp et al1and colleague19were able to quantify relative contribution of cis and trans components in gene regulation. To our knowledge, this study is the first one to quantify cis, trans, and their interaction at genome scale. Furthermore, we can quantify the interaction in the absence of measurable cis and/or trans effect. We have also found that the relative contribution of the cis-component increases as the level of expression divergence increases. There have been several studies reporting various degrees of cis-regulation1, 2, 4, 16, 20. While the differences in these studies may, to some degree, depend on the method of analysis, the level of divergence must have played a role as well. In Table 5, the number of genes showing a cis-effect (inclusive cis-effect >0) increases from 13% for non-race differentiating genes to 32% for race-differentiating genes, a 2.5 fold jump.
It is possible that, as the cis-regulatory sites become more and more divergent, the majority of differently expressed genes would have a measurable cis-effect. This has in fact been
reported1. At the same time, most of these genes may have a trans-component as well. Note that more than 93% of genes in Table 2 do have a trans-effect. For the many genes that have both a cis- and trans-effect, the question then is their relative magnitude. We note that, while 32% of race-differentiating genes may have an inclusive cis-effect, the cis-component contributes only approximately 28% to the total variation. (In Table 1, it is shown that the average effect of
cis-component is 8.83% but, since only 32% of genes show a cis-effect, these genes should have an average effect of 28% [= 8.83% / 32%].)
As the level of divergence increases, say, between two good species, the demarcation between cis- and trans-effects becomes less meaningful. The main reason is the interactions between cis- and trans-factors. For example, the cis-factor may increase the expression of a particular gene, whereas a trans-factor from the same species may decrease it. Alternatively, neither cis- nor the trans-factors can affect the expression by themselves but their interactions can. Table 1 shows that the interaction terms between chromosomes account for 32.3% (27.1%+5.19%) of the expression variation. Interactions among genes on the same chromosome were not even included. We have also observed substantial counter-balancing effects between Z and M races (i.e., one chromosome increases the expression whereas another chromosome decreases it; unpublished results).
In the context of such complex genetics, the inclusive cis-effect may be a useful concept. A gene is considered to have an inclusive cis-effect if the cis-factor contributes to the expression variation, regardless of whether it exerts the effect singly or jointly with trans-factors. It has been known that many phenotypic variations between species are subjected to complex genetic control21,
22
. An important reason for studying the control of gene expression is that it may ultimately inform about the genetics of these “classical”phenotypes, including behavior, disease resistance, reproductive success, and so on. Although the regulation of gene expression may often be complex, a detectable inclusive cis-effect means that at least one controlling factor can be identified, namely, the cis-factor of that gene. Thus, the inclusive cis-effect can be a link between
phenotypes and part of the genetic circuitry.
reveals that II chromosome has less effect on Z-specific male behavior (Jennifer, unpublished data). Moreover, although X chromosome seems to have less effect on behavioral differences7, severer variability reduction in X chromosome than autosomes in M-type fly has been previously noticed23,
24
suggesting its possible role of ecological adaptation. To put above observations together, it is possible that II chromosome plays little role in Z-M differences at least in male part.
Materials and Methods
Fly Strains. One isofemale M line (Fr, hereafter referred as MMM) and one isofemale Z line (Z30,
hereafter referred as ZZZ), both of which are commonly used as standards to study mating behaviors25, and 6 chromosome substitution lines MZZ, ZMZ, ZZM, MMZ, MZM, and ZZM7, were used. For chromosome substitution lines, M indicates that a homozygous X, 2nd, or 3rd chromosome is derived from the MMM (Fr) line, and Z indicates the corresponding homozygous chromosomes derived from the ZZZ (Z30) line. The origin of 4th chromosome is ignored in this setting.
Microarray hybridization. We designed the hybridization scheme to efficiently estimate
differences between MMM and ZZZ lines and chromosome effects (Fig. 1). Each of six
chromosome substitution line was measured 4 times and two parental lines were measured 14 times. One hundred to 150 three-to-five-day-old male flies were starved for one hour prior to sedation on ice. Heads were dislodged from the bodies using sieves after flies were snap frozen in liquid nitrogen TRIzolR Reagent (GIBCO BRL) was used for RNA extraction. After precipitation, the RNA was then re-suspended and purified with phenol and chloroform. cDNA syntheses were carried outby Array 900 expression array detection kit(GenisphereInc.)with manufacture’s protocol. Arrays were from DGRC (Drosophila Genomcis Resource Center) of Indiana University. We hybridized and washed the samples according to the protocol from DGRC26.
Array analyses. 26 arrays were scanned using a GenePix Axon scanner and data were extracted
using GenePix 6 to give Cy3 and Cy5 intensities. The flowing analyses were conducted in R computing environment (http://www.r-project.org). We first transformed the data using spatial-intensity joint loess. This was done with R/maanova package27. The transformed
log2-intensites for all 15552 spot measures yijkwere subjected to a normalization model of the form
yij= μ + Ai+ Dj+ ADij+ εij,whereμ isthesamplemean,Aiis the effect of the ith array (i = 1-26),
Djis the effect of jth dye (Cy3 or Cy5), ADijis the interaction involving dye and array, and εijis the
stochastic error. In this model, array (Ai) was modeled as random effect and was assumed to have a
normal distribution with a mean of zero (N(0, )).2A
Differentially expressed genes between ZZZ and MMM. The residuals from normalization
model were subjected to gene specific models of the form rijk= g + Ai+ Dj+ Gk+ εijk, where g is
the average intensity associated with a particular gene; Gkis kth genotype (k = 1- 8). Array (Ai) here
and thereafter represents as spot effects on the arrays and is also treated as random effect. T-test was performed to identify differentially expressed gene between MMM and ZZZ. Four kinds of t tests namely, standard t test ; global t test, using an estimate of error variance that is pooled across all genes; regularized t test, combing information from gene-specific and global average variance estimates by using a weighted average of the two as the denominator for a gene-specific t test; and Fs test proposed by Cui et al. 28were conducted to access number of differentially expressed genes between MMM and ZZZ. We also carried out permutation analysis by randomizing the residuals (within each gene) from the fitted null model 1,000 times and re-computing the t-statistics.
The result did not differ from those obtained using standard statistical tables. All above tests were done with R/maanova package.
Variance component estimation
rijk= μ + Ai+ Dj+ ChrX+ ChrII+ ChrIII+ ChrX,II+ChrX,III+ ChrII,III+ ChrX,II,III+ εijk (1)
From Eq. 1, we grouped seven genetic terms under Gkand call μ+ Gkthe genetic effect. After the
model fitting, we obtainedrˆijk ˆAˆi Dˆj Gˆk, where the hat means that the estimated parameter values are plugged in. We then defined fˆk ˆGˆk the fitted genetic effect.
For any chosen gene, the components of variance due to the terms listed in Eq. 1 were calculated as following: 2 , , 2 ) ˆ ˆ ( 64 1
MZ m l Mlm Zlm X f f 2 , , 2 ) ˆ ˆ ( 64 1
M Z m l lMm lZm II f f 2 , , 2 ) ˆ ˆ ( 64 1
MZ m l lmM lmZ III f f 2 , , 2 , (ˆ ˆ) 64 1
MZ m l m l l llm X II f f , where l = Z if l = M and l = M if l = Z. 2 , , 2 , (ˆ ˆ) 64 1
MZ m l l lm lml X III f f , where l = Z if l = M and l = M if l = Z. 2 , , 2 , (ˆ ˆ) 64 1
MZ m l l ml mll III II f f , where l = Z if l = M and l = M if l = Z. 2 s Z' of number odd hask khasevennumberofZ's 2 , , ˆ ˆ 64 1
k
k III II X f f For each genes, the proportion of genetic variance due to, for example, the main effect of the X chromosome as / T, whereˆX2 2 , , 2 , 2 , 2 , 2 2 2 ˆ ˆ ˆ ˆ ˆ ˆ
ˆX II III X II X III IIIII X IIIII
genes) to express uncertainty in a given average proportion of variance.
Hypothesis testing. Likelihood ratio tests were applied for hypothesis testing for genes rejected by
all four t test at FDR < 0.01. Under the complete cis-chromosomal model which is rijk= μ + Ai+
Dj+ Chrl+ εijk, where l is the cis-chromosome (l = X, II, III), the expression of the genes can be
explained only by the chromosome which gene sits (cis-chromosome). Alternatively, under the full model which is rijk= μ + Ai+ Dj+ ChrX+ ChrII+ ChrIII+ ChrX,II+ChrX,III+ ChrII,III+ ChrX,II,III+ εijk,
effects of all three chromosomes and their interactions were estimated. Likelihood ratio test were applied to compare the fit under complete cis-chromosomal model to that under the full model. Genes failed to reject the full model are selected as regulated only by cis-chromosome.
To test the complete trans-chromosome effect, we fit rijk= μ + Ai+ Dj+ Chrm+ Chrn+ Chrm,n+ εijk,
where m and n are the chromosomes other than cis-chromosome (tran-chromosome) (m, n = X, II, III). Likelihood ratio test were applied to compare the fit under complete trans-chromosomal model to that under the full model.
Model selection. We practiced the best chromosome model for genes rejected by all four t test at
FDR < 0.01. The residuals from normalization model were first fitted the full model, Eq.1, described above and we deleted one component at a time (backward selection) based on Akaike information criterion (AIC).
Different search methods were applied to select the best model. Although quantitatively different results were yielded, they agree with each other qualitatively. We, therefore, only present the result by AIC and leave the rest in supplement.
Estimating the contribution of cis- and trans- effect on gene expression. We assume for a given
chromosome or chromosome combinations, the inter- and intra-chromosomal trans-acting abilities are the same. For example, X chromosome alone regulates 22 and 34 genes on II and III
chromosome, respectively. Number of genes on the array from X, II, and III chromosome are, 1992(rounded off to 2000), 4509, and 5324, respectively. On per 2000 genes basis, the trans-acting effect of X chromosome on II and III chromosomes is 9.7 (22 x 2000 / 4509) and 12.7 (34 x 2000 / 5324) with the average of 11.2, the number represents trans-acting ability of X chromosome. Therefore, for 24 X-linked genes, we assume 12.8 (24 –11.2) of them would be regulated by cis factors.
The trans-acting ability of X+II on the III chromosome, adjusted to 2000 genes for the X, is 22 x 2000 / 5324 = 8.24. There are 11 genes on the X that are affected by X+II. Hence, the cis-effect of X+II on X-linked genes is 11 - 8.24 = 2.76.
The trans-acting ability of X+III on the III chromosome, adjusted to 2000 genes for the X, is 89 x 2000 / 4509 = 39.4. Since there are only 38 X-linked genes, less than the estimated 39.4 regulated by X+III, this combination does not have a detectable cis-effect on X-linked genes.
The effect of X+II+III on X chromosome was estimated from the ratio of trans/cis calculated from X+II and X+III combinations which is (8.24+39.4) / (2.76+0) = 17.26. Thus, cis effect estimated from the X+II+III combination is 69 / 17.26 = 3.99. In total, the estimated cis effect on X-linked genes is 12.8 + 2.76 + 3.99 = 19.5. The cis effects for the second and third chromosomes are estimated by the same procedure.
Acknowledgement
We thank Xinmin Li, Edward Touma, and Omar De La Cruz for technical supports. We also thank Jennifer Moran, Tony Greenberg, Shu Fang, Chauti Ting, Shun-Chern Tsaur, Josh Shapiro, and Supriya Kumar for comments and discussions during the study. HYW wish to express his sincere thank to James C.-K. Shen for his inspiration and encouragement. This study was supported by NIH grant to CIW and NSC grants to HYW.
References
1. Wittkopp, P. J., Haerum, B. K., & Clark, A. G. (2004) Nature 430, 85-88.
2. Cowles, C. R., Hirschhorn, J. N., Altshuler, D., & Lander, E. S. (2002) Nat Genet 32, 432-437.
3. Yan, H., Yuan, W., Velculescu, V. E., Vogelstein, B., & Kinzler, K. W. (2002) Science 297, 1143.
4. Brem, R. B., Storey, J. D., Whittle, J., & Kruglyak, L. (2005) Nature 436, 701-703. 5. Brem, R. B., Yvert, G., Clinton, R., & Kruglyak, L. (2002) Science 296, 752-755.
6. Yvert, G., Brem, R. B., Whittle, J., Akey, J. M., Foss, E., Smith, E. N., Mackelprang, R., & Kruglyak, L. (2003) Nat Genet 35, 57-64.
7. Hollocher, H., Ting, C. T., Wu, M. L., & Wu, C. I. (1997) Genetics 147, 1191-1201. 8. Hollocher, H., Ting, C. T., Pollack, F., & Wu, C. I. (1997) Evolution 51, 1175-1181. 9. Osada, N., Kohn, M. H., & Wu, C. I. (2006) Mol Biol Evol 23, 1585-1591.
10. Ting, C. T., Takahashi, A., & Wu, C. I. (2001) Proc Natl Acad Sci U S A 98, 6709-6713. 11. Alipaz, J. A., Fang, S., Osada, N., & Wu, C. I. (2005) Am Nat 165, 420-428.
12. Alipaz, J. A., Karr, T. L., & Wu, C. I. (2005) Am Nat 165, 429-438.
13. Greenberg, A. J., Moran, J. R., Fang, S., & Wu, C. I. (2006) Mol Biol Evol 23, 401-410. 14. Kohn, M. H., Fang, S., & Wu, C. I. (2004) Mol Biol Evol 21, 374-383.
15. Akaike, H. (1974) IEEE Transactions on Automatic Control Ac19, 716-723.
16. Morley, M., Molony, C. M., Weber, T. M., Devlin, J. L., Ewens, K. G., Spielman, R. S., & Cheung, V. G. (2004) Nature 430, 743-747.
17. Hubner, N., Wallace, C. A., Zimdahl, H., Petretto, E., Schulz, H., Maciver, F., Mueller, M., Hummel, O., Monti, J., Zidek, V., et al. (2005) Nat Genet 37, 243-253.
18. Wang, D., Sung, H. M., Wang, T. Y., Huang, C. J., Yang, P., Chang, T., Wang, Y. C., Tseng, D. L., Wu, J. P., Lee, T. C., et al. (2007) Genome Res 17, 1161-1169.
19. Landry, C. R., Wittkopp, P. J., Taubes, C. H., Ranz, J. M., Clark, A. G., & Hartl, D. L. (2005)
Genetics 171, 1813-1822.
20. Wayne, M. L., Pan, Y. J., Nuzhdin, S. V., & McIntyre, L. M. (2004) Genetics 168, 1413-1420.
21. Wu, C. I. & Palopoli, M. F. (1994) Annu Rev Genet 28, 283-308. 22. Wu, C. I. & Ting, C. T. (2004) Nat Rev Genet 5, 114-122.
Acad Sci U S A 92, 2519-2523.
26. Cherbas, L. (2005) (DGRC, Indiana University).
27. Wu, H. & Churchill, G. A. (2005) (The Jackson Laboratory, Bar Harbor). 28. Cui, X. & Churchill, G. A. (2003) Genome Biol 4, 210.
Figure legend:
Fig. 1 Drosophilia lines and hybridization scheme used in this study.
The sequence of alphabets represents chromosome origins (M or Z) in the order of X, II, and III. M indicates that a chromosome is derived from the MMM (Fr) line as homozygote, and Z indicates derivation from the ZZZ (Z30) line, also as homozygote. Each line with two arrow heads represents two microarrays (with dye swap). The line connects the two fly lines hybridized to the microarrays. In total, 26 arrays were used in this study - 12 between MMM and the 6 substitution lines, 12 between ZZZ and the same 6 substitution lines, and 2 between MMM and ZZZ.