ARTICLE NO. 0247
Epidemiology of Cervical Cancer in Taiwan
PAIRDONGWANG, M.D., PH.D.,*,1 ANDRUEYS. LIN, M.D., DR.P.H.†
*Taipei Wanhwa District Health Center, Taipei, Taiwan, Republic of China; and †College of Public Health, National Taiwan University, Taipei, Taiwan, Republic of China
Received October 26, 1995
plasm, accounting for more than 30% of all cancer forms Because the prevalence of several risk factors for cervical cancer, within this population [2]. The annual age-adjusted mortality including sexual behavior, reproductive patterns, contraceptive rate of cervical cancer in Taiwan increased from 6.06 per use, and cigarette smoking, has changed significantly over time 100,000 in 1974 to 10.02 in 1993, a 1.4-fold increase over among Taiwanese women, it is of interest to analyze the impact
20 years [3]. This malignancy is now the lead in cancer of these trends on the incidence and mortality rates for this cancer
incidence and is the third leading cause of cancer deaths during the decades between 1970 and 1990. The number of deaths
among Taiwan’s females, with a cumulative incidence and from cervical cancer was obtained from the Taiwan Provincial
mortality rate to age 85 of 4.2 and 1.3%, respectively [2]. Department of Health during the period from 1974 to 1992. Data
The trend in the mortality and incidence of this cancer of all incident cervical cancer cases from 1979 through 1990
ob-may be potentially influenced by exposures to changing envi-tained from the Taiwan Cancer Registry were also used for the
ronmental factors. Since temporal factors (e.g., age, period, analyses. The trends in the age-adjusted and age-specific rates
were examined. Age, period, and cohort effects on the incidence and birth cohort) are particularly sensitive indicators of a and mortality rates were also examined, using age – period – cohort changing environment, we have attempted to describe the (APC) models. The age-adjusted mortality rate has been increasing nature and timing of changes in cervical cancer incidence since the 1970s, particularly in both the youngest group (20 – 29 and mortality to define when and where etiologic clues to years) and the oldest group (65 years and over). While the
age-this trend may be found and to help assess the effects of adjusted incidence rate decreased from 1979 to 1990, and decreases
improved screening and measures of intervention. were apparent across all broad age groups, nevertheless, the
inci-dence of adenocarcinoma was moderating during the same time
period. The APC models disclosed a decreasing cohort effect for MATERIALS AND METHODS
the mortality and incidence rates among women born after 1936. Decreasing incidence rates after menopause were more consistent
Mortality Data and Population with a hormonal effect than a cohort effect. Declining trends in
cervical cancer incidence may be related to the screening practices
Information on all reported mortality cases in Taiwan from which may have counteracted the increasing prevalence of several
1974 to 1992 was abstracted from the annual reports pub-risk factors, although poor survival influenced the
incidence/mor-lished by the Taiwan Provincial Department of Health. Cer-tality differentials for cervical cancer. Continued surveillance is
vical cancers referenced in this study were defined as code warranted; however, attention might be directed to the trends in
180 in the International Classification of Disease, 8th and cervical adenocarcinoma. q 1996 Academic Press, Inc.
9th revision (ICD-8 and ICD-9). Age-specific midyear popu-lation estimations in Taiwan from 1974 to 1992 were ob-INTRODUCTION tained from data published by the Ministry of the Interior in Taiwan [4]. Mortality rates were stratified by 5-year age Although during the past several decades, the rate of cervi- groups.
cal cancer have declined significantly in Western countries,
it remains one of the most common female forms of cancer Incidence Data in developing countries [1]. In Taiwan, as recent as the early
1990s cervical cancer still remained the most frequent neo- The National Cancer Registry Campaign was begun only recently in Taiwan and hence information about the inci-dence of cervical cancer since 1979 was available for this
1
To whom correspondence and reprint requests should be addressed at
study. Data of all incident cervical cancer cases from 1979 Wanhwa District Health Center, No. 152, Tung-Yuan Street, Taipei,
Tai-wan, Republic of China. Fax: 886-2-3323514. through 1990 were obtained from the Taiwan Cancer Regis-344
Statistical Age – Period – Cohort Analysis
The matrix of the age-specific death rate was calculated for each 5-year period interval, beginning with 1974 to 1978, and 5-year age interval, beginning with age 20 to 24. The matrix of the age-specific incidence rates was calculated for each 3-year period interval, beginning with 1979 to 1981, and 3-year age interval, beginning with age 25 to 27. The effects of age, period, and birth cohort were examined using a log-linear Poisson regression model, modified from Os-mond and Gardner’s method [7]. The statistical model used in these analyses was
log(Rijk) ÅK/Ai/Pj/Ck/Eijk,
where Rijk represents the observed mortality/incidence rate
in a particular age – period – cohort category; K is a constant;
Ai, Pj, and Ckrepresent the age, period, and cohort effects,
respectively; and Eijkrepresents random error. The mortality/
incidence from cervical cancer is assumed to follow a Pois-son distribution.
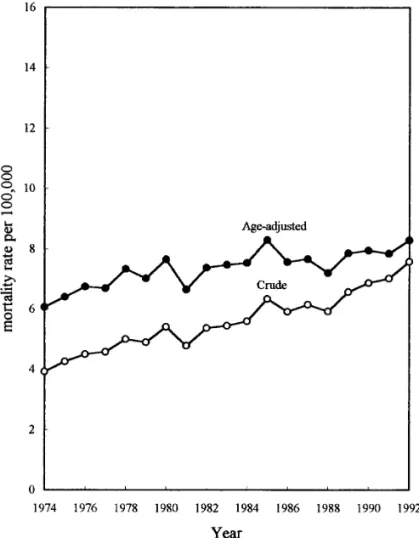
FIG. 1. Trends in crude and age-adjusted mortality rates of cervical cancer in Taiwan from 1974 to 1992.
try [2]. Each cervical cancer case was characterized by de-tailed demographic data including age at diagnosis, period at diagnosis, and birth date. Cervical cancers reported to Taiwan Cancer Registry were classified into three histologic types according to the International Classification of Disease for Oncology 0) [5]: squamous cell carcinoma (ICD-0 codes 8(ICD-0(ICD-0(ICD-0, 8(ICD-01(ICD-0, 8(ICD-07(ICD-0 – 8(ICD-072, and 8(ICD-076), adenocarcinoma (ICD-0 codes 8140, 8260, 8430, 8441, 8480, 8481, and 8560), and adenosquamous cell carcinoma (ICD-0 codes 8560 and 8570). Cases for which the cervix histologic type could not be determined (ICD-0 code 9990) were also tabu-lated (cervix, not otherwise specified). A total of 21,726 women with cervical cancer was collected for the analyses during the period 1979 – 1990. Incidence rates were stratified by 3-year age groups.
Descriptive Analysis
To adjust for the effect of difference in age composition for different periods, the total and age-specific rates of cervi-cal cancer mortality from 1974 to 1992 and incidence from
1979 to 1990 in Taiwan were age-adjusted to the 1976 world FIG. 2. Trends in age-specific mortality rates of cervical cancer in Taiwan, 1974 – 1992.
FIG. 3. Age-specific mortality rates of cervical cancer in Taiwan from 1974 to 1992.
The estimates derived from the model, including the three time factors, that minimized the weighted sum of
the Euclidean distances from the three possible two-factor FIG. 5. Period effects on cervical cancer mortality in Taiwan from models (age/period, age/cohort, and period/cohort) were 1974 to 1992.
based on the goodness-of-fit of each one. In the study,
these measures were taken as the inverse of the deviance statistics. The sum of each of the three effects was con-strained to be zero. These effects can be interpreted as logarithms of relative risks. The computer program SAS/ IML was used for the computation [8].
RESULTS
Cervical Cancer Mortality
Figure 1 shows the trends of crude, age-adjusted, and cumulative mortality rates of cervical cancer in Taiwan be-tween 1974 and 1992. The crude mortality rate was 3.93 per 100,000 in 1974 and 7.58 in 1992. The age-adjusted mortal-ity rate was 6.06 per 100,000 in 1974 and 8.28 in 1992. The average annual increase of cervical cancer mortality rate was 0.09% during this study period.
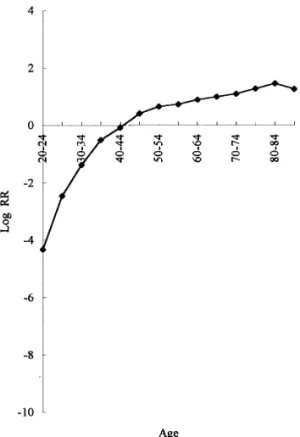
Trends in the age-specific mortality rates for each 10-year age group are plotted in Fig. 2. The upward trend in mortality was evident primarily at the age groups of 20 – 29 and 65 years and older. This observation can be also noted in Fig. 3, which represents the age-specific death rates plotted against age. Within the three time periods, the age-specific mortality sharply increased until the age group of 50 – 54 FIG. 4. Age effects on cervical cancer mortality in Taiwan from 1974
FIG. 7. Trends in crude and age-adjusted incidence rates of cervical cancer in Taiwan from 1979 through 1990.
FIG. 6. Cohort effects on cervical cancer mortality in Taiwan from 1974 to 1992.
range of 35 – 54 years. Figure 9 plots age-specific incidence However, this analysis of age-specific death rates did not against age. In each time period, that is, in 1979 – 1981, consider the period and cohort effect upon which the secular 1982 – 1984, 1985 – 1987, and 1988 – 1990, the rate rose ex-trend depended.
Figure 4 shows the logarithm of relative risks of cervical cancer mortality in different age groups (i.e., the age effects) as derived from the age – period – cohort (APC) model. The age effects increased with age even after menopausal age, although the slope became much more moderate, corre-sponding to menopausal age. The older the age, the greater the risk. The older age group of 50 – 54 years has 89.3 times the risk of the younger age group of 30 – 34 years.
Figure 5 shows the period effects. The period effect in-creased from 1974 – 1977 to 1973 – 1987 and then declined slightly. The period effect was less striking than the age effect.
The cohort effect is depicted in Fig. 6. A steady decrease in the cohort effect was observed among women born after 1938, except for an increase in the birth cohort of 1968.
Cervical Cancer Incidence
Crude, age-adjusted, and cumulative incidence rates of cervical cancer in Taiwan between 1979 and 1990 are shown in Fig. 7. It can be seen that the crude incidence rate has decreased from 20.81 per 100,000 in 1979 to 17.35 in 1990 and the age-adjusted incidence rate from 28.43 per 100,000 to 19.45 in 1990. The average annual decrease of incidence rate was 0.88% during this study period.
Trends in the age-specific incidence rate are shown in Fig. FIG. 8. Trend in age-specific incidence rates of cervical cancer in Taiwan, 1979 – 1990.
ponentially up to the age group of 52 – 54 years and then declined with advancing age.
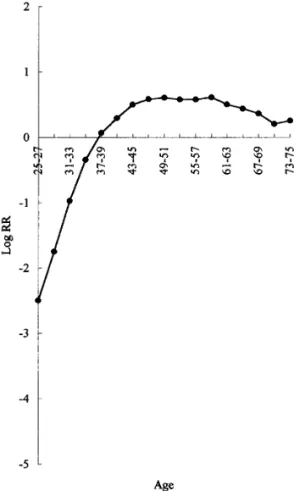
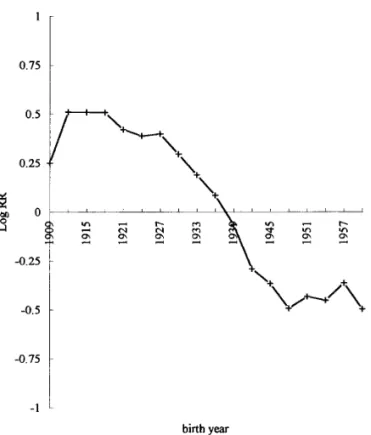
Figure 10 shows the age effects on incidence rates of cervical cancer. Prior to the age group of 49 – 51 years, there is a near linear trend in the effect of age in the form of the logarithm of relative risks for cervical cancer, after which it decreases with age. Figure 11 shows the period effect, also presented in the form of the logarithm of relative risks. A slight increase was evident from 1979 – 1981 to 1982 – 1984 and then declined consistently. Figure 12 shows the cohort effect from 1909 to 1960. For the earlier birth cohorts, the cohort effect fluctuates and remains above the average, while the cohort effect has dramatically decreased after the birth cohort of 1936, with the exception of a slight increase in the birth cohort of 1951 and 1957. The decrease was such that the 1936 cohort had a risk of cervical cancer 3.8 times larger than the 1960 cohort.
Cervical Cancer Incidence by Histologic Type
Table 1 shows the rates of cervical cancer by age, time period, and histologic type. While the data show that the incidence rates of squamous cell carcinoma decreased in all age groups, adenocarcinoma, however, increased from 1.19
FIG. 10. Age effects on the incidence of cervical cancer in Taiwan between 1979 and 1990.
to 1.41 per 100,000 between 1979 and 1990, with the in-crease being more pronounced within the age group of 25 – 34 years. Adenosquamous carcinomas are even less com-mon, and rates change little after increasing during the period of 1979 – 1982 to 1983 – 1986. The rates of invasive carci-noma that were not further specified by histologic type de-creased from 1979 – 1982 to 1983 – 1986 and then plateaued.
DISCUSSION
In the present study, we have summarized the trends in cervical cancer mortality and incidence rates in Taiwan. Most notable among these trends, the age-adjusted incidence rate decreased by 31.6% between 1979 and 1990, while the age-adjusted mortality rate increased by 15.2%. This disparity reflects a poor survival rate of cervical cancer in Taiwan. However, in recent years, the cervical cancer inci-dence rates have been clearly declining and may reflect in part the increasing use of the Pap smear [9]. This trend may ultimately lead to a decline in cervical cancer mortality, although mortality trends can be expected to lag behind inci-dence variations in view of the fact that the median survival time for women diagnosed with cervical cancer is about 6 years in Taiwan [9]. From the data presented in Table 1 the FIG. 9. Age-specific incidence rates of cervical cancer in Taiwan from
decreasing trends in mortality and incidence began and (2) to quantify the separate effects of the age, period, and cohort variables on the mortality and incidence rates, adjusting for the temporal effects. The model adequately addresses these purposes, because it derives the separate effects of age, pe-riod, and cohort on mortality and incidence rates adjusted for one another. Although the limitation of this technique was subsequently noted by Holford, and a more objective method among the APC models proposed [13], the analyses described the present data very well and successfully attained the aims mentioned above.
Most epidemiologic studies have incriminated various risk factors for cervical cancer. Major risk factors for cervical cancer include multiple sex partners and early age at first intercourse [18, 19]. However, the sexual behavior of Tai-wanese men and women differs from contemporary Western practices. There is a conventional double standard for sexual behavior in Taiwan’s population. While female virginity prior to marriage and fidelity subsequent to marriage are highly valued, many husbands frequently visit prostitutes — a practice which is tolerated within society. Given this pat-tern of sexual behavior, prostitutes may act as an infectious reservoir, and the husband’s sexual behavior may be a major determinant in the risk factors for cervical cancer in wives, particularly among those not using condoms. This idea was supported by Slattery et al., who postulated that the regular FIG. 11. Period effects on the incidence of cervical cancer in Taiwan
use of condoms may protect the cervix from opportunistic between 1979 and 1990.
transmission by infectious agents [20]. Our previous case-control study [21] conducted in Taiwan during the period 1991 – 1994 revealed that the mean lifetime number of sex 100,000 between 1979 and 1990, compared with a significant
decrease in the squamous cell carcinoma, the increase being partners slightly increased from an average of 1.1 among women age 50 and older to 1.5 among those under age 40. more pronounced among the age group of 25 – 34 years.
This pattern is consistent with several studies from different Furthermore, the average age at first intercourse declined from 23.7 to 20.4, and the percentage of a husband’s ever geographical areas, including the U.S.A. [10], UK [11], and
Norway [12]. visiting prostitutes increased from 28.6 to 40.4%. Moreover,
the prevalence of condom use has been less than 18% of all Time trend of mortality and incidence rates for a particular
disease can provide an epidemiologist with valuable clues or women. However, the protective role played by condoms has probably been minor due to the low prevalence of use hypotheses for disease etiology [13]. Three temporal factors
which are often considered in such an investigation are age, in Taiwan, although usage is now increasing in response to the AIDS epidemic. These differences partly reflect the time period, and birth cohort. In 1939, Frost first employed
these three factors on mortality rates from tuberculosis in increasing sexual freedom arising within the past several decades, and it is supported by the parallel trend rates of Massachusetts [14]. This technique was adopted further by
Case to establish the value of cohort analysis [15], but the sexually transmitted diseases [22]. Yet changes in sexual activity are not reflected in the trends for cervical cancer. technique remained a graphical one and the contributions of
various time factors were determined visually to examine Recent studies among Hispanic women in the U.S.A. and in Latin America [23, 24], in which multiple births are more patterns in disease rates over time [16]. In contrast, statistical
APC analysis has been developed in an attempt to overcome common, indicate that the number of births has an indepen-dent and relevant role in cervical cancer. In Taiwan, the total these drawbacks and to quantify the separate effects of the
age, period, and cohort variables, provided suitable con- fertility rate fell rapidly from 1960 to 1980: 5.78 in 1960 and 2.50 in 1980 [3]. The rate was almost fixed at 2.50 in straints are imposed [17]. The constraints proposed by
Os-mond and Gardner were determined solely within the data the early 1980s and then showed a gradually declining trend, and in 1992 it was 1.80. The fact that these findings reflect and yielded an objective indication of the statistical
signifi-cance of a particular pattern [7]. We used the APC model a rapid decrease in the cohort effect on incidence after the 1936 birth cohort (Fig. 12) might be partly explained by the for two goals: (1) to determine in which generations the
TABLE 1 Incidencea
of Cervical Cancer by Histologic Type, Age, and Time Period, Taiwan Areas, 1979 – 1990
Incidence (no. of cases)
Time period and histologic type 25 – 34 35 – 49 50 – 64 65/ All ages
Squamous cell carcinoma
1979 – 1982 1.23 (301) 42.61 (2134) 83.86 (2628) 56.76 (869) 17.41 (5932) 1983 – 1986 1.56 (399) 42.57 (2347) 90.73 (3283) 70.52 (1269) 20.03 (7298) 1987 – 1990 1.36 (346) 25.01 (1600) 61.63 (2531) 51.95 (1121) 14.74 (5658) 5.7b (0.02*) 87.80 (0.00*) 98.70 (0.00*) 4.60 (0.03*) 39.50 (0.00*) Adenocarcinoma 1979 – 1982 0.14 (34) 3.23 (162) 4.98 (156) 3.40 (52) 1.19 (404) 1983 – 1986 0.22 (56) 3.45 (190) 5.97 (216) 5.22 (94) 1.53 (556) 1987 – 1990 0.23 (57) 2.79 (185) 5.65 (232) 3.06 (66) 1.41 (540) 4.76 (0.05*) 2.20 (0.14) 1.20 (0.28) 0.7 (0.40) 5.4 (0.02*) Adenosquamous carcinoma 1979 – 1982 0.01 (2) 0.38 (19) 0.51 (16) 0.26 (4) 0.12 (41) 1983 – 1986 0.04 (9) 0.76 (42) 1.22 (44) 0.56 (10) 0.29 (105) 1987 – 1990 0.05 (12) 0.66 (44) 1.07 (44) 0.70 (15) 0.30 (115) 6.1 (0.02*) 3.2 (0.08) 5.1 (0.02*) 3.1 (0.08) 23.4 (0.00*)
Other and unspecified epithelial cancer
1979 – 1982 0.14 (33) 3.53 (177) 7.37 (231) 8.23 (126) 1.66 (567)
1983 – 1986 0.13 (34) 2.21 (122) 5.47 (198) 6.72 (121) 1.30 (457)
1987 – 1990 0.17 (43) 2.09 (139) 5.14 (211) 7.74 (167) 1.46 (560)
1.0 (0.32) 21.6 (0.00*) 14.2 (0.00*) 0.14 (0.71) 4.7 (0.03*)
aRate per 100,000 women per year. bx2value for trend test (P value).
* Significant at aÅ0.05 level.
decrease in parity, since the 1936 – 1950 birth cohort, in our In the age – mortality curve in Taiwan, 1974 – 1992, the rates increased with age even after so-called age at meno-analysis, came into child-bearing age in the midst of 1960s –
1980s, which was a period of family planning and a marked pause (Fig. 3); however, in the age – incidence curve in Tai-wan, 1979 – 1990, a small decline with age was noted after birth control campaign in Taiwan. This coincidence in time
may imply that reproductive factors are one of the most menopause (Fig. 9). Our analysis using the APC mode pro-vides clue to rule out this fall in cross-sectional rates after possible sources of the cohort effect.
It has been suggested that the increased use of OCs may menopause to a cohort effect, because the age effect on incidence, which is adjusted for the cohort and period effect, be linked to the increase in cervical cancer incidence [28],
while Winkelstein found in 15 of 18 studies carried out since also decreases after the age at menopause. Thus it is reason-able to suggest that occurrence of cervical cancer may be 1966 an association of smoking with the increased risk of
cervical cancer [27]. Yet the prevalence of Taiwanese influenced by female sex hormones such that incidence stops linear increase after the menopause. This explanation is con-women who ever smoked cigarettes is as low as 3.2%, and
the prevalence of those who ever used oral contraceptives sistent with the patterns observed elsewhere, including the UK, Finland, and Norway [30].
is 8.7%. Thus oral contraceptives and smoking explain little
of the time trends in cervical cancer among this population. In applying to APC analyses to mortality and incidence trends in the present study, there was a substantially decreas-An important factor influencing cervical cancer trends is
the increased use of screening practices to detect precursor ing risk of cervical cancer incidence during the period from 1979 – 1981 to 1988 – 1990, while the period effect on mor-lesions while reducing the incidence of invasive cervical
cancer [25, 26]. Our previous study showed that the per- tality was moderating during the period from 1974 – 1977 to 1988 – 1992. Interpretation of these findings is complicated centage of women older than 30 who reported ever having
had a Pap smear increased from 23.5% in 1970s to 63.9% by the fact that the period effects could be due to factors such as changes over time in medical care, screening practices, in 1990s [9]. These patterns are consistent with the
ob-served trends in cervical cancer incidence rates (Fig. 7). prevalence of hysterectomy, and registration practices. Thus, it is possible that period effects do not reflect etiologic dis-However, Taiwan data contrast with those of the UK,
where an increase in cervical cancer incidence has been tinctions, but more trivial period factors.
As regards cohort effects, for the earlier birth cohorts, the reported at young ages [29].
1984 appeared to be moderating during 1988 – 1990, contin-ued surveillance is warranted.
ACKNOWLEDGMENTS
We thank Dr. J. M. Weaver for many valuable comments and Mr. W. T. Ho for technical assistance.
REFERENCES
1. Ponten, J., Adami, H. O., Bergstrom, R., Dillner, J., Friberg, L. G., Gustafsson, L., Miller, A. B., Parkin, D. M., and Trichopoulos, D. Strategies for global control of cervical cancer, Int. J. Cancer 60, 1 – 26 (1995).
2. Department of Health, the Executive Yuan. Cancer registry annual report in Taiwan area 1979 – 1990, Department of Health, Executive Yuan, Taipei (1980 – 1991).
3. Taiwan Provincial Department of Health. Vital statistics, 1960 – 1993. Taiwan Provincial Department of Health, Chung-Hsing Village (1961 – 1994).
4. Ministry of the Interior, R.O.C. Demographic Facts 1974-1992, Minis-try of Interior, R.O.C., Taipei (1975 – 1993).
5. World Health Organization, ICD-O. International classification of dis-eases for oncology, WHO, Geneva (1976).
FIG. 12. Cohort effects on the incidence of cervical cancer in Taiwan 6. Smith, P. G. Comparison between registries: Age-standardized rates, between 1979 and 1990. in (D. M. Parkin, C. S. Muir, S. L. Whelan, Y. T. Gao, J. Ferlay, and J. Powell, Eds.), International Agency for Research on Cancer, Lyon, pp. 865 – 870 (1992).
cohort effect fluctuates and remains above the average, while 7. Osmond, C., and Gardner, M. J. Age, period and cohort models applied to cancer mortality rate, Stat. Med. 1, 245 – 259 (1982).
the relative risks decrease sharply after the 1938 birth cohort
for mortality and the 1936 birth cohort for incidence of 8. SAS Institute Inc. SAS/IML: User’s guide, release 6.04 ed., SAS Insti-tute, Inc. Cary, NC (1988).
cervical cancer. However, the risk increased on mortality in
9. Wang, P. D., and Lin, R. S. Cervical cancer screening in Taiwan: Five-the 1968 cohort and remained at a plateau on incidence
year results, Chin. Med. J. 109(4), 286 – 290. in the 1951 – 1957 cohort. This phenomenon suggests that
10. Devesa, S. S., Young, J. L., Brinton, L. A., and Fraumeni, J. F. Recent generations of women born in 1951 – 1957 and 1968 have
trends in cervix uteri cancer, Cancer 64, 2184 – 2190 (1989). been increasingly exposed to a cause of cervical cancer. It
11. Chilvers, C., Mant, D., and Pike, M. C. Cervical adenocarcinoma and may reflect in our analysis that in the most recent time pe- oral contraceptives, Br. Med. J. 295, 1446 – 1447 (1987).
riod, there has been an upward trend in mortality in these 12. Eide, J. Cancer of uterine cervix in Norway by histologic type, 1970 – young women (Fig. 2). These age-related variations high- 84, J. Natl. Cancer Inst. 79, 199 – 203 (1987).
light the urgent need for improvements in screening strate- 13. Holford, T. R. The estimation of age, period and cohort effects for vital rates, Biometrices 39, 311 – 324 (1983).
gies among this age group in Taiwan.
Some perspectives on the trend in cervical cancer inci- 14. Frost, W. H. The age selection of mortality from tuberculosis in succes-sive decade, Am. J. Hyg. 30, 91 – 96 (1939).
dence were noted in Fig. 8. The incidence rates in those
15. Case, R. A. M. Cohort analysis of mortality rates as a historical or age §55 years have not notably decreased. However, the
narrative technique, Br. J. Prev. Soc. Med. 10, 159 – 171 (1956). incidence in this age group will be expected to decrease
16. MacMahon, B., and Terry, W. B. Application of cohort analysis to the substantially when the 1936 – 1950 birth cohort (the
inci-study of time trends in neoplastic disease, J. Chronic Dis. 7, 24 – 35 dence has decreased rapidly during this cohort) reaches the (1958).
age of 55 years in the 2000s. 17. Kupper, L. L., Janis, J. M., Darmous, A., and Greenberg, B. G. Statisti-In summary, it appears that the decline in cervical cancer cal age – period – cohort analysis: A review and critique, J. Chronic Dis.
38, 811 – 830 (1985). incidence rates, in spite of the increasing prevalence of some
risk factors, might reflect increases in the level of screening 18. Brisson, J., Morin, C., Fortier, M., Roy, M., Bouchard, C., Leclerc, J., Christen, A., Guimont, C., Penault, F., and Meisels, A. Risk factors activities in Taiwan. However, the mortality rates did not
for cervical intraepithelial neoplasia: Differences between low- and decrease, partly due to the poor survival rate. In the future,
high-grade lesions, Am. J. Epidemiol. 140, 700 – 710 (1994). further incidence declines may be possible with the 1936 –
19. Armstrong, B., Munoz, N., and Bosch, F. X. Epidemiology of cancer 1950 cohort reaching the age 55 years and older in the 2000s of the cervix, in Gynecologic Oncology, 2nd ed. (M. Coppleson, M. J. and with the usage of screening gradually increasing with Monaghan, C. P. Morrow, and M. I. N. Tattershall, Eds.), Churchill
Livingstone, Edinburgh, pp. 11 – 29 (1992). time. Although increases in adenocarcinoma during 1982 –
20. Slattery, M. L., Overall, J. C., Abbott, T. M., French, T. K., Robinson, 25. Brinton, L. A., and Fraumeni, J. F. Epidemiology of uterine cervical cancer, J. Chronic Dis. 39, 1051 – 1065 (1986).
L. M., and Gardner, J. Sexual activity, contraception, genital infections,
and cervical cancer: Support for a sexually transmitted disease hypothe- 26. Brinton, L. A., Tashima, K. T., Lehman, H. F., Levine, R. S., Mallin, sis, Am. J. Epidemiol. 130, 248 – 257 (1989). K., Savitz, D. A., Stolley, P. D., and Fraumeni, J. F. Epidemiology of
cervical cancer by cell type, Cancer Res. 47, 1706 – 1711 (1987). 21. Wang, P. D., and Lin, R. S. Risk factors for cervical intraepithelial
neoplasia in Taiwan, Gynecol. Oncol. 62, 10 – 18 (1996). 27. Winkelstein, W. Cigarette smoking and cancer of the uterine cervix, Banbury Rep. 23, 329 – 341 (1986).
22. Venereal Disease Center, Health Department of Taipei City
Govern-ment. Sexually transmitted disease annual report, 1993. Venereal Dis- 28. Brand, E., Berek, J. S., and Hacker, N. F. Controversies in the manage-ease Center, Health Department of Taipei City Government, Taipei ment of cervical adenocarcinoma, Obstet. Gynecol. 71, 261 – 269
(1994). (1988).
23. Brinton, L. A., Reeves, W. C., Brenes, M. M., et al. Parity as a risk 29. Cook, G. A., and Draper, G. J. Trends in cervical cancer and carcinoma factor for cervical cancer, Am. J. Epidemiol. 130, 486 – 496 (1989). in situ in Great Britain. Br. J. Cancer 50, 367 – 371 (1984).
30. Muir, C., Waterhouse, J., Mack, T., Powell, J., Whelan, S. (Eds.). 24. Herrero, R., Brinton, L. A., Reeves, W. C., Brenes, M. M., De Brinton,
R. C., Gaitan, E., and Tenorio, F., Screening for cervical cancer in Cancer incidence in five continents, Vol. V, IARC Scientific Publica-tions, No. 88. International Agency for Research on Cancer, Lyon Latin America: A case-control study. Int. J. Epidemiol. 21, 1150 – 1156