TH P-( 5)-I 6
Probability Density of Signal with Nonlinear Phase Noise
Jen-An Huang and Keang-Po Ho
Graduate Institute of Communication Engineering,
National Taiwan University, Taipei
106,
Taiwan
Tel:
+886-2-2363-525 1,
Fax:
+886-2-2368-3824
E-mail: koho@cc.ee.ntu.edu.tw
Nonlinear phase noise, often called the Gordon-Mollenauer effect [I], is the major degradation for phase-modulated signals [l-81. Non-Gaussian distributed [2-51, the nonlinear phase noise can be characterized by neither variance nor Q-factor [MI. The probability density function (p.d.f.) is necessary to better understand the noise properties and evaluate the system performance.
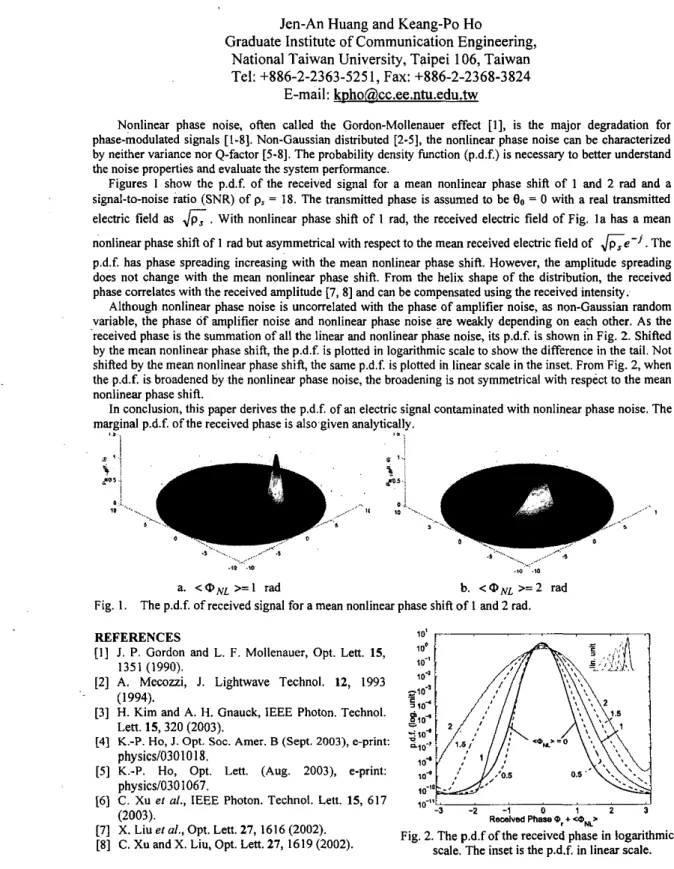
Figures 1 show the p.d.f. of the received signal for a mean nonlinear phase shift of 1 and 2 rad and a signal-to-noise ratio (SNR) of p. = 18. The transmitted phase is assumed to be Bo = 0 with a real transmitted electric field as
& ,
With nonlinear phase shift of 1 rad, the received electric field of Fig. l a has a mean nonlinear phase shift of 1 rad but asymmetrical with respect to the mean received electric field of &e-'. The p.d.f. has phase spreading increasing with the mean nonlinear phase shift. However, the amplitude spreading does not change with the mean nonlinear phase shift. From the helix shape of the distribution, the received phase correlates with the received amplitude [7,8] and can be compensated using the received intensity.Although nonlinear phase noise is uncorrelated with the phase of amplifier noise, as non-Gaussian random variable, the phase of amplifier noise and nonlinear phase noise F e weakly depending on each other. As the received phase is the summation of all the linear and nonlinear phase noise, its p.d.f. is shown in Fig. 2. Shifted by the mean nonlinear phase shift, the p.d.f. is plotted in logarithmic scale to show the difference in the tail. Not shifted by the mean nonlinear phase shift, the same p.d.f. is plotted in linear scale in the inset. From Fig. 2, when the p.d.f. is broadened 6y the nonlinear phase noise, the broadening is not symmetrical with respect to the mean nonlinear phase shift.
In conclusion, this paper derives the p.d.f. of an electric signal contaminated with nonlinear phase noise. The marginal p.d.f. of the received phase is also-given analytically.
I Q :
a. < Q N L >= 1 rad b. < Q N L >= 2 rad Fig. 1. The p.d.f. of received signal for a mean nonlinear phase shift of 1 and 2 rad.
REF
E
RE
N
C E S[I] I. P. Gordon and L. F. Mollenauer, Opt. Lett. 15, 1351 (1990).
[2] A. Mecozzi, J. Lightwave Technol. 12, 1993 [3] H. Kim and A. H. Gnauck, IEEE Photon. Technol.
Lett. 15,320 (2003).
[4] K.-P. Ho, 1. Opt. Soc. Amer. B (Sept. 2003), e-print: physics/O301018.
[5] K.-P. Ho, Opt. Lett. (Aug. 2003), e-print: physics/030 1067.
[6] C. Xu et al., IEEE Photon. Technol. Len. 15, 617
(2003).
[7] X. Liu et al., Opt. Lett. 27, 1616 (2002).
[8] C. Xu and X. Liu, Opt. Lett. 27, 1619 (2002). (1 994).
J
- 2 - 1 a 1 2 3
R e d v s d Phare 0, +
Fig. 2. The p.d.f of the received phase in logarithmic scale. The inset is the p.d.f. in linear scale.
0-7803-7766-4/03/$17.00 02003 IEEE