Political connections, corporate governance and preferential
bank loans
Yin-Hua Yeh
a,⁎
, Pei-Gi Shu
b, Shean-Bii Chiu
c aGraduate Institute of Finance, National Chiao Tung University, 1001 Ta Hsueh Road, Hsinchu 300, Taiwan
b
Department of Business Administration, Fu Jen Catholic University, Taiwan
c
Department of Finance, National Taiwan University, Taiwan
a r t i c l e i n f o
a b s t r a c t
Article history:
Received 9 November 2011 Accepted 2 August 2012 Available online 17 August 2012
The presidential election in Taiwan during 2000 resulted in thefirst political changeover in more thanfifty years from the ruling party, the Kuomintang (KMT), to the Democratic Progressive Party (DPP). In 2004, the KMT was expected to win, but eventually lost to the DPP. We use these two exogenous events to investigate three issues: how political connections are related to preferential bank loans, how the entrenched position of the ruling party affects the types of preferential bank loans and how corporate governance is related to preferential bank loans. Wefind that KMT-connected (DPP-connected)firms were associated with higher (lower) abnormal returns before the 2004 election. This pattern of returns was reversed after the unexpected result. Moreover, wefind that political connections were positively correlated with preferential bank loans. However, the types of preferential bank loans differed between KMT-connected and DPP-KMT-connectedfirms due to differences in the entrenched power of the ruling party. Finally, wefind that corporate governance is negatively correlated with preferential bank loans, probably becausefirms with good corporate governance have more alternativefinancial sources. © 2012 Elsevier B.V. All rights reserved.
JEL classification: G34 G32 Keywords: Political connection Corporate governance Preferential bank loan
1. Introduction
Political connections, which are prevalent around the world, allow politically connected firms to benefit from various governmental interventions.1Preferential bank loans are characterized by lower
⁎ Corresponding author. Tel.: +886 3 572 6514; fax: +886 3 573 3260. E-mail address:yinhua.yeh@gmail.com(Y.-H. Yeh).
1
Such interventions take various forms, including favorable regulatory conditions (Agrawal and Knoeber, 2001), cut-rate credit and import licenses (Mobarak and Purbasari, 2006), capital controls (Johnson and Mitton, 2003), retardingfinancial development (Rajan and Zingales, 2003),financial bailout (Faccio et al., 2006) and preferential access to debtfinancing (Khwaja and Mian, 2005; Gomez and Jomo, 1997; Claessens et al., 2008).
0927-538X/$– see front matter © 2012 Elsevier B.V. All rights reserved.
http://dx.doi.org/10.1016/j.pacfin.2012.08.003
Contents lists available atSciVerse ScienceDirect
Paci
fic-Basin Finance Journal
interest rates (Sapienza, 2004; Khwaja and Mian, 2005) and higher leverage ratios (Faccio, 2006; Johnson and Mitton, 2003; Khwaja and Mian, 2005). However, political connections are also associated with costs. For example, political intervention might weaken managerial practices and harm afirm's performance (Fan et al., 2007).2Previous studies covering cross-country comparisons indicate that political connections
could be a substitute for ineffective external governance.3
Nevertheless, the issue of endogeneity might arise when relating political connections to policy outcomes.4We use the 2000 and 2004 presidential elections in Taiwan as external shocks to investigate
how political connections and corporate governance are related to preferential bank loans. The reason for considering these two presidential elections as external shocks is that the Kuomintang (KMT) had been expected to win, but ultimately lost to the Democratic Progressive Party (DPP).5
First, we use the event study to investigate the market response to the 2004 presidential election.6The
results indicate that KMT-connected (DPP-connected) firms were associated with higher (lower) abnormal returns before the election because the market had anticipated that the KMT would win the election. However, the result of the election surprised the market and led to a reversal in returns, such that the KMT-connected (DPP-connected)firms became associated with higher (lower) abnormal returns after the election. This result is parallel to thefinding ofGoldman et al. (2009), who note thatfirms connected to the Republican Party increased in value andfirms connected to the Democratic Party decreased in value when a Republican won the 2000 presidential election. Moreover, wefind that good-governance firms enjoyed higher abnormal returns after the 2000 and 2004 presidential election, which implies that such firms are able to reduce the negative impact associated with a surprising presidential election result.
We further focus on the relation between political connections and preferential bank loans from government-controlled banks. Referring toDegryse and Cayseele (2000), we use duration and collateral requirement to gauge the extent of preferential treatment. Long-term, non-collateral loans from government-controlled banks are deemed the most preferential treatment resulting from afirm's political connections. Until 2000, the KMT had politically controlled the island for more thanfifty years and KMT-connectedfirms enjoyed the most preferential bank loans due to the KMT's entrenched control during this period. In contrast, DPP-connected firms from 2001 to 2006 are characterized as short and shallow, partially because the DPP was still in its infancy of gaining the ruling legitimacy and partially because its power in congress was evenly shared with the KMT during this period.7 The difference in power entrenchment implies that KMT-connectedfirms received significantly more preferential treatment when
2
The costs of politicians' intervention in business activities are more severe when institutional constraints are weak (Shleifer and Vishny, 1994; Hellman et al., 2003) or legal protections against expropriation by politicians are ineffective (Acemoglu et al., 2005). The net effect of political connections onfirm value remains a puzzling issue. For example,Bunkanwanicha and Wiwattanakantang (2009)consider the relationship positive whileBertrand et al. (2007)consider it negative.
3
For example,Boubakri et al. (2008)indicate that political connections seem to be more prevalent in countries with lower judicial independence.Hu and Leung (2008)find that political executives can serve as disciplinary or monitoring mechanisms for corporate control and the legal protection of investors in political economies that lack external markets.Leuz and Oberholzer-Gee (2006)
argue that political connections and globalfinancing are substitutes.
4For example, previous studies indicate that it is difficult to disentangle policy outcomes that are the result of politicians'
ideologies (e.g.Chappell, 1982) or that are affected by politicians' attempts to forge cozy alliances with political contributors (e.g.
Stratmann, 1995; Kroszner and Stratmann, 1998).
5
The 2000 presidential election was a head-to-head competition among Chen, Lien and Soong, with several of the option polls one month before the election failing to indicate a promising winner. For example, an opinion poll conducted by the United Daily News in March 5, 2000 showed that 27% of the voters surveyed favored Lien, 22% favored Chen and 24% favored Soong. In contrast, another opinion poll conducted by the TVBS Poll Center on the same day indicated that 25% of the voters preferred Lien, 26% favored Chen and 26% favored Soong. These opinion polls suggested a strict tie among the three candidates. The 2004 election represents a competition between Chen and the reunion of Lien and Soong. The TVBS Poll Center revealed the results of an opinion poll conducted on January 5, 2004 that indicated that 48% of voters preferred Lien and 37% favored Chen. On the same day, another opinion poll conducted by Eracom Survey indicated that 39% of the voters preferred Lien and 29% favored Chen.
6The 2000 presidential election in Taiwan is subject to the concern of insufficient data because there were only 9 DPP-connected
firms before the election.
7During the DPP ruling period, the KMT obtained 30.22%, 35.11% and 71.68% of congress membership in the 2001, 2004 and 2007
elections, respectively. The corresponding percentages for the DPP were 38.67%, 39.56% and 23.89%, respectively. Moreover, the KMT, the PFP and the New Party formed the Pan-Blue coalition, which represented the majority membership in the congress. The membership of this coalition was 51.11%, 50.67% and 77.88% in the 2001, 2004 and 2007 elections, respectively. These numbers would be even higher after including the non-party coalition, which typically cooperated with the Pan-Blue coalition during the sampling period.
the KMT was in power than DPP-connectedfirms did when the DPP was in power. Our empirical results support this postulation, which indicates that KMT-connected firms were associated with a higher proportion of 3-year or beyond, non-collateral bank loans from government-controlled banks than their non-connected peers from 1998 to 2000. In contrast, DPP-connected firms received preferential bank loans in the form of short-term, non-collateral loans rather than long-term, non-collateral loans.
We also explore the ways in which corporate governance is related to preferential bank loans. We argue that corporate governance weakens this relation, such thatfirms with good governance structures become associated with a lower level of preferential bank loans. This inference is summarized as follows. First, if governance quality dictates afirm's performance and market competitiveness (e.g.Gompers et al., 2003; Klapper and Love, 2004), good-governancefirms should have more financial sources than poor-governancefirms, through lower cost of equity (e.g.Chen et al., 2009) or lower cost of debt (e.g.Klock et al., 2005; Ashbaugh-Skaife et al., 2006; Chava et al., 2009). Therefore, preferential bank loans are less attractive to good-governancefirms than they are to poor-governance firms. Second, political connections are not obtained without cost. The marginal cost of political connection, through political intervention (e.g.Fan et al., 2007) or political donation (e.g.Claessens et al., 2008) is expected to be higher for good-governancefirms than for poor-governance firms. The two, when bundled, predict that the quality of corporate governance is negatively correlated with preferential bank loans. Our empirical results support this prediction that good-governancefirms are associated with a lower level of preferential bank loans. The results are sustainable for both periods when different parties were in power. This finding is consistent withLeuz and Oberholzer-Gee (2006), whofind that domestic opportunities that stem from political connections significantly reduce the net benefits of foreign securities for some firms.
The parallel work of Goldman et al. (2009) shows a positive abnormal stock return following the announcement of the nomination of a politically connected individual to the board. Moreover, firms connected to the Republican Party increased in value while those connected to the Democratic Party decreased in value in response to the Republican win of the 2000 presidential election. The 2004 presidential election case yields a similar pattern, with KMT-connected (DPP-connected)firms being associated with a higher (lower) abnormal return before the election. The pattern of returns was reversed after the DPP won that presidential election. Moreover, the identification of a positive relation between political connections and preferential bank loans is similar in spirit to the positive relation between political connections and government procurement contracts (Goldman et al., 2011), in addition to being close to the positive relation between politically-contributing Brazilianfirms and bank financing (Claessens et al., 2008) and the increase in lending displayed by government-owned banks in election years over private banks (Dinc, 2005).
This paper makes a number of contributions. First, we use the exogenous shock of the 2004 presidential election in Taiwan to investigate how the value of politically connectedfirms is affected by such an unexpected change in the political landscape. Second, we identify a positive relation between political connections and preferential bank loans. More importantly, we determine that the types of preferential bank loans differed for KMT-connected and DPP-connected firms in response to their differences in political power entrenchment. The ramifications of preferential bank loans complement the contribution ofClaessens et al. (2008), who use campaign contribution data to gauge the extent of the political connection phenomenon. Finally, we reveal thatfirms with good governance structures are associated with a lower level of preferential bank loans. The negative relation between corporate governance and preferential bank loans was sustained by both political parties while in power. This negative relation was also sustained during changes in political connections and preferential bank loans. The remainder of this paper is structured as follows.Section 2describes the political development in Taiwan.Section 3provides the literature review and hypotheses development.Section 4describes the data and summary statistics.
Section 5provides the empirical results and robustness checks.Section 6concludes the paper. 2. Taiwan's Political Development, Financial Industry and Industrial Policies
In this section, we provide a brief overview of Taiwan's political development. Taiwan had been under the control of the Qing Dynasty since 1683 when it was ceded to Japan in 1895 following the First Sino-Japanese War. Japan returned the sovereignty to China in 1945 after its failure in World War II. At that time, China was under the administrative control of the Republic of China government and its ruling political party, the KMT. In 1949, the KMT was defeated by the Communist Party in mainland China and it
retreated to Taiwan. Since then, the KMT has been the ruling party in Taiwan for more thanfifty years. The KMT-ruling government enacted an order of martial law seeking opportunities to counterattack Communist-governed China. However, the attempt has never been realized. During the martial law period, democracy was strictly constrained, but the opposing power and a demand for true democracy have been gradually accumulating since the White Horror period, during which many innocent civilians were accused of being spies and sentenced to death.
In 1975, Chiang Ching-kuo succeeded his father, Chiang Kai-shek. Chiang Ching-kuo was characterized as significantly more tolerant of political dissent. Toward the end of his life, Chiang Ching-kuo relaxed governmental controls on the press and speech and put native Taiwanese in positions of power, including his successor, Lee Teng-hui, who furthered the course of democratic reforms. In 1991, martial law was abolished, and after six constitutional amendments, civilians were given the power to directly vote in presidential elections in 1996. Taiwan's presidency system, after several revisions, resembles the U.S. system in which presidents have supreme power. Lee Teng-hui became thefirst president directly voted into office by civilians.
In 2000, Lien Chan, a representative of the KMT, lost to Chen Shui-bian, the candidate for the DPP. This result was mainly due to James Soong's independent bid for the presidency, which split the supermajority power of the KMT. James Soong further found the People First Party (PFP) to create a political space between the DPP and the KMT. In 2004, a reunion of the KMT and the PFP was expected to counterbalance sitting president Chen's advantage. The 2004 election became a standoff between Pan-Blue and Pan-Green supporters.8Chen was re-elected by a slim margin of less than 30,000 votes that resulted in prolonging
confrontations with Pan-Blue supporters that frustrated many business professionals, who then decided to take a more neutral approach.
After eight years, during which the DPP consolidated power, the KMT regrouped in 2008 to secure both a substantial majority in parliament in the January 2008 election and a decisive victory in the March 2008 presidential election. The KMT candidate, Ma Ying-jeou, beat the DPP's candidate, Frank Hsieh, by an unexpectedly large margin. The KMT's victory implies that Taiwan's government's attitude toward China will be much more open compared to the attitude during the DPP's ruling period. This is critical to business professionals, particularly those who have profound investments in China.
During the KMT-controlled era, many listedfirms were split from government-owned enterprises. These entities were then privatized and publicly listed for trading. Given their originality and traditions, these government-sponsored firms were closely connected to the KMT and received preferential treatment, including preferential bank loans. The 2000 presidential election fundamentally undermined these relations, which provides a good forum for examining the effects of political connections on preferential bank loans.
The relation between political connections andfirms' preferential bank loans might be affected by Taiwan'sfinancial systems and industrial policies. First, we briefly review the financial systems in Taiwan. Beginning in the early 1980s, the Central Bank of Taiwan gradually freed interest rate controls, which enabled banks to compete more effectively. Given the lack of a competitive market structure, the government allowed the entry of 16 new private commercial banks between 1991 and 1995, which resulted in a decrease in the market shares of loans and assets held by state-controlled banks. However, even with the inclusion of new banks, government-controlled bank loans represent 73% of the total bank loan market and more than 50% of the total assets for the banking industry in our sampling period. Furthermore, foreign banks were allowed to set up branches in Taiwan and limits on their branch networks were gradually lifted in the mid-1980s.
However, this opening in the banking industry gradually resulted in drastic and fragmented competition among banks. To address these challenges, the Taiwan government conducted the 2002 financial reform, which successfully reduced the nonperforming loan (NPL) ratio from 7.48% in June 2002 to 3.22% in November 2004 and to 2.8% in September 2005 (Hwang and Wu, 2007). In 2004, the second stage of financial reform aimed at turning Taiwan into a regional financial center was implemented.
8The Pan-Blue coalition, whose name is derived from the KMT's party colors, mainly consists of the KMT, the PFP and the New
Party. It tends to favor a Chinese national identity over a separate Taiwanese one and prefers softer policy and greater economic linkage with China. In contrast, the Pan-Green coalition, whose name is derived from the colors of the DDP, consists of the DPP, the Taiwan Solidarity Union (TSU) and the minor Taiwan Independence Party (TAIP). It favors Taiwanese independence over Chinese reunification.
However, this second-stage reform was associated with controversies. First, the consolidation process requested by the government for cutting the number of banks by half within a given period of time overrode the market mechanism. Second, the fairness of the setup, which consisted of three state-controlled banks merged with family banks, was questioned because public benefits were transferred to the family-owned banks based on the justification that the public policies carried by the state-owned banks would be ineffectual after the wave of mergers.
A quick review of Taiwan's industry policies can be boiled down to tracing the development of its high-tech industry. In the 1960s, Taiwan's government focused on import-substituting industrialization by encouraging inward foreign direct investments and technology transfers. In thefirst part of the 1970s, this focus was diverted to export-oriented industrialization due to the introduction of the Industrial Technology Research Institute with the purpose of strengthening public infrastructure to cater to electronics industries. In the 1980s, the Hsinchu Science Based Industrialized Park was established by the National Science Council. This special economic zone, accompanied by the National Ciao-Tung University and the National Tsing Tua University, has successfully built the framework for public infrastructure. The government also provided preferential treatment, such asfinancial support from the China Development Corporation (CDC) and other similar privileges. This period of preferential treatment, which included the provision of capital, technical support, low-interest loans, tax incentives and deductions and tariff exemption for intermediate goods, prompted the implementation of many important high-techfirms, such as the United Microelectronics Corp. (UMC) and the Taiwan Semiconductor Manufacturing Company (TSMC). High-tech industries had become the focal point of Taiwan until the 2000 Internet bubble. Presently, the emphasis is on industrial upgrades in areas that could bolster national competitiveness.
To summarize, Taiwan's political development is crucially related to the development of itsfinancial industries. Politically connectedfirms have obtained preferential bank loans of different types for KMT-connected and DPP-KMT-connectedfirms. In contrast, the industry policies exhibit an insignificant difference between the KMT-ruling period and the DPP-ruling period. Therefore, the relation between political connections and preferential bank loans is less likely to be jeopardized once industrial policies have been included in the analysis.
3. Literature review and hypotheses development
In this section we develop hypotheses on the relation between political connections and preferential bank loans, how entrenchment in political powers affects preferential bank loan types and how the quality of internal corporate governance is related to preferential bank loans.
3.1. Political connections and preferential bank loans
The political-connection literature indicates thatfirms have strong incentives to forge alliances with politicians who affect the general institutional environment and its economic outcomes (e.g.Krueger, 1974; Morck et al., 2005). The channels for political influence include retarded financial development (Rajan and Zingales, 2003), cut-rate credit and import licenses (Mobarak and Purbasari, 2006), capital controls (Johnson and Mitton, 2003) andfinancial bailout (Faccio et al., 2006). Preferential bank loans are one of the most pervasive mechanisms used by politicians to demonstrate their influence and maintain their political patronage (Sapienza, 2004). A preferential bank loan is one extended by government-owned or -controlled banks that are either charged at a lower rate than that in the prevailing market, or not accepted or conducted by private banks.
The use of government controlled banks as targets for measuring preferential bank loans is based on the following rationales. First, prior studies from Thailand (Charumilind et al., 2006), India (Cole, 2004) and a larger set of emerging countries (Dinc, 2005) indicate that government-owned banks are often subject to politicians' influence. Second, government ownership of a bank typically suggests negativity in that bank's operations and performance (e.g.Barth et al., 2009; Beck and Levine, 2002; Caprio and Peria, 2000). Moreover, political influence is supposed to be greater over banks than over other government-owned enterprises because the banking industry has special characteristics such as asymmetric information, the deferability of costs when revealed, pervasiveness across the whole economy and comparative ease of controllingfinancial resources compared to entry barriers (Dinc, 2005).
Previousfindings indicate that politicians in power prefer to use government-controlled banks for their political purposes. These politically connectedfirms are also more likely to receive preferential bank loans from government-controlled banks than their non-connected peers. The preferential bank loan treatment takes various forms. For example,Sapienza (2004)finds that interest rates charged by government-owned banks in Italy reflect the local power of the party that controls the bank. Most studies examine the amounts of bank loans from government-controlled banks (e.g.Khwaja and Mian, 2005; Charumilind et al., 2006; Cole, 2004; Dinc, 2005; Claessens et al., 2008).Khwaja and Mian (2005)use loan-level data from Pakistan to discover that politically connectedfirms borrow twice as much and have 50% higher default rates than controlfirms. These politically connected firms obtain loans exclusively from government-owned banks.Claessens et al. (2008)indicate that contributions to winning candidates have a consistently larger impact onfirm value and access to finance, which implies that a political connection to a ruling party is associated with more favorable treatment than a connection to the opposition party.
Hypothesis 1. Firms that are politically connected to a ruling party are associated with more preferential bank loan treatment thanfirms that are connected to opposition parties or non-connected firms. 3.2. Political power entrenchment and preferential bank loan types
Fisman (2001)finds a correlation between reports on Suharto's health and the value of the firms connected to his regime, which implies that political regime change can affect both the preferential treatment bestowed on politically connectedfirms and their value.Degryse and Cayseele (2000)use duration and scope to gauge bank–firm relationships and find that these two factors affect loan interest in opposite ways. Moreover, they find that collateral requirement decreases during the duration of the relationship, but increases in its scope.
We deconstruct the preferential bank loan into six items based on duration and collateral require-ments. We argue that non-collateral loans of three years or more from government-controlled banks are the most favorable way for connected politicians to exert influence that affects bank loans. In contrast, short-term collateral bank loans are the least favorable treatment for politically connectedfirms. This classification allows us to examine the extent of preferential bank loans, particularly during the changeover of ruling parties.
Before 2000, the KMT had been the ruling party in Taiwan for more thanfifty years, and its political position was well entrenched. The unexpected outcome of the 2000 presidential election effectively severed the relation between political connections and the extension of preferential bank loans. The DPP initially won the reins of government and has remained in its infancy of gaining political power because it was not a centralized party and did not have party enterprise or interest in the banking industry on the one hand, and on the other hand, it remained the minority party in the legislature. We therefore postulate that DPP-connectedfirms should have received fewer preferential bank loans when the DPP was in power, compared to KMT-connectedfirms when the KMT was in power.
Hypothesis 2. The extent of preferential treatment resulting from being politically connected is positively correlated with the entrenched position of the ruling party.
3.3. Corporate governance and preferential bank loans
In the following inference, we focus on the relation between firms' internal governance9 and
preferential bank loans. To gauge the overall quality of afirm's internal governance, we construct an
9
For most emerging countries, the external governance structure is weak and legal protections for minority shareholders are limited. For example,Claessens and Fan (2002)confirm the limited protection of minority rights in Asia, which allows controlling shareholders to expropriate minority shareholders.Acemoglu et al. (2005)provide cross-country evidence that countries with weaker property rights and limited protection against expropriation by politicians and the country's elite have substantially lower investment rates and income per capita, along with less developed stock markets. It is therefore unrealistic to depend on an external corporate governance index such as that produced byGompers et al. (2003), who collect 24 anti-takeover provisions and the shareholder's rights complied by the IRRC.
index that roughly covers three dimensions: ownership structure, board structure and related-party transactions.10
How does the quality of corporate governance relate to preferential bank loans? According to previous findings that firms with good internal governance are associated with a lower cost of equity (e.g.Chen et al., 2009) and a lower cost of debt (e.g.Klock et al., 2005; Ashbaugh-Skaife et al., 2006; Chava et al., 2009), we postulate thatfirms with good-governance have more low-cost financial sources than their counterparts with poor-governance, which results in the possibility that the marginal benefits of preferential bank loans is less valuable to good-governancefirms than it is to poor-governance firms. We therefore postulate that corporate governance is negatively correlated with preferential bank loans.
Hypothesis 3. Internal corporate governance is negatively correlated with preferential bank loans. 4. Data and descriptive statistics
Our sample, including all of the listed firms from 1998 to 2006, was collected from the Taiwan Economic Journal (TEJ), the Market Observation Post System (MOPS) and the Taiwan Stock Exchange (TSE). Since 2000, when the ruling party changed from the KMT to the DPP, we subdivide the sampling period into the 1998–2000 period and the 2001–2006 period. Because the two presidential elections studied were characterized asfiercely competitive, in data collection we punctuate the time approaching the two presidential elections as taking place in 2000 and 2004. Specifically, March 2000 and March 2004 are the two pivotal points in time for identifyingfirms' political connections. This allows us to collect most of the politically connectedfirms because some of them disguise their political orientations in normal time. Moreover, preferential treatment is more prevalently observed in election years than in non-election years. For example,Dinc (2005)indicates that government-owned banks increase their lending in election years relative to private banks. We note that there were 462 listedfirms in March 2000 and 669 listed firms in March 2004. Financial firms (56 firms in 2000 and 45 firms in 2004) and firms with inadequate data regarding bank loans, capital structure or corporate governance (103firms in 2000 and 69 firms in 2004) are excluded from the sample. Thefinal sample for analysis consists of 303 firms per year for the 1998–2000 period and 555 firms per year for the 2001–2006 period.
The most critical variable in this research is a state of political connection. We check allfirms via multiple criteria and classify them as politically connected to a certain political party when at least one of the following conditions is met: (1) thefirm was founded or run by the political party; (2) the political party is one of thefirm's large shareholders; (3) the chairman or CEO publicly supports the presidential candidate representing a certain political party, participates in or has his/her employees participate in the presidential campaign or was described by at least one major newspaper as being supportive of a certain political party; and (4) one of thefirm's large shareholders,11directors or top officers is/was a member of
10
A similar approach is found inBlack et al. (2006), who use the unique features of Korea's corporate governance to construct an overall index. However, no corresponding survey has been conducted by the Taiwan Stock Exchange (TSE) in line with the one conducted byBlack et al. (2006). Moreover, the response rate for the survey conducted by the Korean Stock Exchange was very high, which is less likely for a survey anchored by individual researchers. We further compare the constructs covered inBlack et al. (2006)
to those in our study. Wefind that the ownership parity subindex in Black et al. (2005) is similar to the board structure covered in our study. Nevertheless, there is only one item inBlack et al. (2006)and we cover more subitems such as cashflow rights, cash/ control ratio, control-cash deviation and pledge ratio. Meanwhile, the board structure sub-index inBlack et al. (2006)is also similar to the board structure covered in our study, with the exception that theirs has more subitems than ours. The main differences lie in board independence and function. We did not cover them because independent directors were only required for IPOfirms in 2002. Therefore, only partialfirms were associated with independent directors and an even smaller portion of firms had functional committees in their boards in our sampling period. We use board and supervisory control instead. In addition, we include related-party transactions when constructing our corporate governance index. This is not found in the constructs ofBlack et al. (2006). For robustness, we explore each variable in isolation andfind that the result is basically intact.
11The KMT had been the ruling party in Taiwan since it retreated from Mainland China up until the 2000 presidential election.
Before the 2000 changeover, the KMT had accumulated massive assets that are divided into seven holding companies: Central Investment Ltd., Aloha Investment Ltd., Chi-Sen Investment Co., Asia Pacific Holding Co., Ching Tieh Investment Co., Architecture World Investment Co. and Hua-Shia Investment Co. Through these investment companies, the KMT became large shareholders in some of the listedfirms.
parliament, a minister or a top government official.12 We note here that our definition of political
connections is all inclusive to indicate all possible sources that identify whetherfirms are connected to political parties.13However, criteria 1 and 2 might be subject to causality problems betweenfirms that decide to create political connections and political parties that decide establishfirms. Although our follow-up analysis is based on this all-inclusive definition, an unreported result using the sub-sample that satisfies criteria 3 and 4 only remains qualitatively similar.14
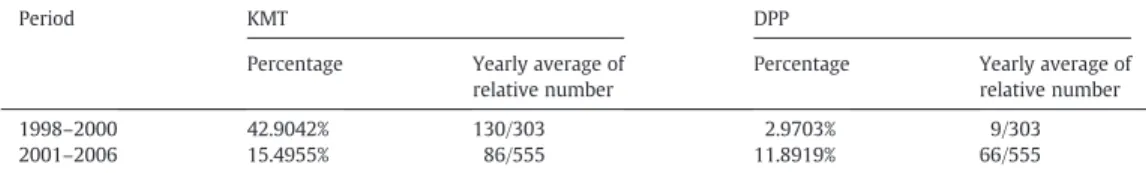
Table 1 summarizes the percentage and relative number of politically connected firms. In the 1998–2000 period a large portion of listed firms were politically connected to the KMT (130/303 or 42.9%), while only a small number of listedfirms were connected to the DPP (9/303 or 3%) right before the initial change in political regime. After the DPP won the 2000 presidential election, the percentage of political connections to the KMT significantly decreased to 15.5% (86/555), whereas the percentage of political connections to the DPP increased to 11.9% (66/555). This change in political control created an unstable political environment in which many business professionals hesitated to be politically connected to a certain party. In fact, in both periods, more than half of the listedfirms did not connect themselves to political parties.
Government ownership of banks is not uncommon outside the United States. AsLa Porta et al. (2002)
illustrate, 42% of the ten largest banks in 92 countries are controlled by government-owned banks. Predominating ownership makes it possible for politicians to leverage their influence via loans from these government-controlled banks.Dinc (2005)indicates that the problem of political influence will be greater in banks than in other government-owned enterprises.15We define a bank as “government-controlled”
when its government ownership exceeds 50% or when more than half of its board seats are controlled by government. In our sampling period, the government-controlled bank loans represent 73% of the total bank loan market and more than 50% of the total assets of the banking industry. We therefore use the loans from government-controlled banks as a proxy offirms' preferential financial sources. The extent of firms' reception of preferential bank loans might be different. We further divide the government-controlled bank loan into six sub-groups based on duration (3-year or beyond, below 3-year and short-term) and whether the loan should be backed up by collateral. In general,firms that receive long-term, non-collateral loans are treated most favorably. All of the measures are divided by total assets.
12Political connections are defined various ways in the literature. For example, Faccio (2006) recognizes a firm as politically
connected if at least one of thefirm's largest shareholders or top officers is a member of parliament, a minister, a head of state or is closely related to a top official. Fan et al. (2007) define a Chinese firm as being politically connected if the CEO is a current or former officer of the central government, local government or the military. Bertrand et al. (2007) consider a firm in France to be politically connected if its CEO attended elite schools and was employed as a civil servant or had a government position. Ferguson and Voth (2008) considerfirms to be politically connected if their executives and supervisory board members were close to the ruling party. Boubakri et al. (2008) consider afirm politically connected if at least one member of its board of directors or its supervisory board is or was a politician. The use of a binary variable in defining political connections is consistent with previous studies such as those of Faccio (2006), Fan et al. (2007), Bertrand et al. (2007), Ferguson and Voth (2008) and Boubakri et al. (2008).
13We note that political donations might be direct evidence of political connections. However, information regarding political
donations was not available before the enactment of the Act of Political Donation on March 31, 2004.
14
Another concern is political connections might relate to ethnicity. However, wefind that ethnicity is not a significant issue in our sampling period. In Taiwan, people are commonly categorized according to their place of origin, such that one would be Taiwanese or a mainlander.“Taiwanese” mainly denotes only those Han Chinese who already lived on Taiwan before the wave of migration that took place at the end of the 1940s (Wachman, 2008). They are the largest ethnic group, comprising about 70% of the population in present-day Taiwan.“Mainlanders” are those born in China who came to Taiwan in the late 1940s or early 1950s, and their offspring. The relation between ethnicity and political connections has been a perplexing and dynamic issue in Taiwan. Even in the literature, the issue has never been conclusively addressed. For example, Smooha (1975) indicates that Taiwan is a candidate for the “nonpluralistic” country label. In contrast, Connor (1973) treats Taiwan as a country that has experienced domestic conflict resulting from ethnic diversity. Unfortunately, Connor did not provide evidence of how this judgment was made. In the 1990s, the Taiwanese people gradually grew to exhibit a clear movement away from a Chinese identity and toward a Taiwanese identity (Ho and Liu, 2008). Nevertheless, as local Taiwanese take over the majority of the significant governmental positions, ethnicity itself is no longer particularly salient in prior to politics.
15The reasons are summarized as follows. First, asymmetric information makes it easy to disguise the political motivation behind a
loan. Second, revealing the costs of any politically-motivated loan can trigger deferment until the loan matures. Third, banks operate across the whole economy to provide politicians with more opportunities to channel funds. Finally, the political elite can maintain and increase its power through the control offinancial resources more easily than they can through open entry barriers in other sectors (Rajan and Zingales, 2003).
Table 2summarizes the statistics of bank loans in the two periods. The 3-year or beyond collateral loan is equivalent in both periods (2.81%). The proportion of 3-year or beyond non-collateral loans slightly increases from 0.31% in the 1998–2000 period to 0.54% in the 2001–2006 period. The proportion of below 3-year collateral loans and non-collateral loans both increase. Collateral loans increase from 0.68% to 0.81% and non-collateral loans increase from 0.13% to 0.26%. An increase is also evidenced in short-term collateral and non-collateral bank loans. We investigate the debt ratio andfind that it slightly increased from 40.12% in the 1998–2000 period to 41.96% in the 2001–2006 period.
According toBoehren and Oedegaard (2003), relating corporate performance to a particular aspect of corporate governance may not capture the true relationship unless the specific aspect is controlled for other aspects of governance. This argument has inspired several researchers to construct single governance indices to be used as scorecards that measure afirm's corporate governance over several dimensions.16 As previously mentioned, external governance is comparatively ineffective in Asian countries,17which makes it impractical to construct an external governance index such as that created by
Gompers et al. (2003). We focus on internal governance and decompose it into three dimensions with a total of ten items that analyze the quality of corporate governance.18 The three dimensions are board structure, ownership structure and related-party transactions. The first two are widely used in the literature to outline sources of power and identify how the power is used in afirm's superstructure. Related-party transactions gauge the interrelationships betweenfirms and their major shareholders in the sense that a higher level of related-party transactions connotes the inferior quality of the governance mechanism (Gordon et al., 2004).
Unlike U.S. and U.K. cases in whichfirms' shares are diffusely held, most firms in Asia are associated with one or several family members who tightly hold the shares. In fact, the existence of controlling shareholders is a prevailing phenomenon around the world (La Porta et al., 1999; Claessens et al., 2000). A family achieves effective control of thefirms in the group by means such as stock pyramids and cross-shareholdings. Moreover, the voting rights possessed by the family are frequently higher than the family's cashflow rights in the firm.Claessens et al. (2000)report these ownership characteristics in detail for a large sample of listedfirms in nine Asian economies.
In ownership structure, we calculate the controlling shareholders' cashflow rights, voting rights and the voting-cash deviation following the definition inLa Porta et al. (1999)andClaessens et al. (2000).
16
For example, governance indices have been constructed for Europe and the U.K. (Bauer et al., 2004), Germany (Drobetz et al., 2004), Russia (Black, 2001), Korea (Black et al., 2006), the U.S. (Gompers et al., 2003) and several emerging markets (Klapper and Love, 2004).
17
Claessens and Fan (2002)confirm the limited protection of minority rights in Asia, which allows controlling shareholders to expropriate minority shareholders.
18
For robustness, we also use individual corporate governance characteristics rather than an aggregated index. The results from individual corporate governance characteristics basically echo the results from a composite corporate governance index. Table 1
The distribution of politically connectedfirms. This table reports the average number and percentage of firms politically connected to the Kuomintang (KMT) and to the Democratic Progressive Party (DPP) in the 1998–2000 period and the 2001–2006 period. A firm is recognized as politically connected when at least one of the following conditions is met: (1) thefirm is founded or run by the political party; (2) the political party is one of thefirm's large shareholders; (3) the firm's chairman or CEO publicly supports the presidential candidate representing a certain political party, participates in or has his/her employees participate in the presidential campaign, or is described by at least one major newspapers as supporting a certain political party; and (4) one of thefirm's large shareholders, directors or top officers is/was a member of parliament, a minister or a top government official.
Period KMT DPP
Percentage Yearly average of relative number
Percentage Yearly average of relative number 1998–2000 42.9042% 130/303 2.9703% 9/303 2001–2006 15.4955% 86/555 11.8919% 66/555
Specifically, the cash flow rights along each chain are the products of all of the ownership in the intermediatefirms along that chain. The total cash flow rights are equal to the sum of all of the cash flow rights from all of the ownership chains. The control rights are the voting rights aggregated along the chain with the weakest link of all of the holding layers.
La Porta et al. (2002)andClaessens et al. (2002)indicate that high cashflow rights denote interest alignment in the sense that controlling shareholders' interest in afirm would be more closely aligned with minority shareholders. Therefore, the cash-flow-right dummy is assigned a value of 1 when the cash flow rights are larger than the sample median, and 0 otherwise. The second variable captures a similar notion by deflating cash flow rights by control rights. The dummy is assigned a value of 1 when the cash/control ratio is larger than the sample median, and 0 otherwise.Claessens et al. (2002)propose a negative entrenchment hypothesis by arguing that the motive for wealth exploitation would be substantive when controlling owners' excessively abusive cross-shareholding or pyramidal structure to lever their control over thefirm. The control-cash deviation connotes negativity in governance quality. The control-cash deviation dummy is assigned a value of 1 when the deviation is smaller than the sample median, and 0 otherwise.
We note that another variable for the investigation of the controlling owners' motives is the pledge ratio, which is defined as the percentage of the controlling owners' shareholdings pledged for a bank loan. A higher level of this implies that a higher proportion of the controlling owners' cashflow investment has been withdrawn from thefirm, which creates less incentive to run the firm properly.Lee and Yeh (2004)
find that the pledge ratio is positively related to the risk of financial distress, which indicates that firms
Table 2
Summary statistics. The sample is composed of 303firms listed in Taiwan per year in the 1998–2000 period and 555 firms listed in Taiwan per year in the 2001–2006 period. Firms' loans from government-controlled banks are nested into six sub-groups based on loan duration (3-year or beyond, below 3-year, short-term) and whether the loan is backed by collateral (collateral and non-collateral). The six bank loan measures are deflated by total assets in the cohort year. Debt ratio is defined as the amount of total debt deflated by total assets. There are two main political parties prevailing in this period: the Kuomintang (KMT) and the Democratic Progressive Party (DPP). Because the DPP initially became the ruling party in 2000 and maintained its ruling status through 2008, the sample is divided into two sub-periods: from 1998 to 2000 and from 2001 to 2006. CGI is a composite corporate governance index that is constructed by summarizing the following dummies: controlling for shareholders' cashflow rights (1 for larger than the sample median, 0 otherwise); cash/control (1 for larger than the sample median, 0 otherwise); the proportion of the directory membership being controlled by the controlling shareholders (1 for smaller than the sample median, 0 otherwise); the proportion of supervisory membership being controlled by the controlling shareholders (1 for smaller than the sample median, 0 otherwise); cash–control deviation (1 for smaller than the sample median, 0 otherwise); the proportion of directors' and supervisors' shareholdings being pledged to bank loans (1 for smaller than the sample median, 0 otherwise); the proportion of related-party sales (1 for smaller than the sample median, 0 otherwise); the proportion of related-party purchases (1 for smaller than the sample median, 0 otherwise); the proportion of related-party loans (1 for smaller than the sample median, 0 otherwise) and the proportion of related-party loan guarantees (1 for smaller than the sample median, 0 otherwise). Therefore, the CGI is in a range of 0 to 10. Sales growth is the change in sales divided by assets. Collateral value is the sum offixed assets and inventory divided total assets. Non-debt tax shield is the sum of investment tax credit and depreciation divided by total assets. Dividend is cash dividend divided by earnings. 1998–2000 2001–2006 Mean (%) S.D. (%) Mean (%) S.D. (%) 3-Year or beyond collateral loan from government-controlled banks (%) 2.8104 4.3982 2.8109 4.5555 3-Year or beyond non-collateral loan from government-controlled banks (%) 0.3054 1.1590 0.5426 4.6113 Below 3-year collateral loan from government-controlled banks (%) 0.6898 1.9695 0.8090 2.4300 Below 3-year non-collateral loan from government-controlled banks (%) 0.1306 0.4431 0.2636 0.8924 Short-term collateral loan from government-controlled banks (%) 2.4356 4.2617 2.7274 5.0649 Short-term, non-collateral loan from government-controlled banks (%) 1.9911 3.8316 2.0124 3.3547 Debt ratio (%) 40.1171 13.8103 41.9626 16.5198 CGI 4.9672 1.7438 5.4020 1.7754 ROA (%) 4.3814 6.8264 3.9817 8.9735 Sales growth (%) 7.6933 77.5895 30.4611 326.6244 R&D (%) 1.2500 2.2496 2.3505 4.2528 Collateral value (%) 47.8128 18.6541 39.8120 19.8198 Non-debt tax shield (%) 2.7112 1.9245 2.6526 2.4464 Dividend (%) 20.6596 30.9206 49.8827 368.0096 Ln (assets) 15.9230 1.0521 15.6962 1.2250
with weak corporate governance are vulnerable to economic downturns. The pledge dummy is assigned a value of 1 when the proportion of directors and supervisors' shareholdings being pledged for a bank loan is smaller than the median, and 0 otherwise. A subtotal of four dummies in ownership structure is included in our corporate governance index.
In relation to board structure, we emphasize the ultimate shareholder's control over the board of directors and the supervisory board. The higher the level of this control, the lower the value attached to the firm (Weisbach, 1988). Moreover, the existence of professional board members may prompt controlling owners to be self-restricted and not exploit thefirm's wealth (Yeh and Woidtke, 2005). Board control is defined as the proportion of board membership that is ultimately controlled by the controlling owner. The same is applicable to the calculation of control in the supervisory board. Because a higher level of control denotes negativity in the governance structure, the board-control (supervisory-control) dummy is assigned a value of 1 when the proportion of board membership (supervisory board) controlled by the controlling shareholder is smaller than the sample median, and 0 otherwise. There are two dummies in the calculation of our corporate governance index.
We deconstruct related-party transactions into four sub-items: sales, purchases, loans and guarantees. For the purpose of common comparison, these sub-items are deflated by total sales, cost of goods sold, net worth and net worth, respectively. Moreover, to ameliorate industry effects, all of the items are adjusted by industry corresponding averages.
Gordon et al. (2004)indicate that weaker corporate governance mechanisms are associated with more and higher dollar amounts for related-party transactions. They alsofind that industry-adjusted returns are negatively associated with related-party transactions. Following this argument, we have four dummies that are assigned a value of 1 when the related-party transaction is smaller than the sample median, and 0 otherwise.
In total, there are ten dummies that construct our corporate governance index. The value falls in a range of 0 to 10. The average corporate governance index (CGI) score is 4.97 in the 1998–2000 period and 5.40 in the 2001–2006 period. The summary statistics of the ten items are reported in the appendix, which show that the overall corporate governance structure marginally improved over the passage of time. The CGI on average was rated 5.107 in the 1998–2000 period and 5.231 in the 2001–2006 period. This improvement is manifested in a lower control-cash deviation, pledge ratio and supervisory control.
The other control variables include ROA, sale growth,19R&D intensity, collateral value, non-debt tax
shield and dividend, and they are used to address the concerns of preferential bank loans and capital structure. For example, Titman and Wessels (1988) indicate that debt ratios are related to a firm's expected growth, non-debt tax shields, volatility or the collateral value of its assets. ROA is used to control afirm's profitability (Leuz and Oberholzer-Gee, 2006). Sales growth is used to control afirm's growth opportunities, and thereforefinancial needs (e.g.Leuz and Oberholzer-Gee, 2006).Charumilind et al. (2006)show that Thaifirms with connections to banks and politicians obtained more long-term loans and needed less collateral during the period preceding the Asianfinancial crisis of 1997 compared to firms without such connections. Dividend is used to control for the case that a firm might seek external financing sources while maintaining its dividend payout (Demirguc-Kunt and Maksimovic, 2002).
DeAngelo and Masulis (1980)note that tax deductions for depreciation and investment tax credits are substitutes for the tax benefits of debt financing. As a result, firms with large, non-debt tax shields include less debt in their capital structures.
On average, the ROA is 4.38% in the 1998–2000 period and 3.98% in the 2001–2006 period. Sale growth is 7.69% in the 1998–2000 period and 30.26% in the 2001–2006 period. Collateral value,20defined as the
ratio of netfixed assets to total assets, decreases from 47.81% in the 1998–2000 period to 39.81% in the 2001–2006 period. Dividend payout, defined as the ratio of cash dividend to net income, increases from 20.65% in the 1998–2000 period to 49.88% in the 2001–2006 period. R&D intensity,21defined as the ratio
19Alternatively, we use Tobin's Q, being gauged by the sum of equity market value and debt book value divided by asset book
value, to serve as the proxy of growth opportunity. The result is qualitatively similar.
20
The trade-off theory contends thatfirms with tangible assets that can be used as collateral are expected to issue more debt (Myers, 1984; Titman and Wessels, 1988).
21
Afirm's R&D expenditure reflects intangibility and can be used as a proxy for the firm's uniqueness (Pandey et al., 2000). Afirm that accumulates more intangible assets may have low collateral value and is therefore negatively related to the debt ratio.
of R&D expenditure to sales, increases from 1.25% in the 1998–2000 period to 2.35% in the 2001–2006 period.
5. Empirical results
InTable 3, we test the means of the lag variables between politically connected and non-connected firms. “Political connection” in this table is a connection to the ruling party, which was the KMT in the 1998–2000 period and the DPP in the 2001–2006 period. The result from the 1998–2000 period indicates that the average CGI for politically connectedfirms (4.38) is significantly lower than that for their non-connected counterparts (5.40) in the 1998–2000 period. The average ROA is significantly higher for connectedfirms (5.03%) than it is for non-connected firms (3.90%). Moreover, politically connected firms are associated with a lower collateral value (46.14%) than that of connectedfirms (49.07%). Finally, the average size of the politically connectedfirms is significantly larger than that of their non-connected counterparts.
Table 3
Test in means for politically-connected vs. non-connectedfirms. This table reports the test in means of the lag variables for politically connectedfirms vs. non-connected firms. Political connection denotes a connection to the KMT in the 1998–2000 period (panel A) and a connection to the DPP in the 2001–2006 period (panel B). All other variables are defined inTable 2.
Political connection Mean t-Statistics (p-value) Panel A: KMT was in power (1998–2000)
CGI Yes 4.38 −8.50
No 5.40 (b0.0001)⁎⁎⁎
ROA (%) Yes 5.03 2.06
No 3.90 (0.0393)⁎⁎
Sales growth (%) Yes 4.63 −0.36
No 10.01 (0.7157)
R&D (%) Yes 1.14 −1.32
No 1.34 (0.1873)
Collateral value (%) Yes 46.14 −2.28
No 49.07 (0.0226)⁎⁎
Non-debt tax shield (%) Yes 2.67 −0.53
No 2.74 (0.5996)
Dividend (%) Yes 22.69 1.21
No 19.14 (0.2280)
Ln(TA) Yes 16.38 11.55
No 15.59 (b0.0001)⁎⁎⁎
Panel B: DPP was in power (2001–2006)
CGI Yes 4.56 −8.62
No 5.52 (b0.0001)⁎⁎⁎
ROA (%) Yes 5.41 2.91
No 3.93 (0.0038)⁎⁎⁎
Sales growth (%) Yes 18.50 −0.85
No 31.76 (0.3929)
R&D (%) Yes 1.59 −3.93
No 2.45 (b0.0001)⁎⁎⁎
Collateral value (%) Yes 40.97 1.20
No 39.52 (0.2295)
Non-debt tax shield (%) Yes 2.91 2.91
No 2.61 (0.0287)⁎⁎
Dividend (%) Yes 48.22 −0.28
No 50.95 (0.7768)
Ln(TA) Yes 16.55 12.78
No 15.58 (b0.0001)⁎⁎⁎
⁎⁎⁎ Represent significance at the 1% level. ⁎⁎ Represent significance at the 5% levels.
The results from the 2001–2006 period bear some similarity to those from the 1998–2000 period: politically connectedfirms are associated with lower CGI, higher ROA and are larger in size. In the 2001–2006 period, the results also indicate that connected firms are associated with lower R&D intensity (1.59%) than non-connectedfirms (2.45%) and a higher non-debt tax shield (2.91%) than non-connected firms (2.61%).22
InTable 4, we use event study to investigate the market response to the unexpected shock of the 2004 presidential election.23The cumulative abnormal returns around the event day (CAR (−5, 1) and CAR (0, 5)) are regressed on the political-connection dummies and the other control variables. These results indicate that KMT-connected (DPP-connected) firms were associated with higher (lower) abnormal returns before the election because the market had anticipated the KMT's victory. However, the incumbent President Chen was reelected by a slim margin, which surprised the market and led to a reversal in returns for KMT-connected (DPP-connected)firms. This finding is parallel to that ofGoldman et al. (2009), who note thatfirms connected to the Republican Party increased in value while firms connected to the Democratic Party decreased in value when the Republican candidate won the 2000 presidential election.
Wefind that good-governance firms were associated with higher abnormal returns after the shock of the 2004 presidential election, which implies that suchfirms were able to reduce the negative impact associated with a surprising presidential election. Moreover, largefirms with higher R&D and advertising expenditure ratios (a proxy of growth opportunities) are positively correlated with cumulative abnormal returns. Firms with higher government shares are associated with lower cumulative abnormal returns
22The results of controlling for industry effect remain qualitatively similar (unreported). Moreover, the industry effects that have
not been emphasized in this study are because most state-owned enterprises have been gradually privatized and listed for public trading. Utility andfinancial firms are excluded from our sample because the former remain state-owned and the latter are subject to different regulations.
23
There were only 9 DPP-connectedfirms in the 2000 presidential election. Table 4
Regression of abnormal return for politically-connectedfirms — 2004 presidential election. This table reports the regression of the cumulative abnormal returns for the listedfirms in Taiwan around the event window of the 2004 presidential election. The cumulative abnormal returns (CAR (−5, 1) and CAR (0, 5)) are calculated using the traditional market model in which the systematic risk is estimated in a window from day 300 to day 46 before the 2004 presidential election day. The CGI is the composite corporate governance index. KMT (DPP) is a dummy variable that is assigned a value of 1 when the listedfirms are politically connected to the KMT (DPP). (R&D + Ads.) / Net Sales is the sum of R&D expenditure and advertisement divided by net sales. Gov. Shares denotes government shares in the listedfirms. In each cell, the regression coefficient and p-value in parentheses are reported in upper and lower case.
CAR (−5, −1) CAR (0, 5) Intercept −9.562 (−6.828)⁎⁎⁎ −10.632(−7.479)⁎⁎⁎ −9.937(−7.013)⁎⁎⁎ −9.773(−5.639)⁎⁎⁎ −8.632(−4.970)⁎⁎⁎ −9.055(−5.181)⁎⁎⁎ CGI −0.021 (−0.220) −0.123 (−1.268) −0.044 (−0.450) 0.504 (4.190)⁎⁎⁎ 0.595 (5.028)⁎⁎⁎ 0.548 (4.528)⁎⁎⁎ KMT 1.223 (4.341)⁎⁎⁎ 1.103 (3.791)⁎⁎⁎ −0.903 (−2.588)⁎⁎ −0.671 (−1.871)⁎ DPP −0.869 (−2.652)⁎⁎⁎ −0.547(−1.634) 1.246 (3.112)⁎⁎⁎ 1.050 (2.543)⁎⁎ Ln(Asset) 1.258 (6.158)⁎⁎⁎ 1.483 (7.158)⁎⁎⁎ 1.330 (6.373)⁎⁎⁎ 0.993 (3.926)⁎⁎⁎ 0.762 (3.012)⁎⁎⁎ 0.855 (3.323)⁎⁎⁎ Debt % −0.006 (−1.070) −0.005 (−0.812) −0.006 (−1.025) −0.021 (−2.929)⁎⁎⁎ −0.022 (−3.113)⁎⁎⁎ −0.021 (−3.015)⁎⁎⁎ (R&D + Ads.) / Net Sales % 6.188
(2.254)⁎⁎ 5.083 (1.836)⁎ 5.962 (2.172)⁎⁎ 6.640 (1.954)⁎ 7.609 (2.250)⁎⁎ 7.074 (2.089)⁎⁎ Gov. shares −0.042 (−2.586)⁎⁎ −0.033 (−1.965)⁎ −0.035 (−2.096)⁎⁎ 0.030 (1.521) 0.016 (0.786) 0.017 (0.841) Adj. R2 0.129 0.111 0.131 0.133 0.138 0.141 ⁎⁎⁎ Represent significance at the 1% level.
⁎⁎ Represent significance at the 5% levels. ⁎ Represent significance at the 10% level.
before the election result, which implies thatfirms with higher government shares are exposed to higher political risks, and therefore have a lower value.
InTable 5, we conduct tests on the differences in bank loan types and debt ratios for politically connected and non-connectedfirms in the two sub-periods. The results indicate that in the 1998–2000 period, when the KMT was in power, KMT-connectedfirms enjoyed a higher ratio of 3-year or beyond, non-collateral loans from government-controlled banks (0.44%) than non-connectedfirms (0.20%). This is consistent with Hypothesis 1, which suggests that politically connected firms enjoy a higher level of preferential bank loans. Moreover, KMT-connectedfirms were associated with a lower ratio of short-term collateral loans (1.21%) compared to their non-connected counterparts (2.21%). This is probably because they had enjoyed a higher portion of preferential long-termfinancial sources. Moreover, KMT-connected firms are associated with a higher debt ratio (39.77%) than that of non-connected firms (36.54%). Because there were only 9firms identified as politically connected to the DPP, the contrast in DPP connection is insignificant.
In the 2001–2006 period when the DPP was in power, KMT-connected firms were still associated with a higher proportion of long-term bank loans; however, the preferential advantage seems to switch from non-collateral to collateral loans and from long-term to short-term loans. KMT-connectedfirms were associated with a higher portion of 3-year or beyond collateral loans (4.04%) than non-connectedfirms
Table 5
Difference tests for bank loans and debt ratios. This table summarizes the tests for the differences in the bank loans and debt ratios of firms that were connected to the KMT and DPP political parties and firms were not in the 1998–2000 period (panel A) and in the 2001–2006 period (panel B). All of the variables are defined inTable 2. For each category, we report the mean, t-statistics and p-value in parentheses. KMT Mean (%) t-Value (p-value) DPP Mean (%) t-Value (p-value) Panel A: 1998–2000
3-Year or beyond collateral loan Yes 2.5560 −0.89 (0.3737)
Yes 0.6229 −1.52 (0.1300)
No 3.0034 No 2.8783
3-Year or beyond non-collateral loan Yes 0.4388 1.74 (0.0829)⁎
Yes 0.0878 −0.57 (0.5683)
No 0.2041 No 0.3121
Below 3-year collateral loan Yes 0.6366 −0.41 (0.6806)
Yes 0.1257 −0.87 (0.3838)
No 0.7301 No 0.7073
Below 3-year non-collateral loan Yes 0.1685 1.29 (0.1984)
Yes 0.1088 −0.15 (0.8809)
No 0.1019 No 0.1313
Short-term collateral loan Yes 1.2122 −2.63 (0.0089)⁎⁎⁎
Yes 1.4408 −0.71 (0.4779)
No 2.2147 No 2.4665
Short-term, non-collateral loan Yes 1.2599 −1.17 (0.2433)
Yes 1.4083 −0.46 (0.6439)
No 1.5136 No 2.0092
Debt ratio Yes 39.773 2.17 (0.0307)⁎⁎
Yes 43.770 0.81 (0.4214) No 36.535 No 40.005
Panel B: 2001–2006
3-Year or beyond collateral loan Yes 4.0395 2.70 (0.0071)⁎⁎⁎
Yes 3.6701 1.25 (0.2145)
No 2.589 No 2.6935
3-Year or beyond non-collateral loan Yes 0.4727 −0.44 (0.6770)
Yes 0.4788 −0.34 (0.7320)
No 0.5554 No 0.5513
Below 3-year collateral loan Yes 1.2845 1.95 (0.0513)⁎
Yes 0.5193 −1.03 (0.3022)
No 0.7231 No 0.8486
Below 3-year non-collateral loan Yes 0.4832 2.46 (0.0141)⁎⁎
Yes 0.3139 0.49 (0.6254)
No 0.2239 No 0.2567
Short-term collateral loan Yes 2.5273 −0.39 (0.6944)
Yes 2.2380 −0.84 (0.4032)
No 2.7635 No 2.7942
Short-term, non-collateral loan Yes 2.3124 1.01 (0.3141)
Yes 2.6137 1.97 (0.0436)⁎⁎
No 1.9582 No 1.9302
Debt ratio Yes 45.500 2.18 (0.0297)⁎⁎
Yes 42.243 0.15 (0.8833) No 41.313 No 41.925
⁎⁎⁎ Represent significance at the 1% level. ⁎⁎ Represent significance at the 5% levels.
(2.59%). That is, KMT-connected firms in the DPP-reigning period were more likely to be asked for collateral to back up their long-term loans. In contrast, DPP-relatedfirms were associated with a lower ratio of long-term collateral bank loans when the KMT was in power (1998–2000). DPP-related firms, on average, enjoyed a higher portion of short-term, non-collateral loans.
The contrast in politically connectedfirms' preferential loans from government-controlled banks in different regimes yields an interesting pattern. The KMT had been the ruling party in Taiwan for more than fifty years (1949–2000), such that firms that were politically connected to the KMT enjoyed the most preferential bank loans during the period that the KMT's political power was entrenched. The changeover prompted by the 2000 election and the power struggle that followed during the 2004 election resulted in an unstable political environment. This type of instability in a political environment dramatically changes the types of preferential bank loans that politically connectedfirms can obtain. The contrast between the types of preferential bank loans received by KMT-connectedfirms and those received by DPP-connected firms is consistent withHypothesis 2, which specifies that the extent of preferential treatment that results from political connection is positively correlated with the entrenched position of the ruling party.
InTable 6, we classify all of thefirms into high and low CGI groups based on the sample median and test the differences in preferential bank loans and debt ratios for both sub-periods. In the 1998–2000 period, high-CGIfirms were associated with lower, long-term, non-collateral loans (0.16%) than low-CGI firms (0.40%). Moreover, these high-CGI firms were also associated with a lower ratio of short-term, non-collateral loans (1.61%) and debt ratios (37.98%) compared to the corresponding measures of 2.25% and 41.54% for low-CGI firms. In this period, corporate governance deterred firms from accessing non-collateral loans.
In the 2001–2006 period, high-CGI firms on average were associated with a lower ratio of long-term collateral (2.37%) and non-collateral loans (0.40%) than their low-CGI counterparts (3.23% and 0.68%, respectively). However, high-CGIfirms were also associated with a higher ratio of short-term collateral loans (3.32%) than low-CGIfirms (2.20%). The debt ratios for high-CGI firms (40.26%) were also lower than for low-CGIfirms (42.90%). In general, corporate governance does deter firms from using preferential bank loans, consistent withHypothesis 3.
A comparison of the statistics between the two periods illustrates that banks were more willing to provide preferential bank loans tofirms during the second period than they were during the first. This could be becausefinancial markets have grown increasingly more competitive and banks with abundant cash are more willing to provide preferential bank loans. Nevertheless, corporate governance remains a
Table 6
Differences in preferential bank loans for high- vs. low-CGIfirms. This table reports the test for differences in preferential bank loans for high- vs. low-CGIfirms. All of the variables are defined inTable 2. All of thefirms were classified into high and low groups based on the sample median of the CGI. For each category, we report the mean, t-statistics and p-value in parentheses.
1998–2000 2001–2006 CGI Mean (%) t-Value (p-value) CGI Mean (%) t-Value (p-value) 3-Year or beyond collateral loan High 2.59 −1.17
(0.2404)
High 2.37 −4.29 (b0.0001)⁎⁎⁎
Low 2.98 Low 3.23
3-Year or beyond non-collateral loan High 0.16 −2.70 (0.0070)⁎⁎⁎
High 0.40 −3.84 (0.0005)⁎⁎⁎
Low 0.40 Low 0.68
Below 3-year collateral loan High 0.68 −0.07 (0.9441)
High 0.74 −1.06 (0.2880)
Low 0.69 Low 0.86
Below 3-year non-collateral loan High 0.15 0.70 (0.4814)
High 0.25 −0.80 (0.4253)
Low 0.12 Low 0.28
Short-term collateral loan High 2.56 0.52 (0.6006)
High 3.32 5.32 (b0.0001)⁎⁎⁎
Low 2.38 Low 2.20
Short-term, non-collateral loan High 1.61 −2.16 (0.0312)⁎⁎
High 2.38 0.72 (0.4727)
Low 2.25 Low 2.14
Debt ratio High 37.98 −3.51 (0.0005)⁎⁎⁎
High 40.26 −3.55 (0.0004)⁎⁎⁎ Low 41.54 Low 42.90
⁎⁎⁎ Represent significance at the 1% level. ⁎⁎ Represent significance at the 5% levels.
crucial factor in reducing afirm's ability to access preferential bank loans. As previously stated, high-CGI firms might have alternative financial sources, which make preferential loans less attractive.
InTable 7, we conduct pooling regressions for political connection and bank loans in the 1998–2000 period after controlling for yearlyfixed effects and industry fixed effects. Panel A (B) reports the results for
Table 7
The regressions for political connection on bank loans from 1998 to 2000. This table reports the pooling time-series and cross-sectional regressions forfirms that were politically connected and those that were not in the 1998–2000 period. The dependent variables include bank loans from government-controlled banks and debt ratios. Bank loans are further divided into four categories based on duration (3-year or beyond and short-term) and on whether the loan is backed by collateral assets (collateral and non-collateral). Yearlyfixed effect and industry fixed effect were controlled in the regression, but not reported. All of the variables are defined inTable 2. Panel A (B) reports the regression forfirms that were politically connected to the KMT (DPP) and those that were not. In each cell, the regression coefficient and p-value in parentheses are reported in upper and lower case.
3-Year↑ collateral loan 3-Year↑ non-collateral loan Short-term collateral loan Short-term non-collateral loan Debt ratio Panel A: KMT Intercept 0.01300 (1.62) 0.0053 (1.93)⁎ 0.0179 (1.77)⁎ 0.0267 (2.91)⁎⁎⁎ 0.3760 (13.31)⁎⁎⁎ KMT −0.0057 (−1.84)⁎ 0.0014 (2.02)⁎⁎ −0.0086 (−1.82)⁎ −0.0056 (−1.25) 0.0368 (2.59)⁎⁎⁎ CGI −0.0018 (−2.01)⁎⁎ −0.0009(−2.65)⁎⁎⁎ 0.0016(1.64) −0.0012 (−1.33) −0.0048(−1.93)⁎ ROA −0.0293 (−1.99)⁎⁎ −0.0008 (−0.12) −0.1260 (−7.31)⁎⁎⁎ −0.0589 (−3.61)⁎⁎⁎ −0.4021 (−9.65)⁎⁎⁎ Sales growth −0.00001 (−0.03) 0.00002 (0.12) 0.0003 (0.51) 0.0001 (0.28) 0.0009 (0.78) R&D −0.0574 (−0.61) −0.0318 (−1.11) −0.19903 (−2.11)⁎⁎ −0.1125 (−1.26) −0.3364 (−1.27) Collateral value 0.0366 (3.41)⁎⁎⁎ −0.0007 (−0.19) 0.0329 (2.91)⁎⁎⁎ −0.00006 (−0.01) 0.1646 (5.40)⁎⁎⁎ Non-debt tax shield 0.3656
(3.56)⁎⁎⁎ 0.047 (1.43) −0.2652 (−2.49)⁎⁎ 0.0334 (0.33) −1.2115 (−4.15)⁎⁎⁎ Dividend 0.0009 (0.38) −0.0010 (−0.0010) −0.0045 (−1.59) −0.0037 (−1.38) −0.0188 (−2.80)⁎⁎⁎
Industry effect Yes Yes Yes Yes Yes
Yearly effect Yes Yes Yes Yes Yes
Adj. R2 0.0511 0.0275 0.1027 0.0260 0.1671 Panel B: DPP Intercept 0.0111 (1.50) 0.0066 (2.57)⁎⁎ 0.0126 (1.31) 0.0233 (2.67)⁎⁎⁎ 0.3970 (14.72)⁎⁎⁎ DPP −0.0157 (−0.77) −0.0025(−0.64) −0.0087(−0.65) −0.0064(−0.50) 0.0372 (0.92) CGI −0.0017 (−1.90)⁎ −0.0009 (−2.98)⁎⁎⁎ 0.0020 (2.04)⁎⁎ −0.001 (−1.11) −0.0059 (−2.40)⁎⁎ ROA −0.0299 (−2.03)⁎⁎ −0.0005 (−0.07) −0.1272 (−7.38)⁎⁎⁎ −0.0597 (−3.66)⁎⁎⁎ −0.3988 (−9.54)⁎⁎⁎ Sales growth −0.00002 (−0.04) 0.00003 (0.13) 0.0002 (0.50) 0.0001 (0.27) 0.0009 (0.80) R&D −0.0564 (−0.60) −0.0340 (−1.19) −0.1923 (−2.03)⁎⁎ −0.1083 (−1.21) −0.3604 (−1.36) Collateral value 0.0364 (3.38)⁎⁎⁎ −0.0010 (−0.29) 0.0335 (2.96)⁎⁎⁎ 0.0003 (0.03) 0.1620 (5.29)⁎⁎⁎ Non-debt tax shield 0.3582
(3.48)⁎⁎⁎ 0.0466 (1.41) −0.2728 (−2.55)⁎⁎ 0.0281 (0.28) −1.1858 (−4.05)⁎⁎⁎ Dividend 0.0008 (0.36) −0.0010 (−0.95) −0.0046 (−1.63) −0.0038 (−1.41) −0.0185 (−2.75)⁎⁎⁎
Industry effect Yes Yes Yes Yes Yes
Yearly effect Yes Yes Yes Yes Yes
Adj. R2 0.0495 0.0168 0.0998 0.0245 0.1616
⁎⁎⁎ Represent significance at the 1% level. ⁎⁎ Represent significance at the 5% levels.