R E S E A R C H A R T I C L E
Open Access
Health literacy and the determinants of
obesity: a population-based survey of sixth
grade school children in Taiwan
Shu-Fang Shih
1, Chieh-Hsing Liu
1, Li-Ling Liao
2*and Richard H. Osborne
3Abstract
Background: Health literacy has become an important health policy and health promotion agenda item in recent years. It had been seen as a means to reduce health disparities and a critical empowerment strategy to increase people’s control over their health. So far, most of health literacy studies mainly focus on adults with few studies investigating associations between child health literacy and health status. This study aimed to investigate the association between health literacy and body weight in Taiwan’s sixth grade school children.
Methods: Using a population-based survey, 162,209 sixth grade (11–12 years old) school children were assessed. The response rate at school level was 83 %, with 70 % of all students completing the survey. The Taiwan child health literacy assessment tool was applied and information on sex, ethnicity, self-reported health, and health behaviors were also collected. BMI was used to classify the children as underweight, normal, overweight, or obese. A multinomial logit model with robust estimation was used to explore associations between health literacy and the body weight with an adjustment for covariates.
Results: The sample consisted of 48.9 % girls, 3.8 % were indigenous and the mean BMI was 19.55 (SD = 3.93). About 6 % of children self-reported bad or very bad health. The mean child health literacy score was 24.03 (SD = 6.12, scale range from 0 to 32). The overall proportion of obese children was 15.2 %. Children in the highest health literacy quartile were less likely to be obese (12.4 %) compared with the lowest quartile (17.4 %). After controlling for gender, ethnicity, self-rated health, and health behaviors, children with higher health literacy were less likely to be obese (Relative Risk Ratio (RRR) = 0.94, p < 0.001) and underweight (RRR = 0.83, p < 0.001). Those who did not have regular physical activity, or had sugar-sweetened beverage intake (RRR > 1.10, p < 0.0001) were more likely to report being overweight or obese.
Conclusions: This study demonstrates strong links between health literacy and obesity, even after adjusting for key potential confounders, and provides new insights into potential intervention points in school education for obesity prevention. Systematic approaches to integrating a health literacy curriculum into schools may mitigate the growing burden of disease due to obesity.
Keywords: Children, Heath literacy, Health behavior, Body mass index, Taiwan
* Correspondence:hililin@isu.edu.tw
2Department of Health Management, I-Shou University, No. 8, Yida Rd.,
Jiaosu Village, Yanchao District, Kaohsiung City 82445, Taiwan Full list of author information is available at the end of the article
© 2016 Shih et al. Open Access This article is distributed under the terms of the Creative Commons Attribution 4.0 International License (http://creativecommons.org/licenses/by/4.0/), which permits unrestricted use, distribution, and reproduction in any medium, provided you give appropriate credit to the original author(s) and the source, provide a link to the Creative Commons license, and indicate if changes were made. The Creative Commons Public Domain Dedication waiver (http://creativecommons.org/publicdomain/zero/1.0/) applies to the data made available in this article, unless otherwise stated.
Background
Health literacy has become an important health policy and health promotion agenda item in recent years [1, 2]. It has been defined by the World Health Organization as “The characteristics and social resources needed for people to access, understand and use information to make decisions about health. Health literacy includes the capacity to communicate, assert and enact these decisions [3]”. The United Nations Economic and Social Council Ministers Declaration in 2009, highlighted health literacy as an important determinant of health and called for the development of actions to promote health literacy [2]. Furthermore, health literacy had been seen as a means to reduce health disparities and a critical empowerment strategy to increase people’s control over their health, their ability to seek information and their ability to take respon-sibility for their health [3, 4]. While policy initiatives exist in North America [5] and in the European Union, these have tended to focus only on adults. While there is much to gain through improving health literacy in adults, under-standing earlier intervention opportunities in children is most certainly warranted. Improving health literacy in chil-dren may also increase health promoting behaviors, im-prove health service use and potentially increase health behaviors of the child’s family. Health literacy is a relatively new field and it is not clear whether it can be changed, however it should be possible to improve health know-ledge, health choices and children’s and family's access to services thought effective interventions. Overall, it seems reasonable that strong health education programs should be able to improve health literacy and a range of future health outcomes.
A systematic review of 215 health literacy studies found that there were no validated tools to specifically measure health literacy in children younger than 12 years of age. While some tools had been applied in children or adoles-cents, they were adaptations of adult version [6]. In addition, the studies that focused on child health literacy used a definition and analyses that were highly medical-ized. So far, only a few studies have considered child or adolescent health literacy in non-medical settings such as schools [7, 8]. While there is a substantial body of research on adults and/or clinical populations [9], the development of health literacy approaches in child and adolescent set-ting has been limited [10].
Most studies that have considered health literacy and children have focused on associations between parents or caregivers’ health literacy and health care of children [11–17] or health outcomes [18] with only a few ex-ploring the role of children’s health literacy and their health outcomes. One study of children with Type 1 diabetes found that there was no relationship between children’s health literacy skill and hemoglobin A1C [19]. Another study found that child health literacy was
negatively associated with BMI Z-scores in overweight children [20]. However, this relatively small study (n = 171) mainly focused on overweight children and used a health literacy instrument initially designed for adults. Given the dearth of research in this area, Keim-Malpass et al. [21] concluded that to advance this field, new approach to direct health literacy assessment of children or adoles-cents is warranted.
To advance the understanding of health literacy and health in children, the Taiwan Ministry of Education commissioned the development of a child-specific meas-ure of health literacy within its national Health-Promoting Schools (HPS) initiative. A national survey was conducted among sixth grade school children and this provided the opportunity to gain a deeper understanding of health liter-acy to guide policy and programs in this setting. In Taiwan, the prevalence of overweight and obesity for elementary schools is 30.4 % according to the student examination data from the Ministry of Education [22]. Whether body weight is associated with health literacy is still un-known in Taiwan. The specific aim of the current study was to determine the association between health literacy and body weight using data from the Taiwan child health literacy test.
Methods
Participants
This research was sponsored, reviewed, and then con-ducted under the supervision of Taiwan’s Ministry of Education. The Ministry of Education approved the sci-entific protocol and ethical aspects of this study, and the use of the data collected. Since this was a policy research project initiated and overseen by the Government of Taiwan, specific Institutional Review Board approval was not required. Importantly, the conduct of the study was consistent with the ethical guidelines of the Helsinki Declaration for Ethical Principles for Medical Research Involving Human Subjects [23].
The Ministry of Health invited all schools to participate. An anonymous web-based National Survey of Child Health Literacy in Taiwan’s elementary schools was undertaken in April 2012. Participation was voluntary and a total of 2400 schools (83 %) took part. As this was part of a national ap-proach to improve the quality of health education, written consent from individual students was not sought, however students and their parents were informed of the survey and it was voluntary. Completion of the survey was regarded as implied consent. There were 162,609 sixth grade (11–12 years old) children who completed the an-onymous online survey with a response rate of 69.5 % at the school level. After excluding those with missing birth dates, there were 162,209 children in the analysis. The dis-tribution of the gender in our sample is similar to data from the Ministry of Education. The percentage of gender
for 6th grade boys and girls were about 52 and 48 % respectively [24].
Measures
BMI was calculated using height, weight, age and gender using the extended International Body Mass Index Cut-offs proposed by the International Obesity Task Force (IOTF) and modified for Asian body types. Four groups were generated by combining underweight grade 1 to 3 (BMI < 16, 16 < =BMI < 17, and 17 < =BMI < 18.5), normal weight (18.5 < =BMI < =23), overweight (23 < BMI < =25, unofficial Asian cut-off ) and overweight (25 < BMI < =27), obesity (27 < BMI < =30, unofficial Asian cut-off ), obesity (30 < BMI < =35), and morbid obesity (35 < BMI). While height and weight were self-reported by the students, teachers helped students to answer this question. In Taiwan, weights and heights were measured every semes-ter and the teachers had the data for all students. There-fore, the data are likely to be more reliable than most large scale surveys of obesity.
The Taiwan Child Health Literacy test is a course-based test. In order to ensure the test results were relevant to ed-ucators, we designed the test based on the learning tax-onomy proposed by Bloom [25], including the following domains: cognitive, psychomotor, and affective domain. Therefore, in the cognitive domain, the curriculum sought to equip students with adequate knowledge in certain health conditions. For the psychomotor domain, skills for being able to take actions in certain scenarios was sought, and for the affective domain, the curriculum sought to equip students with positive values in certain health con-ditions, or have healthier decision intentions.
The Taiwan Child Health Literacy test was developed with sixth grade students in elementary schools using a grounded approach capturing health literacy elements across the 10 health education areas of the Taiwan Na-tional Health Education Curriculum. The original test includes 40 multiple choice questions to elicit knowledge, attitudes and preferred behavior in response to a vignette (short narrative or story of three to five sentences) linked to one or more of the health education curriculum areas. The test was developed through a series of focus groups, expert review and then field testing in 273 students from 8 schools. The final test consisted of 32 questions with item discrimination of 0.55 to 1.89 and item difficulty of −1.7 to 0.41 according to Item Response Theory. The Cronbach reliability is 0.87. The questionnaire has been reported elsewhere [26], and an example question is shown in Additional file 1 and is available from the corre-sponding author.
Information was also collected on sex, ethnicity, self-rated health, exercise for at least 30 min every day, and consumption of sugar-sweetened beverages (SSB). The be-haviors were categorized into: (1) exercise at least 30 min
every day and had no SSB intake; (2) either exercise at least 30 min every day or had no SSB intake; (3) no exer-cise at least 30 min every day and SSB intake. Self-rated health was measured using single item, with responses scored as very good, good, fair, bad or very bad.
The data were retained by the Ministry of Education, and those who are interested in using the data should submit an application to the Ministry.
Statistical analysis
Descriptive statistics included frequencies and percentages of research variables. Chi-square test was used to test the bivariate associations between category of BMI and health literacy, as well as other covariates such as sex, ethnicity, self-rated health status, and health behaviors. Since the dependent variable was four categories of BMI (under-weight, normal, over(under-weight, and obese), a multinomial lo-gistic regression model was used to analyze the factors associated with the probability of being underweight or overweight, or obesity relative to a normal weight with an adjustment for covariates. Since students were nested within schools, however, data on these clusters were not available; we used the Huber Sandwich Estimator to pro-vide robust standard errors.P values of less than 0.05 for associations were considered to indicate statistical signifi-cance. Stata 12 software was used for all analyses.
Results
Participant characteristics
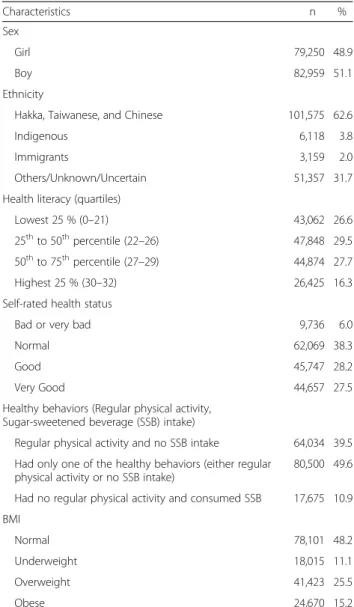
Table 1 shows the characteristics of 162,209 grade six school children across 2400 elementary schools in Taiwan. Of these children, more than half were girls, and less than 4 % were from indigenous groups. However, around 32 % of children were not certain about their ethnicity. Self-rated health was Self-rated as bad or very bad by 6 %. Only around 40 % reported regular physical activity and had no SSB intake, and almost 50 % of children had at least one healthy behavior, and about 11 % of children had no regu-lar physical activity but had SSB intake. According to IOTF cutoffs, less than 50 % of children had normal weight, around 11 % were underweight, more than 25 % were overweight, and more than 15 % were classified as obese. The mean BMI was 19.55 % (SD = 3.93) and the mean of child health literacy score was 24.03 (SD = 6.12, scale range from 0 to 32).
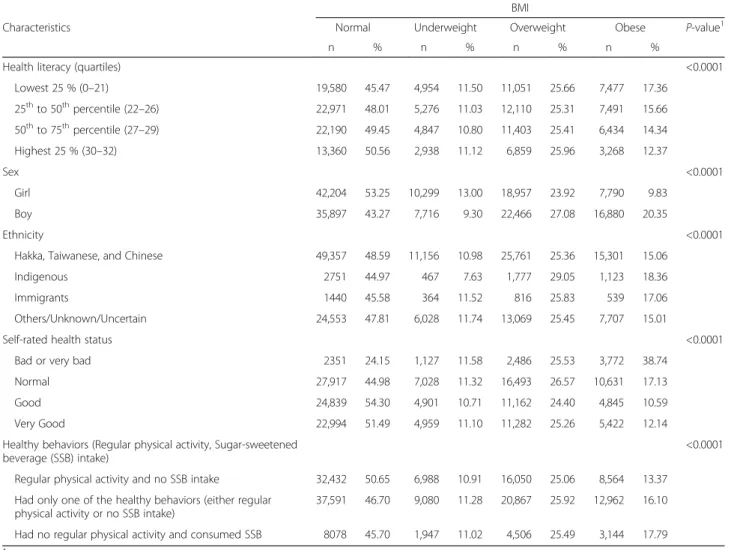
Distribution of BMI across demographic characteristics
Table 2 illustrates the distribution of BMI across different individual characteristics. Among girls, over half had nor-mal weight (53.25 %) while 23.92 % were classified as overweight, 13.00 % were underweight, and 9.83 % were classified as obese. 43.27 % of boys had normal weight, 27.08 % were classified as overweight, 20.35 % were classi-fied as obese; and 9.30 % were classiclassi-fied as underweight.
44.97 % of the indigenous children had normal weight, 29.05 % were classified as overweight, and 18.36 % were classified as obese. All covariates were statistically associ-ated with categories of BMI.
Among children with a health literacy score in the bottom quartile, 43.02 % were classified as overweight or obese. For those children who perceived that they had bad or very bad health status, 38.74 % were classi-fied as obese. This percentage was much higher when compared to the percentage of obese children who re-ported their health as normal (17.13 %), or good (10.59 %), or very good (12.14 %). Finally, obese chil-dren were less likely to report both regular activity and no SSB (13.37 %) compared with those with one poor health habit (16.10 %) or two poor health habits (17.79 %).
Association between BMI and health literacy
After controlling for sex, ethnicity, self-rated health status and health behaviors, being in the highest quartile of heath literacy was associated with lower likelihood of be-ing either underweight or obese. However, higher health literacy was associated with higher likelihood of being overweight than having normal weight (Table 3). When compared to those with lowest health literacy, those who had higher health literacy (i.e., those below 25th compared with above 25th percentile) were less likely to be under-weight than to be in the normal group. Compared with those who had two healthy behaviors, those who had only one healthy behavior were more likely to be underweight than to have normal weight (Relative Risk Ratio (RRR) = 1.05,p < 0.001). Those who did not have regular physical activity or consumed SSB (RRR = 1.12,p < 0.001), or those who did not have regular physical activity and consumed SSB (RRR = 1.10 p < 0.001) were more likely to be over-weight than to have normal over-weight. Similarly, Those who did not have regular physical activity or consumed SSB (RRR = 1.27, p < 0.001) or those who did not have regular physical activity and consumed SSB (RRR = 1.31,p < 0.001) were more likely to be obese than to have normal weight. In terms of ethnicity, compared with Hakka, Taiwanese and Chinese groups, indigenous groups were less likely to be underweight than to have normal weight (RRR = 0.73, p < 0.001), and this group was much more likely to be overweight (RRR = 1.24, p < 0.001) or obese (RRR = 1.32,p < 0.001) than to have normal weight.
Discussion
This is the first study to systematically investigate the as-sociation between child health literacy and body weight in school children. The use of a specific child health literacy instrument in a large population - based sample has shown that health literacy is an independent pre-dictor of BMI. Importantly, those with the highest health literacy are those less likely to be obese after adjustment for the usual demographic predictors of BMI.
Our findings are similar to a much smaller study under-taken by Sharif et al. [20], who examined functional health literacy (reading and numeracy-related health literacy) in obese children however, our study provides clearer evi-dence given our health literacy test was children specific and nationally representative. According to Taiwan’s Min-istry of Education, the percentage of overweight and obese elementary school children in Taiwan is 30.4 % [22]. Child-hood obesity is an important predictor of adult obesity and appears to increase the risk of subsequent morbidity, whether or not obesity persists into adulthood. Conversely, underweight is also a public health problem that needs to be addressed in Taiwan. Therefore, weight management has become one of the most important health agenda in Taiwan Unfortunately it is mainly considered from the
Table 1 Characteristics of study sample (n = 162,209)
Characteristics n %
Sex
Girl 79,250 48.9
Boy 82,959 51.1
Ethnicity
Hakka, Taiwanese, and Chinese 101,575 62.6
Indigenous 6,118 3.8
Immigrants 3,159 2.0
Others/Unknown/Uncertain 51,357 31.7
Health literacy (quartiles)
Lowest 25 % (0–21) 43,062 26.6
25thto 50thpercentile (22–26) 47,848 29.5 50thto 75thpercentile (27–29) 44,874 27.7
Highest 25 % (30–32) 26,425 16.3
Self-rated health status
Bad or very bad 9,736 6.0
Normal 62,069 38.3
Good 45,747 28.2
Very Good 44,657 27.5
Healthy behaviors (Regular physical activity, Sugar-sweetened beverage (SSB) intake)
Regular physical activity and no SSB intake 64,034 39.5 Had only one of the healthy behaviors (either regular
physical activity or no SSB intake)
80,500 49.6 Had no regular physical activity and consumed SSB 17,675 10.9 BMI
Normal 78,101 48.2
Underweight 18,015 11.1
Overweight 41,423 25.5
obesity management perspective without a substantive focus on underweight. We found that underweight is associated with low health literacy and this provides guidance for future interventions. Sharif et al. [20] pointed out that in recent de-cades, when dealing with child health issues, we not only tend to ignore the improvement of self-management skills, but also provide little emphasis on the effects that heath literacy has on health outcomes. Systematic approaches to providing ad-equately nutritional education, dietary intervention, encour-agement of regular physical activity, as well as changing environments and food supply, are needed to prevent obesity and to reduce the increase of obesity-related disorders among children [27]. However, in order to enable children to partici-pate in health management in the long term, as well as being able to avoid the temptations of junk foods such as sugar bev-erage in their daily environments, we need to improve chil-dren’s health literacy and nurture our children to “have knowledge, personal skill, and confidence to take action and enhance individual’s and community’s health by changing in-dividual’s lifestyle and living conditions [28]”.
In our study, we did find that those with higher health literacy were less likely to be underweight than to have normal weight. The potential reasons for this are un-clear. It may be due to children with low health literacy lived in regions or families with very poor access to food, or they were affected by an eating disorder or other con-dition. On the other hand, we found that children with lower health literacy were more likely to report being obese. While the study controlled for key potential con-founders, it is likely that a parental health literacy effect is present, i.e., children living in more affluent and well-educated family environments, may have greater access to excess high calorie foods. Previous research has indicated that an association may exist between limited caregiver lit-eracy skills and indicators of poor child nutrition [6].
This study has several policy implications. First, given the association between a child’s health literacy and their body weight, health literacy may offer a novel approach for tackling obesity problems through schools. While causal conclusions cannot be assumed in this
cross-Table 2 Distribution of BMI across different characteristics
BMI
Characteristics Normal Underweight Overweight Obese P-value1
n % n % n % n %
Health literacy (quartiles) <0.0001
Lowest 25 % (0–21) 19,580 45.47 4,954 11.50 11,051 25.66 7,477 17.36 25thto 50thpercentile (22–26) 22,971 48.01 5,276 11.03 12,110 25.31 7,491 15.66 50thto 75thpercentile (27–29) 22,190 49.45 4,847 10.80 11,403 25.41 6,434 14.34 Highest 25 % (30–32) 13,360 50.56 2,938 11.12 6,859 25.96 3,268 12.37 Sex <0.0001 Girl 42,204 53.25 10,299 13.00 18,957 23.92 7,790 9.83 Boy 35,897 43.27 7,716 9.30 22,466 27.08 16,880 20.35 Ethnicity <0.0001
Hakka, Taiwanese, and Chinese 49,357 48.59 11,156 10.98 25,761 25.36 15,301 15.06
Indigenous 2751 44.97 467 7.63 1,777 29.05 1,123 18.36
Immigrants 1440 45.58 364 11.52 816 25.83 539 17.06
Others/Unknown/Uncertain 24,553 47.81 6,028 11.74 13,069 25.45 7,707 15.01
Self-rated health status <0.0001
Bad or very bad 2351 24.15 1,127 11.58 2,486 25.53 3,772 38.74
Normal 27,917 44.98 7,028 11.32 16,493 26.57 10,631 17.13
Good 24,839 54.30 4,901 10.71 11,162 24.40 4,845 10.59
Very Good 22,994 51.49 4,959 11.10 11,282 25.26 5,422 12.14
Healthy behaviors (Regular physical activity, Sugar-sweetened beverage (SSB) intake)
<0.0001 Regular physical activity and no SSB intake 32,432 50.65 6,988 10.91 16,050 25.06 8,564 13.37
Had only one of the healthy behaviors (either regular physical activity or no SSB intake)
37,591 46.70 9,080 11.28 20,867 25.92 12,962 16.10 Had no regular physical activity and consumed SSB 8078 45.70 1,947 11.02 4,506 25.49 3,144 17.79
1
Table 3 Multinomial logistic regression model of the association between BMI and health literacy
Characteristics Relative Risk Ratio 95 % CI Robust Std. Err. z P > |z|
Underweight Group (Ref: Normal Group) Sex (Ref: Girl)
Boy 0.87 (0.84–0.90) 0.02 −7.77 <0.001
Ethnicity (Ref: Hakka, Taiwanese, and Chinese)
Indigenous 0.73 (0.66–0.81) 0.04 −6.06 <0.001
Immigrants 1.12 (1.00–1.26) 0.07 1.90 0.06
Others/Unknown/Uncertain 1.07 (1.03–1.11) 0.02 3.81 <0.001
Health literacy (quartile) (Ref: Lowest 20 %)
25thto 50thpercentile (22–26) 0.88 (0.85–0.92) 0.02 −5.53 <0.001
50thto 75thpercentile (27-29) 0.83 (0.79–0.87) 0.02 −7.98 <0.001
Highest 25 % (30–32) 0.83 (0.79–0.87) 0.02 −6.96 <0.001
Self-rated health status (Ref: Bad or very bad)
Normal 0.53 (0.49–0.58) 0.02 −16.23 <0.001
Good 0.43 (0.39–0.46) 0.02 −21.41 <0.001
Very Good 0.46 (0.43–0.50) 0.02 −19.11 <0.001
Health behaviors (Ref: Regular physical activity and no SSB intake) Had only one of the healthy behaviors (either regular physical activity or no SSB intake)
1.05 (1.01–1.09) 0.02 2.75 0.01
Had no regular physical activity and consumed SSB 0.99 (0.93–1.05) 0.03 −0.33 0.74 Overweight Group (Ref: Normal Group)
Sex (Ref: Girl)
Boy 1.49 (1.45–1.53) 0.02 30.73 <0.001
Ethnicity (Ref: Hakka, Taiwanese, and Chinese)
Indigenous 1.24 (1.17–1.32) 0.04 6.88 <0.001
Immigrants 1.03 (0.94–1.12) 0.05 0.65 0.51
Others/Unknown/Uncertain 0.98 (0.95–1.00) 0.01 −1.69 0.09
Health literacy (quartile) (Ref: Lowest 25 %)
25thto 50thpercentile (22–26) 1.01 (0.98–1.04) 0.02 0.50 0.62
50thto 75thpercentile (27–29) 1.03 (0.99–1.06) 0.02 1.59 0.11
Highest 25 % (30–32) 1.07 (1.02–1.11) 0.02 3.16 <0.001
Self-rated health status (Ref: Bad or very bad)
Normal 0.55 (0.52–0.58) 0.02 −19.66 <0.001
Good 0.41 (0.39–0.44) 0.01 −28.45 <0.001
Very Good 0.43 (0.41–0.46) 0.01 −26.63 <0.001
Health behaviors (Ref: Regular physical activity and no SSB intake) Had only one of the healthy behaviors (either regular physical activity or no SSB intake)
1.12 (1.09–1.15) 0.01 8.41 <0.001
Had no regular physical activity and consumed SSB 1.10 (1.05–1.15) 0.02 4.33 <0.001 Obese Group (Ref: Normal Group)
Sex (Ref: Girl)
sectional study, systemic health education programs aimed at improving health literacy are likely to directly impact on obesity rates. It is likely that school-based in-terventions to improve health literacy will stimulate cas-ual pathways related to physical activity and SSB intake that would in turn generate positive behavior patterns in children before adulthood.
This study had some limitations. First, due to anonym-ous data collection procedure, we are not able to identify the location of the schools. Second, while the sample size is large and a great majority of schools participated (83 %) it is possible that children from less affluent fam-ilies did not participate, therefore introducing a system-atic bias. While the direction of the bias is unknown, it is possible that our results are an underestimate of the association between health literacy and body weight in children. Due to the web-based and anonymous design of our survey, it is impossible to compare the respondents and non-respondents. However, there are no substantial differences between the non-participating schools and participating schools. It is likely that the complete picture of health literacy challenges of Taiwanese children is somewhat worse than what we report. This is because the missing cases are more likely to include those with the poorest general literacy and come from low socioeco-nomic family backgrounds. Given this, the health literacy estimates in the present study are likely to be conservative. The research may be improved in the future through face to face interviews and the collection of information on children’s and parent’s readiness to change or self-efficacy, as well as parental health literacy, demographics and so-cioeconomic status. In addition, almost a third of children did not answer the ethnicity question due to lack of
awareness of their origins. This leaves a gap in our under-standing of whether specific ethnic groups have greater health literacy needs and how this might affect obesity prevalence in Taiwan.
Conclusions
This study provides some directions for future research and policy. A longitudinal study is needed alongside a child health surveillance system. We hypothesize that the quality of health education determines health liter-acy, which in turn, influences health behavior and health risk factors such as eating habits, physical activity, and other factors such as propensity to adopt healthy behav-iors. It is possible that schools with strong health educa-tion programs may develop children with high health literacy and induce upward pressure in families and thus be a mechanism to reduce family and community obes-ity. We suggest that governments might consider apply-ing routine child health literacy tests and monitorapply-ing the development of health literacy in individuals where health education, health behaviors and health and social outcomes are tracked throughout the school years. As the obesity epidemic continues to rise in many parts of the world, new surveillance systems that monitor the impact of education and social policy are needed. The use of health literacy surveys may be a much needed ap-proach to identifying novel intervention points to reduce obesity and underweight.
Additional file
Additional file 1: Health Report (Personal hygiene). (DOC 230 kb)
Table 3 Multinomial logistic regression model of the association between BMI and health literacy (Continued)
Ethnicity (Ref: Hakka, Taiwanese, and Chinese)
Indigenous 1.32 (1.22–1.42) 0.05 7.06 <0.001
Immigrants 1.03 (0.93–1.15) 0.06 0.64 0.52
Others/Unknown/Uncertain 0.89 (0.87–0.92) 0.01 −6.65 <0.001
Health literacy (quartile) (Ref: Lowest 25 %)
25thto 50thpercentile (22–26) 1.03 (0.99–1.07) 0.02 1.31 0.19
50thto 75thpercentile (27–29) 1.01 (0.97–1.06) 0.02 0.67 0.50
Highest 25 % (30–32) 0.94 (0.89–0.99) 0.02 −2.52 0.01
Self-rated health status (Ref: Bad or very bad)
Normal 0.22 (0.21–0.24) 0.01 −50.13 <0.001
Good 0.11 (0.10–0.12) 0.00 −68.85 <0.001
Very Good 0.12 (0.11–0.13) 0.00 −66.38 <0.001
Health behaviors (Ref: Regular physical activity and no SSB intake) Had only one of the healthy behaviors (either regular physical activity or no SSB intake)
1.27 (1.23–1.31) 0.02 14.11 <0.001
Competing interests
The authors declare that they have no competing interests.
Authors’ contributions
LLL and CHL made substantial contributions to conception and design of this study. SFS and LLL drafted the manuscript. SFS, LLL, and RHO revised the manuscript. SFS and LLL made contribution to acquisition and performed the statistical analysis. All authors read and approved the final manuscript.
Acknowledgements
We would like to acknowledge the financial support from Taiwan's Ministry of Education as well as all the participating schools. Richard Osborne was funded in part through a National Health and Medical Research Council (NHMRC) Senior Research Fellowship #APP1059122.
Author details
1Department of Health Promotion and Health Education, College of
Education, National Taiwan Normal University, No. 162, Section 1, Heping East Road, Da-An District 106, Taipei, Taiwan.2Department of Health
Management, I-Shou University, No. 8, Yida Rd., Jiaosu Village, Yanchao District, Kaohsiung City 82445, Taiwan.3Deakin University Centre for
Population Health Research, School of Health and Social Development, Geelong, Victoria, Australia.
Received: 17 August 2015 Accepted: 16 February 2016
References
1. Ministry of Education (Taiwan): Taiwan Elementary and Secondary Educator Community. Grade 1–9 curriculum guidelines [In Chinese]. 2008. http://teach.eje.edu.tw/9CC2/9cc_97.php. Accessed 18 Aug 2013. 2. United Nations Economic and Social Council (ECOSOC). Health literacy and
the Millennium Development Goals: United Nations Economic and Social Council (ECOSOC) regional meeting background paper (abstracted). J Health Commun. 2010;15 Suppl 2:211–23.
3. Dodson S, Good S, Osborn R. Health literacy toolkit for low- and middle-income countries: A series of information sheets to empower communities and strengthen health systems. Delhi: World Health Organization, Regional Office for South-East Asia; 2015.
4. Kickbusch I, Wait S, Maag D. Navigating health: The role of health literacy. London: Alliance for Health and the Future, International Longevity Centre-UK; 2006. 5. Nielsen-Bohlman L, Panzer AM, Hamlin B, Kindig DA. Health Literacy: A
Prescription to End Confusion: The National Academies Press. 2004. 6. Sanders LM, Thompson VT, Wilkinson JD. Caregiver health literacy and
the use of child health services. Pediatrics. 2007;119(1):e86–92. doi:10.1542/peds.2005-1738.
7. Schmidt CO, Fahland RA, Franze M, Splieth C, Thyrian JR, Plachta-Danielzik S, Hoffmann W, Kohlmann T. Health-related behaviour, knowledge, attitudes, communication and social status in school children in Eastern Germany. Health Educ Res. 2010;25(4):542–51.
8. Wu AD, Begoray DL, Macdonald M, Wharf Higgins J, Frankish J, Kwan B, Fung W, Rootman I. Developing and evaluating a relevant and feasible instrument for measuring health literacy of Canadian high school students. Health Promot Int. 2010;25(4):444–52.
9. Mancuso JM. Assessment and measurement of health literacy: an integrative review of the literature. Nurs Health Sci. 2009;11(1):77–89. 10. Perry EL. Health literacy in adolescents: an integrative review. JSPN.
2014;19(3):210–8.
11. Sanders LM, Shaw JS, Guez G, Baur C, Rudd R. Health literacy and child health promotion: implications for research, clinical care, and public policy. Pediatrics. 2009;124 Suppl 3:S306–14.
12. DeWalt DA, Hink A. Health literacy and child health outcomes: a systematic review of the review. Pediatrics. 2009;124 Suppl 3:S265–74.
13. Vann WF Jr, Divaris K, Gizlice Z, Baker AD, Lee JY. Caregivers' health literacy and their young children's oral-health-related. J Dent Res. 2013;92(7Suppl): 55S–62S.
14. Yin HS, Johnson M, Mendelsohn AL, Abrams MA, Sanders LM, Dreyer BP. The health literacy of parents in the United States: a nationally representative study. Pediatrics. 2009;124 Suppl 3:S289–98.
15. Fredrickson DD, Washington RL, Pham N, Jackson T, Wiltshire J, Jecha LD. Reading grade levels and health behaviors of parents at child clinics. Kans Med. 1995;96(3):127–9.
16. Yin HS, Dreyer BP, Foltin G, van Schaick L, Mendelsohn AL. Association of low caregiver health literacy with reported use of nonstandardized dosing instruments and lack of knowledge of weight-based dosing. Ambu Pediatr. 2007;7(4):292–8.
17. Heerman WJ, Perrin EM, Yin HS, Sanders LM, Eden SK, Shintani A, et al. Health literacy and injury prevention behaviors among caregivers of infants. Am J Prev Med. 2014;46(5):449–56.
18. DeWalt DA, Dilling MH, Rosenthal MS, Pignone MP. Low parental literacy is associated with worse asthma care measures in children. Ambul Pediatr. 2007;7(1):25–31.
19. Ross LA, Frier BM, Kelnar CJH, Deary IJ. Child and parental mental ability and glycaemic control in children with Type 1 diabetes. Diabetic Med. 2001;18(5):364–9.
20. Sharif I, Blank AE. Relationship between child health literacy and body mass index in overweight children. Patient Educ Couns. 2010;79(1):43–8. 21. Keim-Malpass J, Letzkus LC, Kennedy C. Parent/caregiver health literacy
among children with special health care needs: a systematic review of the literature. BMC Pediatr. 2015;15:92.
22. Ministry of Health and Welfare (Taiwan): Prevalence of obesity in Taiwan [In Chinese] http://obesity.hpa.gov.tw/TC/faqContent.aspx?id=67&chk=84b32626-2bca-430c-982b-784a9b53fe69¶m=pn%3D3. Accessed 12 Dec 2015. 23. World Medical Association: WMA Declaration of Helsinki -Ethical Principles
for Medical Research Involving Human Subjects. http://www.wma.net/en/ 30publications/10policies/b3/. Accessed 12 Dec 2015.
24. Ministry of Education (Taiwan): Gender Statistics. http://english.moe.gov.tw/ ct.asp?xItem=14508&CtNode=11431&mp=1. Accessed 12 Dec 2015. 25. Bloom BS. Taxonomy of Educational Objectives, Handbook I: The Cognitive
Domain. New York: David McKay Co Inc; 1956.
26. Liu CH, Liao LL, Shih SF, Chang TC, Chi HY, Osborne RH. Development and implementation of Taiwan’s Child Health Literacy Test. Taiwan J Public Health. 2014;33(3):251–70.
27. Chu NF. Strategies for prevention and treatment of obesity among children in Taiwan. Res Sports Med. 2010;18(1):37–48.
28. Nutbeam D. Health Promotion Glossary. Health Promot Int. 1998;13(4):349–364.
• We accept pre-submission inquiries
• Our selector tool helps you to find the most relevant journal
• We provide round the clock customer support
• Convenient online submission
• Thorough peer review
• Inclusion in PubMed and all major indexing services
• Maximum visibility for your research Submit your manuscript at
www.biomedcentral.com/submit