i
國立交通大學
資訊科學與工程研究所
碩士論文
動態更新與修補溢位弱點的設計與實作
Patching Buffer Overflow Vulnerability by
Dynamically Updating Binary Software
研 究 生: 黃有德
指導教授: 黃世昆 教授
ii
動態更新與修補溢位弱點的設計與實作
Patching Buffer Overflow Vulnerability by Dynamically Updating
Binary Software
研 究 生: 黃有德 Student: Yu-Te Huang
指導教授: 黃世昆 教授 Advisor: Shih-Kun Huang
國 立 交 通 大 學
資 訊 科 學 與 工 程 研 究 所
碩 士 論 文
A Thesis
Submitted to Institute of Computer Science and Engineering College of Computer Science
National Chiao Tung University in partial Fulfillment of the Requirements
for the Degree of Master
in
Computer Science
June 2006
Hsinchu, Taiwan, Republic of China
iii
動態更新與修補溢位弱點的設計與實作
研究生: 黃有德 指導教授: 黃世昆 教授
摘要
我們無法避免程式產生錯誤,因此必須利用修補機制(Patch)進行更新。但 在一般作業系統平台,例如微軟視窗(Microsoft Windows),對程式進行更新時, 通常需將程式關閉,才能對程式進行更新。這雖然是無法避免的動作,對商業網 站的營運卻會造成巨額損失。目前已有多種軟體動態修補(Dynamic Software Updating)的研究成果,但是皆需原始碼(Source Code)的輔助。有鑑於此,我們 針對微軟視窗平台上商業軟體,在沒有原始碼可供分析的情況下,仍可進行動態 軟體修補。 為了證明修補機制的可行性,我們試行運用於溢位弱點的動態修補操作。現 存偵測溢位弱點的方法中,大都無法有效用於正在運行的伺服器上,因為偵測溢 弱點耗費時間,影響網站服務效率。我們因此利用所發展的修補機制,發展可動 態偵測軟體溢位弱點的工具,讓使用者選擇性地啟動溢位弱點偵測,供使用者在 不關閉程式的前提下,進行修補有溢位弱點的程式。透過在視窗平台上的軟體實 驗,我們可以有效地修補溢位弱點,防止惡意使用者利用此類型弱點進行攻擊。iv
Patching Buffer-Overflow Vulnerability by
Dynamic Updating Binary Software
Student: Yu-Te Huang Advisor: Shih-Kun Huang
Abstract
Programs are inherently with bugs for we can only prove their presence but not their absence. In order to maintain the quality of software and get rid of bugs, developers need to fix them and release corresponding patches. When patching the software on Microsoft Windows, we usually terminate the software first, apply related patches, and restart the system. Such a process is expensive to shutdown the system only for patching and fixing the software bugs. Much research efforts focus on dynamic software updating (DSU) with static analysis on source code. Our work, called DUBS, instead tries to develop DSU on Commercial Off-The-Shelf (COTS) software.
To prove the applicability of our binary updating mechanism, we apply DSU on Buffer overflow detection. Such techniques have been well developed but they can not be applied to server dynamically, due to their high execution overhead. We develop a tool by our binary DSU which could detect buffer overflow vulnerability dynamically. Users can optionally enable the detection mechanism and use this tool to patch the vulnerability dynamically in COTS on Microsoft Windows without stopping the program. We perform the experiment on COTS and can successfully block the attack from malicious users.
v
誌謝
首先,我要感謝我的指導教授黃世昆教授,謝謝老師這些日子以來費心的指 導,給我許多寶貴的意見,才讓這篇論文得以順利的完成。接下來要感謝博士班 的蔡昌憲學長,謝謝他常常能在我窮途末路時,給我技術上的支援。我還要謝謝 我的父母和我的女友,感謝他們給我的支持與鼓勵,最後祝福我所有的朋友同學 平安快樂。 黃有德謹誌 民國九十五年七月vi
Contents
1. INTRODUCTION ... 1 1.1. Motivation... 1 1.2. Background ... 2 1.2.1. Disassembly ... 2 1.2.2. Debugger... 31.2.3. Stack-based Buffer Overflow Attack... 4
1.2.4. Heap-based Buffer Overflow Attack ... 6
1.3. Objective ... 6
1.4. Contribution ... 7
1.5. Synopsis ... 8
2. RELATED WORK ... 9
2.1. System Call Interception Tools... 9
2.2. Dynamic Software Updating Techniques ... 9
2.3. Buffer Overflow Detection Techniques... 10
2.4. Buffer Overflow Surviving Techniques... 11
2.5. Binary Instrumentation Tools ... 12
3. RESEARCH METHOD... 14
3.1. Discovering User-Defined Functions ... 15
3.2. Building Function Indirect Table... 15
3.3. Break 5 Bytes Limitation ... 19
4. IMPLEMENTATION... 20
4.1. System Architecture... 20
4.2. Implementation of System Features... 23
4.2.1. Function SWAP ... 23
4.2.2. Function Blocking... 24
4.2.3. Function Unblocking ... 25
4.2.4. Injecting Code Before Function Prolog ... 25
4.2.5. Injecting Code After Function Epilog ... 26
4.3. Performance Improvement... 26
4.3.1. Multi-Function Indirect Table ... 26
4.3.2. Check Times Interval... 28
4.3.3. Saving Memory Space ... 29
4.4. Blocking Buffer Overflow Attacks... 30
vii
4.4.2. Analysis and Block the Critical Function ... 31
5. RESULTS AND ASSESSMENT ... 34
5.1. Buffer Overflow Attack in Serv-U 4.1 ... 34
5.1.1. Blocking Overflow Attack... 34
5.1.2. Performance Evaluation... 34
5.2. Discussions ... 36
6. CONCLUSION AND FUTURE WORK ... 38
6.1. Limitation... 38
6.1.1. Call Destination Address in Registers ... 38
6.1.2. Control Flow Logging ... 39
6.1.3. Buffer Overflow Vulnerability in Critical Function ... 39
6.2. Future Work ... 39
6.2.1. Memory Space Reallocation ... 39
6.2.2. Using Event Message Instead of Polling Method... 40
6.2.3. Code Injection with C Language ... 40
viii
List of Tables
Table 2-1: Characteristics summary table ... 12
Table 3-1: Modified sites comparison table ... 19
Table 4-1: The functionality of our tool ... 21
Table 5-1: Experiment environment ... 34
Table 5-2: Compare performance by file size... 35
Table 5-3: Comparison performance by number of files... 36
ix
List of Figures
Figure 1-1: Forward and reverse engineering process... 3
Figure 1-2: Return type and parameters of CreateProcess ... 3
Figure 1-3: Return type and parameters of DebugActiveProcess ... 4
Figure 1-4: The arrangement of the elements on the stack... 4
Figure 1-5: Stack-based buffer overflow crash example ... 5
Figure 1-6: Before buffer overflow stack content ... 5
Figure 1-7: After buffer overflow stack content ... 6
Figure 3-1: The steps of applying DUBS ... 14
Figure 3-2: (a) Function call without a function indirect table (b) Function call with a function indirect table ... 16
Figure 3-3: Using function indirect table to inject code ... 17
Figure 3-4: (a) Different function calls using different inject code (b) The same function using specified inject code ... 18
Figure 4-1: (a) The function before insert breakpoint (b) The function has been insert breakpoint ... 21
Figure 4-2: The dynamic update workflow ... 22
Figure 4-3: Re-calculate the offset between two addresses... 23
Figure 4-4: (a) Function call before SWAP (b) Function call after SWAP 24 Figure 4-5: (a) Function without being blocked (b) Function has been blocked... 25
Figure 4-6: (a) Multi-function indirect table (b) One function indirect table ... 27
Figure 4-7: (a) Multi-jump program (b) After refine the address... 28
Figure 4-8: (a) Two copy of inject code (b) One copy of inject code ... 30
Figure 4-9: Buffer overflow function in failing run ... 32
Figure 4-10: Block the buffer overflow function in failing run... 32
Figure 4-11: Buffer overflow function at intersection of working run and failing run... 33
Figure 4-12: Block critical function in failing run... 33
Figure 5-1: Performance graph by file size ... 35
1
1. INTRODUCTION
1.1. Motivation
Programs are inherently with bugs for we can only prove their presence but not their absence. In order to maintain the quality of software and get rid of bugs, developers need to fix them and release corresponding patches. Once intended and malicious users obtain the patch, the patch itself reveals important information on the vulnerable parts of the system and become a direct assistant to a cracking tool. They can observe and analyze the running behavior of the patch, and find the involved code which is vulnerability related. The observed vulnerabilities can be exploited. Microsoft chief executive Steve Ballmer also claimed that “The hacker community uses our patches as blueprints to our vulnerabilities.” [1] It is therefore commonly believed that the community already uses publicly available patches to breach the software released by the Microsoft Corp. It is vitally important to apply patches and fix the vulnerable software immediately.
When patching the software, we usually terminate the software first, apply related patches, and then restart the system again. Occasionally, it is an expensive process to shutdown the system only for patching and fixing the software bugs. For example, millions of users stay in the Amazon web site for browsing and searching interested books simultaneously. Once their software has a security bug, they want to fix it with patch. First, they must stop the services in some servers until bugs are fixed, and restart the services in these servers. If you want to enable users to continue browsing and shopping, you can use distributed systems and move the users from server A to server B; until bugs in the server A is fixed, and users are moved back to server A. Although users can continue browsing and shopping in the web sites, you cannot patch all servers in the same time. Such kind of patching strategy may leave late patched servers exposed to security threats.
2
also reduce the cost when we fix the bugs in software. Another motivation of this work is that buffer overflow detection technique is often with high overhead, even cost 250 times more than that without detection capability[2]. The cost is not acceptable. So we do not want to apply the buffer overflow detection technique for normal situations. When some functions are suspicious to be compromised by buffer overflow breaches, we dynamically apply buffer overflow detection technique to monitor suspect functions. If we find the function which has the buffer overflow breach, we can close it. The server will serve users continuously even if it suffers from buffer overflow attack.
1.2. Background
This work focuses on buffer overflow detection and protection in binary program at running time. We need many techniques to support us finishing our work. First, it is hard to know program behavior when we only having binary code so we need disassembly technique to help us know it. Second, we want to control program behavior in the running time, so we must using debugger method to support us control it. Finally, we want to detect the buffer overflow, so we introduce two types of buffer overflow attack.
1.2.1. Disassembly
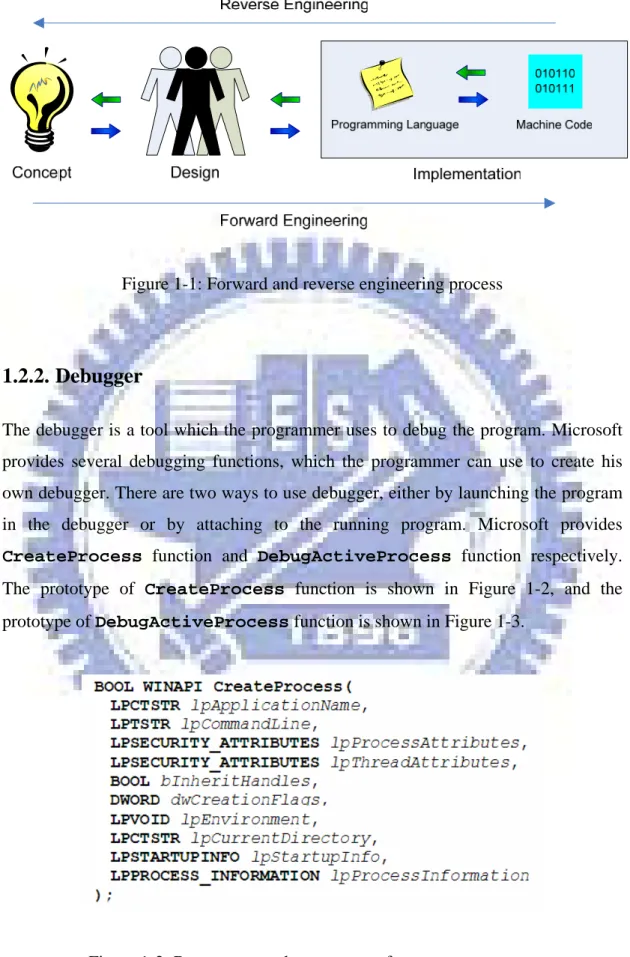
Disassembly, as part of reverse engineering, translates the machine code into the assembly language. Cheng introduced the forward and reverse engineering process [3]. As shown in Figure 1-1, forward engineering is a process from concept to design to implementation. To reverse this process is called reverse engineering.
3
Figure 1-1: Forward and reverse engineering process
1.2.2. Debugger
The debugger is a tool which the programmer uses to debug the program. Microsoft provides several debugging functions, which the programmer can use to create his own debugger. There are two ways to use debugger, either by launching the program in the debugger or by attaching to the running program. Microsoft provides
CreateProcess function and DebugActiveProcess function respectively. The prototype of CreateProcess function is shown in Figure 1-2, and the prototype of DebugActiveProcess function is shown in Figure 1-3.
4
Figure 1-3: Return type and parameters of DebugActiveProcess
1.2.3. Stack-based Buffer Overflow Attack
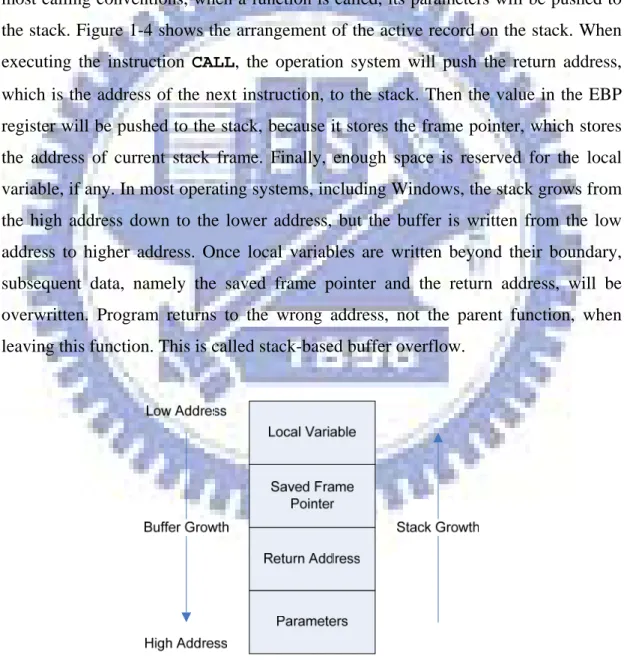
The stack-based buffer overflow often leads the program into the unexpected state. In most calling conventions, when a function is called, its parameters will be pushed to the stack. Figure 1-4 shows the arrangement of the active record on the stack. When executing the instruction CALL, the operation system will push the return address, which is the address of the next instruction, to the stack. Then the value in the EBP register will be pushed to the stack, because it stores the frame pointer, which stores the address of current stack frame. Finally, enough space is reserved for the local variable, if any. In most operating systems, including Windows, the stack grows from the high address down to the lower address, but the buffer is written from the low address to higher address. Once local variables are written beyond their boundary, subsequent data, namely the saved frame pointer and the return address, will be overwritten. Program returns to the wrong address, not the parent function, when leaving this function. This is called stack-based buffer overflow.
5
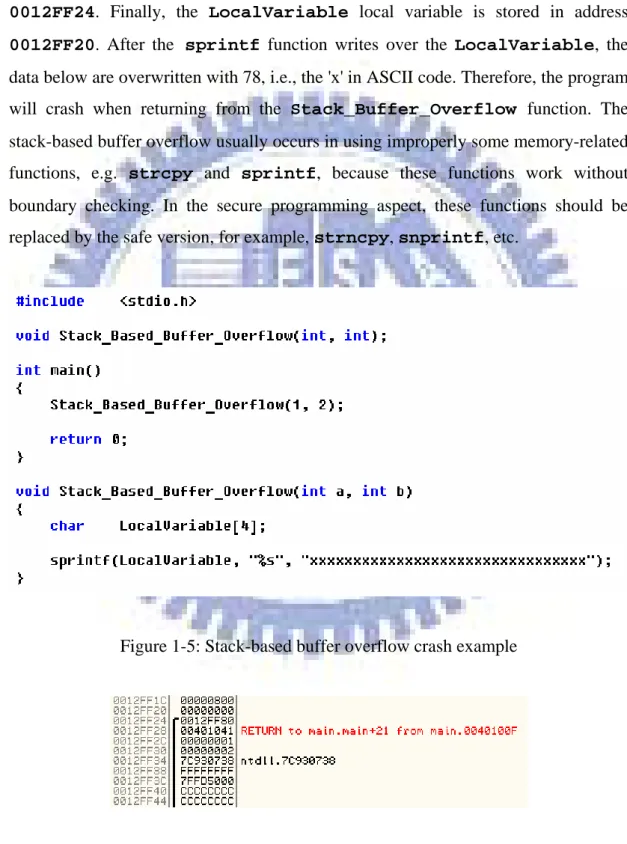
Figure 1-5 is a simple example with buffer overflow. Figure 1-6 and Figure 1-7 show contents of the stack before and after buffer overflow, respectively. The actual parameters of the Stack_Buffer_Overflow function, 1 and 2, are pushed in address 0012FF2C and address 0012FF30 in Figure 1-6 . Return address is stored in the address 0012FF28, and the previous frame pointer is stored in address
0012FF24. Finally, the LocalVariable local variable is stored in address
0012FF20. After the sprintf function writes over the LocalVariable, the data below are overwritten with 78, i.e., the 'x' in ASCII code. Therefore, the program will crash when returning from the Stack_Buffer_Overflow function. The stack-based buffer overflow usually occurs in using improperly some memory-related functions, e.g. strcpy and sprintf, because these functions work without boundary checking. In the secure programming aspect, these functions should be replaced by the safe version, for example, strncpy, snprintf, etc.
Figure 1-5: Stack-based buffer overflow crash example
6
Figure 1-7: After buffer overflow stack content
1.2.4. Heap-based Buffer Overflow Attack
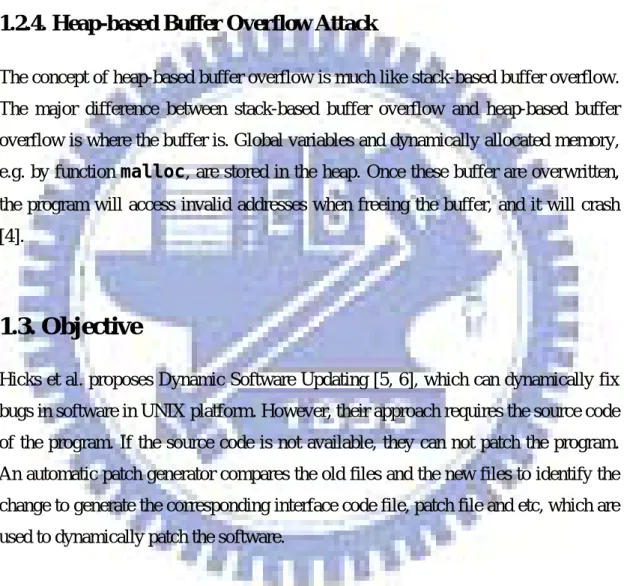
The concept of heap-based buffer overflow is much like stack-based buffer overflow. The major difference between stack-based buffer overflow and heap-based buffer overflow is where the buffer is. Global variables and dynamically allocated memory, e.g. by function malloc, are stored in the heap. Once these buffer are overwritten, the program will access invalid addresses when freeing the buffer, and it will crash [4].
1.3. Objective
Hicks et al. proposes Dynamic Software Updating [5, 6], which can dynamically fix bugs in software in UNIX platform. However, their approach requires the source code of the program. If the source code is not available, they can not patch the program. An automatic patch generator compares the old files and the new files to identify the change to generate the corresponding interface code file, patch file and etc, which are used to dynamically patch the software.
Our objective is to use the binary code of programs only and aim at buffer overflow attack, dynamically applying buffer overflow detection to monitor the function which might has buffer overflow bugs without stopping program. You can either redirect the vulnerable function to another existing function or injected machine code, or block the vulnerable function if possible
7
1.4. Contribution
Buffer overflow is a common bug in the software and usually becomes a security flaw. Malicious users can exploit the buffer overflow vulnerability of the server. There are four contributions of this work:
1. Many buffer overflow detection technique are great, but their high overhead deters wide deployment. Consideration of the reasonable overhead, our tool can support buffer overflow detection dynamically, which means that you can select some functions to monitor at running time. You do not need to monitor all functions and do not need to monitor functions from program start to end. This is an effective way to reduce the overhead compared with monitoring all functions from program start.
2. Once some functions of server software have buffer overflow vulnerabilities. But the official patch is not yet released. Our tool can close the function which has buffer overflow vulnerability in running time. It means that you do not stop the server and server will lack a few of functionality, but server can mitigate the buffer overflow attack.
3. Most instrumentation tools inject code into the program at loading time. Some tools rewrite the binary execution file before execution. Our tool can inject the machine code at loading time and running time, because other tools lost control when program running. It means that you can replace any function which you can insert machine code before function execution or after function execution in the run time. This design is very useful, therefore you can perform various operations on the target program, for example, function blocking, function unblocking, function swapping, and etc.
4. Our tool supports a logging feature, which you can use to log the function calling list of the process. It aims to log the function calling list in a working run and a failing run. Working run means that the program runs correctly. Failing run means that program will crash after the buffer overflow attack. The
8
difference between the working run and the failing run are candidates of the critical function. This feature is optional, and is disabled by default for performance.
1.5. Synopsis
In section 2, we will present related work. Section 3 describes the research method of our work. In section 4, the implementation of our work will be presented. Section 5 is experimental results, and we conclude in Section 6.
9
2. RELATED WORK
We survey some techniques and tools which are related to our work. These techniques and tools are classified according to their major functionality.
2.1. System Call Interception Tools
We use the interception technique to wrap the binary code of program. APISPY32 [7] can intercept the binary program in Windows system. The technique used in
APISPY32 is to redirect function calls in DLL by modifying the Import Address Table (IAT). After logging the function information, it jumps to the address of original target function. APISPY32 and Detours [8] have the same functionalities, but they use different techniques. The technique of the binary program interception used in Detours is that it modifies the prolog of the function, in which it inserts the
JMP instruction to get control before the function runs.
Watchd [9] also modifies the IAT in order to log the information of functions. It has something different from APISPY32. It has more functionality than
APISPY32. For example, it can perform automatic error detection and recovery, incremental data replications, IP packets re-routing, and etc. Final technique is proposed by Srouji et al. [10] They can insert checkpoints in the program. If program crashed, the tool could rollback to checkpoint without running the program again. It changes the startup routine and system calls import table. It changes the startup routing in order to insert the checkpoint into program. It changes the system calls import table in order to wrap API system call to preserve states across a checkpoint.
2.2. Dynamic Software Updating Techniques
We want to patch the program without stopping the software. The first technique is
Dynamic Software Updating (DSU) [5]. It is used in Unix-Like system, and needs source code of programs. With the old file and patched file, it could produce
10
some files and use it to patch the running software. It dynamically re-links the old module to new module. If types of data were different, it creates stub functions to convert the old data type to the new data type. It also uses stub functions as an interface between the old function and the new function. It also implements in C version [6].
The idea of Automatic Software Upgrades (ASU) [11] is similar to DSU, but ASU focuses on distributed object-oriented database, and DSU focuses on a single process program.
The final technique is JPDA Enhancements [12]. It has already been implemented in Java. It can enable programmers to fix-and-continue debugging. If programmers find some bugs in the program, they can change the source code of program and see the difference without recompilation. This technique also provides the ability which could fix bugs in running server without shutting down the running server.
2.3. Buffer Overflow Detection Techniques
We want to dynamically apply buffer overflow detection or surviving techniques in a running program. We review eight kinds of buffer overflow detection techniques and two kinds of buffer overflow surviving techniques.
StackGuard [13] is used to detect buffer overflow. It inserts canary between Return Address and Saved Frame Pointer. When leaving the function, it will check the canary. If the canary has been changed, it alerts the occurrence of buffer overflow and shutdowns the process.
ProPolice [14] differs from StackGuard in two aspects. First, it puts canary in front of Saved Frame Pointer. Because when buffer overflow occurs and overwrites the Saved Frame Pointer, the control flow of programs would be changed. When leaving the function, it will check the canary. If the canary has been changed, it reports that buffer overflow has occurred. Second, it could reorder local variables so that the function pointers are placed in the lower memory address. When buffer overflow occurs, buffer overflow would overwrite other local variables except the
11
pointer which has been moved to lower memory address. It could reduce the damage slightly when buffer overflow attack occurs.
C Range Error Detector (CRED) [15] builds a referent tree which records buffer start address and buffer size. If any instruction uses a buffer, it would check if the destination is within the buffer range, and check if the input size is small than the buffer size. If used buffer is not in referent tree, or input data size is larger than the buffer size, it would report violation of buffer overflow.
Insure++ [16] is a commercial tool from Parasoft. It instruments the source code of program. It can detect memory corruption, memory leaks, memory allocation errors, variable initialization errors, variable definition conflicts, pointer error, and etc.
Chaperon [16] is also a commercial tool from Parasoft. It is part of the Insure++. It intercepts malloc and free function calls. It could also detect memory leaks and variable initialization errors. But the limitation is that it only checks heap buffers.
Valgrind [17] is a x86 emulator, and transforms the binary code to its own format. It uses Memory Check Plug-in to check whether buffer overflow occurs or not.
CCured [18] performs the static analysis on program source code. It classifies the pointer into three kinds – SAVE, SEQ and WILD. SAVE pointers can only be dereferenced. SEQ pointers can be dereferenced and used in pointer arithmetic. WILD pointers can be dereferenced, used in pointer arithmetic and type casts. CCured applies different pointer types with different checks.
Tiny C Compiler (TinyCC) [19] is a small C compiler. It modifies the source code, and inserts the code to check buffer usage. But it can not compile large programs, such as Apache. It can not detect read overflow either.
12
There are two kinds of buffer overflow surviving techniques. Both of them can survive under the buffer overflow attacks.
Stack Shield [20] would save the return address during function prolog, and check the return address during function epilog. If two addresses are different, it reveals the violation of buffer overflow. It would terminate the program and if you want to continue running program, it could recover the original return address.
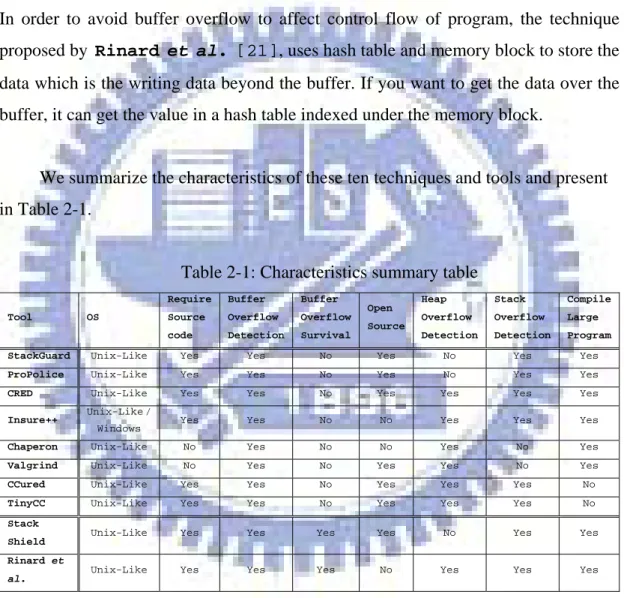
In order to avoid buffer overflow to affect control flow of program, the technique proposed by Rinard et al. [21], uses hash table and memory block to store the data which is the writing data beyond the buffer. If you want to get the data over the buffer, it can get the value in a hash table indexed under the memory block.
We summarize the characteristics of these ten techniques and tools and present in Table 2-1.
Table 2-1: Characteristics summary table
Tool OS Require Source code Buffer Overflow Detection Buffer Overflow Survival Open Source Heap Overflow Detection Stack Overflow Detection Compile Large Program StackGuard Unix-Like Yes Yes No Yes No Yes Yes
ProPolice Unix-Like Yes Yes No Yes No Yes Yes
CRED Unix-Like Yes Yes No Yes Yes Yes Yes
Insure++ Unix-Like /
Windows Yes Yes No No Yes Yes Yes
Chaperon Unix-Like No Yes No No Yes No Yes
Valgrind Unix-Like No Yes No Yes Yes No Yes
CCured Unix-Like Yes Yes No Yes Yes Yes No
TinyCC Unix-Like Yes Yes No Yes Yes Yes No
Stack Shield
Unix-Like Yes Yes Yes Yes No Yes Yes
Rinard et al.
Unix-Like Yes Yes Yes No Yes Yes Yes
2.5. Binary Instrumentation Tools
Binary instrumentation inserts the extra code into program to do some specific behavior. Binary rewriting is a technique which can rewrite and instrument binary code without source code. Etch [22] is a binary instrumentation tool, and it uses
13
binary rewriting technique to inject the code. It can not only instrument but also optimize the binary code. Vulcan [23] is also a binary instrumentation tool, and it injects the code using binary rewriting technique, but it focuses on distributed environment. Danny Nebenzahl et al. [24] use binary rewriting technique injecting the detection code into binary code to protect the program against stack smashing attacks in Windows. BCEL [25] is a binary instrumentation tool for Java bytecode.
14
3. RESEARCH METHOD
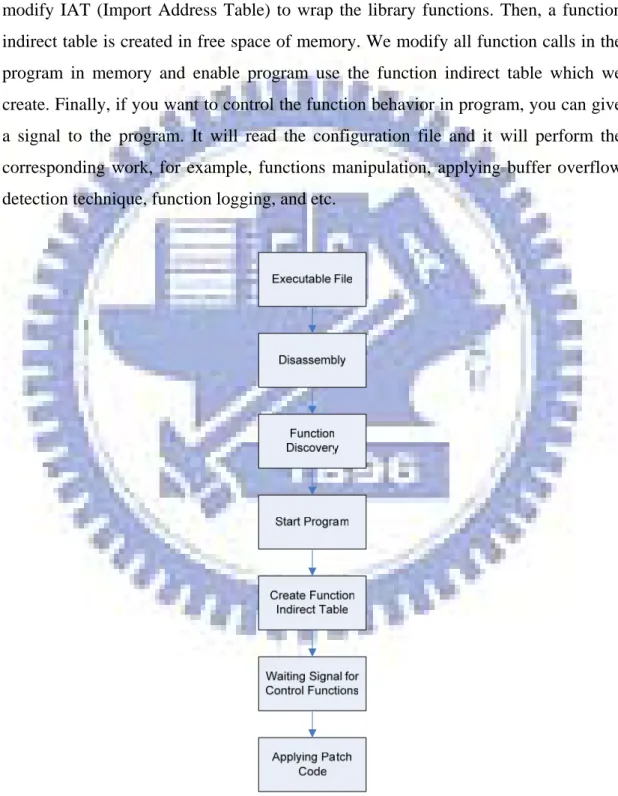
Figure 3-1 shows the steps of applying DUBS, we disassemble the binary code to find out all function entry addresses in this program. After loading the program, we modify IAT (Import Address Table) to wrap the library functions. Then, a function indirect table is created in free space of memory. We modify all function calls in the program in memory and enable program use the function indirect table which we create. Finally, if you want to control the function behavior in program, you can give a signal to the program. It will read the configuration file and it will perform the corresponding work, for example, functions manipulation, applying buffer overflow detection technique, function logging, and etc.
15
3.1. Discovering User-Defined Functions
There are two types of functions in a program. One is existing library functions, and the other is user defined functions. Library functions will show in executable file, but user defined functions will not. APISPY32 can modify the IAT. Once the API function name in executable file is match the function name in IAT and it would be wrapped by APISPY32. We use debugger tool to get the disassembly content from binary files and do static analysis only. We collect all destination address of CALL from disassembly files because functions almost be called by CALL instruction. Static analysis may not detect all functions which user defined, because some destination address of CALL instruction are stored in registers. We do not know the value which has been stored in register until the program starts to run.
3.2. Building Function Indirect Table
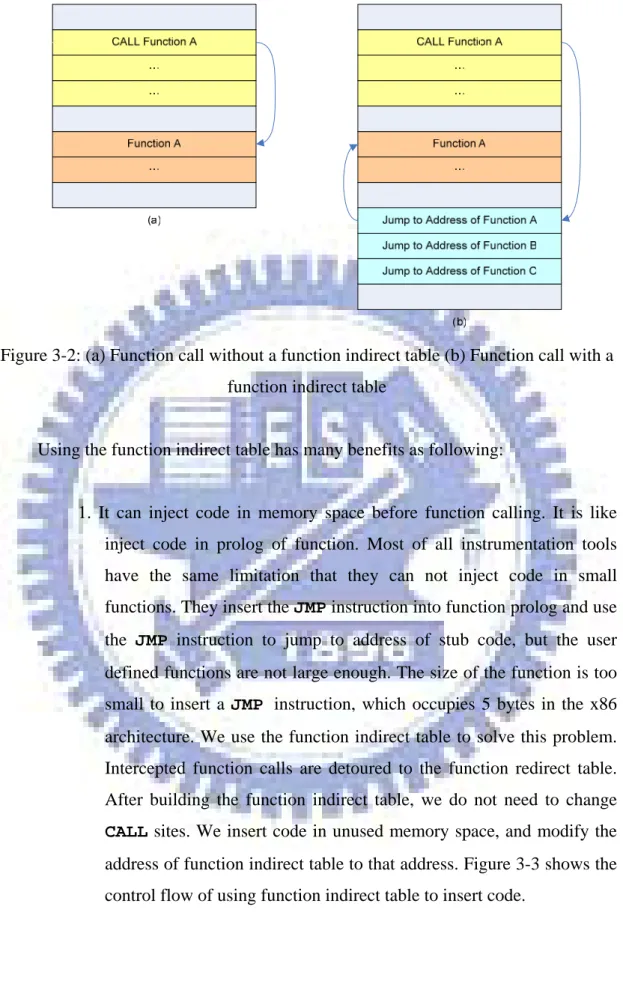
Function indirect table is a medium between CALL instruction and target functions. Figure 3-2 (a) shows the original program. The line with arrow represents the control transfer with a CALL or a JMP. Figure 3-2 (b) shows the program with function indirect table. Function indirect table stores a lot of JMP instructions. Every intercepted function has an entry in function indirect table. The target address of every intercepted function call is replaced with the address of its corresponding entry in the table; the entry is a JMP instruction that jumps to the address of the intercepted function. In this way, a intercepted function is invoked via the function indirect table.
16
Figure 3-2: (a) Function call without a function indirect table (b) Function call with a function indirect table
Using the function indirect table has many benefits as following:
1. It can inject code in memory space before function calling. It is like inject code in prolog of function. Most of all instrumentation tools have the same limitation that they can not inject code in small functions. They insert the JMP instruction into function prolog and use the JMP instruction to jump to address of stub code, but the user defined functions are not large enough. The size of the function is too small to insert a JMP instruction, which occupies 5 bytes in the x86 architecture. We use the function indirect table to solve this problem. Intercepted function calls are detoured to the function redirect table. After building the function indirect table, we do not need to change
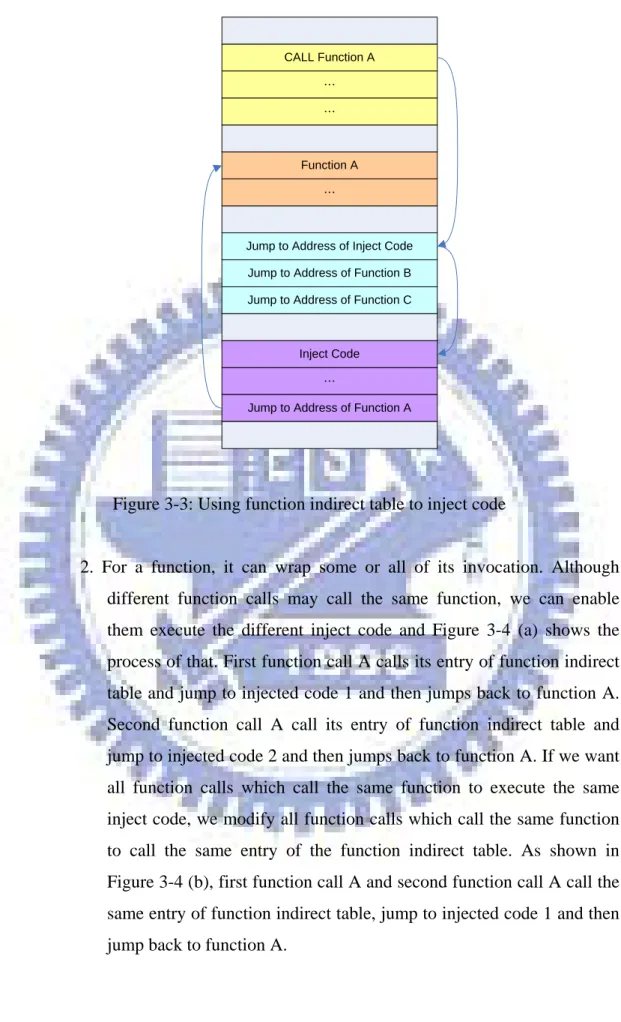
CALL sites. We insert code in unused memory space, and modify the address of function indirect table to that address. Figure 3-3 shows the control flow of using function indirect table to insert code.
17
CALL Function A
Function A …
Jump to Address of Inject Code Jump to Address of Function B Jump to Address of Function C
… …
Inject Code …
Jump to Address of Function A
Figure 3-3: Using function indirect table to inject code
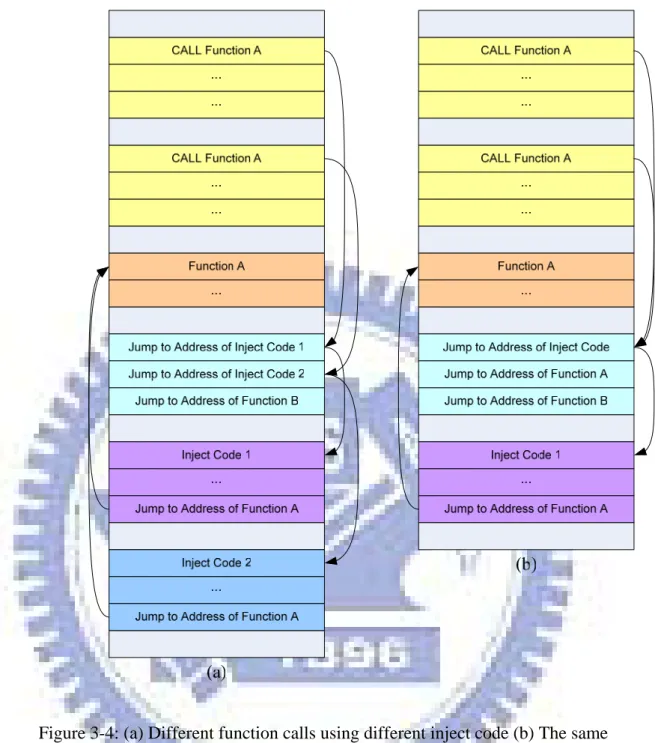
2. For a function, it can wrap some or all of its invocation. Although different function calls may call the same function, we can enable them execute the different inject code and Figure 3-4 (a) shows the process of that. First function call A calls its entry of function indirect table and jump to injected code 1 and then jumps back to function A. Second function call A call its entry of function indirect table and jump to injected code 2 and then jumps back to function A. If we want all function calls which call the same function to execute the same inject code, we modify all function calls which call the same function to call the same entry of the function indirect table. As shown in Figure 3-4 (b), first function call A and second function call A call the same entry of function indirect table, jump to injected code 1 and then jump back to function A.
18
Figure 3-4: (a) Different function calls using different inject code (b) The same function using specified inject code
3. It is easy to manage with function indirect table. If we want to control function behavior, we can modify the function indirect table easily. For example, we can modify all function calls which call the same function to call the same entry of function indirect table. If we want to redirect these function calls to another function, we can replace the entry of function indirect table with another function without modifying every function calls.
19
Modifying the different sites has the different advantage and drawback. We compare with modify different sites and list them in 錯誤! 找不到參照來源。.
Table 3-1: Modified sites comparison table Modified Site Need Extra Memory Instrument Small Function Reduce Performance Specify Function Call Instrument Whole Function Instrument Easy to Management
CALL Site No Yes No Yes No No Function Prolog No No No No Yes No Using Function Indirect Table
Yes Yes Yes Yes Yes Yes
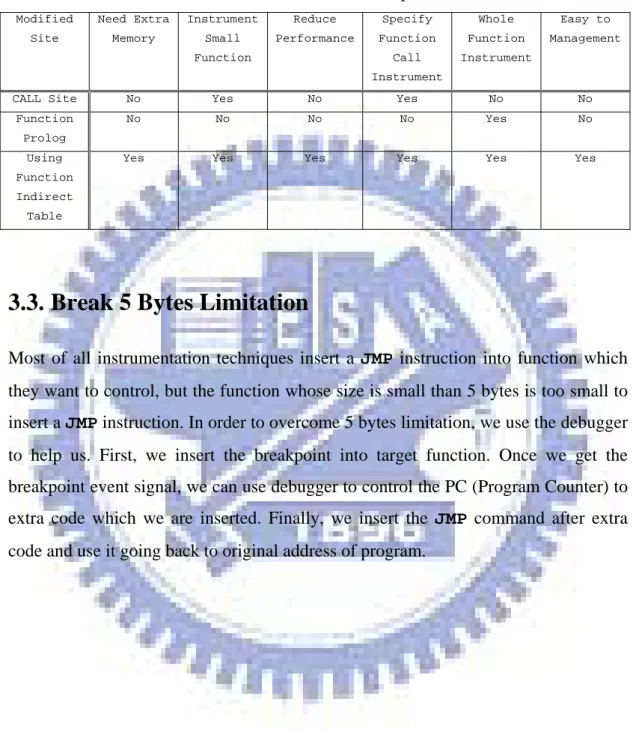
3.3. Break 5 Bytes Limitation
Most of all instrumentation techniques insert a JMP instruction into function which they want to control, but the function whose size is small than 5 bytes is too small to insert a JMP instruction. In order to overcome 5 bytes limitation, we use the debugger to help us. First, we insert the breakpoint into target function. Once we get the breakpoint event signal, we can use debugger to control the PC (Program Counter) to extra code which we are inserted. Finally, we insert the JMP command after extra code and use it going back to original address of program.
20
4. IMPLEMENTATION
We implement a tool to help users to detect the buffer overflow vulnerability and to protect their server from malicious users. We will explain the system architecture, implementation and performance improvement in this section.
4.1. System Architecture
This work focuses on binary software so we need a disassembly tool to help us disassembling the binary code. We choose OllyDbg to help us to disassemble the binary code, and to find the user defined functions. If the PDB (Portable Database) file is available, we can show the function names from disassembly files rather than the numeric address. Our tool bases on APISPY32 which is used to wrap the library function. We write a more friendly and useful GUI to wrap the APISPY32, so you may not feel APISPY32 existing. When a program is loading we modify the program in memory and insert function indirect table into it. We must re-calculate the offset of function calls, when building function indirect table. Our working environment is Microsoft Windows on Intel x86. 0xCC is a breakpoint code of machine code. We use polling method to check if the signal file exists, so we modify the first byte in prolog of functions to 0xCC, and we must backup the value which we overwrite. Figure 4-1 (a) shows the original function without inserting breakpoint and Figure 4-1 (b) shows that the first byte of prolog has been modified by a breakpoint. We will receive the EXCEPTION_BREAKPOINT when program runs the 0xCC. Once we get the EXCEPTION_BREAKPOINT event, we check if the signal file exists. If it exists, it means that we want to control the behavior of function right now. Our tool will read the setting in configuration file and patch file. According to the setting in the configuration file, it runs the corresponding work. Our tool supports much functionality to control function behavior. We list them in Table 4-1 and show the workflow of our system in Figure 4-2.
21
Figure 4-1: (a) The function before insert breakpoint (b) The function has been insert breakpoint
Table 4-1: The functionality of our tool
Functionality Action
SWAP It can swap functionality of two functions.
Block
It can block functionality of function. It means that the functions which have been
block will do nothing.
Unblock It can restore the functionality of functions which have been block.
Inject - Before
To inject the machine code before specific function running. It is like injecting machine code into the prolog of the function.
Inject - After
To inject the machine code after specific function running. It is like injecting machine code into the epilog of the function.
22
23
4.2. Implementation of System Features
Out tool supports many functionality of interaction with functions of program. We list and explain the implementation details of our tool.
4.2.1. Function SWAP
This is an interesting functionality. It can swap functionality between two functions. We can implement this functionality easily with function indirect table. Look the Figure 4-4 (a) and Figure 4-4 (b) first. We want to swap two instructions which are CALL Function A instruction and CALL Function B instruction. It is a trivial idea of that we can swap the content in the function indirect table but it does not work. We find that the argument of a JMP instruction is relative offset, not an absolute address. If we want to do function swap, we must re-calculate the offset respectively. We show the re-calculate the offset function in Figure 4-3.
24
Figure 4-4: (a) Function call before SWAP (b) Function call after SWAP
4.2.2. Function Blocking
Function blocking is a useful functionality for blocking buffer overflow attack. Most of functions use 0xC3 (RETN) to return, but some functions do not. They use return type are 0xC20400 (RETN 4), 0xC20800 (RETN 8), 0xC20100 (RETN 10) or etc. We must check the target function and get the return type before block the function. Figure 4-5 (a) shows the original function without being blocked. Figure 4-5 (b) shows that the entry of function indirect table has been overwrite to RETN. Once function call A occurs, it will jump to RETN and return immediately. We overwrite function indirect table only, without modifying the function call and function.
25
CALL Function A
Function A …
Jump to Address of Function A Jump to Address of Function B Jump to Address of Function C
… … (a) (b) CALL Function A Function A … RETN
Jump to Address of Function B Jump to Address of Function C
… …
RETN RETN
Figure 4-5: (a) Function without being blocked (b) Function has been blocked
4.2.3. Function Unblocking
Sometimes, you try to use function blocking to block some functions which you think that they might have buffer overflow vulnerability. When the function has been blocked, the only way to re-activate it is using function unblocking. Function unblocking is used to restore the functionality of function which has been blocked. We can restore the values to function indirect table for restoring functionality of functions.
4.2.4. Injecting Code Before Function Prolog
It is the same as Figure 3-3. We inject the machine code in unused memory of program and modify the indirect table address which is re-calculated the offset from function indirect table to unused memory. We do not need to modify the function call and the prolog of function.
26
4.2.5. Injecting Code After Function Epilog
Injecting machine code after function running is much different from before running. The small function means that its size is less than 5 bytes. We can not inject a JMP instruction into a small function, because a JMP occupies 5 bytes. Many tools suffer the same problem, and they can not solve this problem. We use debugger to help us solving this problem. We list the steps as following:
1. Overwrite the function return with a breakpoint. Most of all cases are to overwrite 0xC3 with 0xCC or 0xC2 with 0xCC. We assume that the address of function return is address A.
2. Inject the instrumentation code into unused memory of program and inject a return instruction which is the original value of address A after that. We assume that the address of instrumentation code is the address B.
3. To set the EIP of program to address B, when we receiving the
EXCEPTION_BREAKPOINT event and the address of breakpoint is address A. Enable the program run continually.
4.3. Performance Improvement
We design many methods to improve performance. It might reduce the overhead or memory footprint.
4.3.1. Multi-Function Indirect Table
Sometimes a program uses the function indirect table by itself. If we inject function indirect table again, it has two function indirect tables. We find all addresses of calls and check them to see if they are JMP instruction or not. If the instruction is a JMP, we use the target address of JMP to replace the address of CALL. Figure 4-6 (a) shows the original program with its own function indirect table and our function indirect table. Figure 4-6 (b) shows that our function indirect table replaces the
27
original function indirect table. If there are multi-jump in a program, we use the same method to solve it. We replace the address in function indirect table with the final address of JMP. Figure 4-7 (a) shows that function call A must go through three indirect jumps. If function call A is usually used, it has high overhead. Figure 4-7 (b) shows that we will find the final destination address to replace the entry address in function indirect table. It can reduce some overhead when solving multi-jump problem.
28
Figure 4-7: (a) Multi-jump program (b) After refine the address
4.3.2. Check Times Interval
Our tool uses pooling method to check if the signal file exists. We insert breakpoints in prolog of functions. We receive the EXCEPTION_BREAKPOINT when program reaches a breakpoint. Once we get the EXCEPTION_BREAKPOINT event, we check if the signal file exists. The signal file does not exist most of the time. It has a high overhead, so our tool counts the number of times when we get the
EXCEPTION_BREAKPOINT event. Our tool sets a number dynamically for interval. If the number which our tool counts is small than the number of interval, our tool will do nothing and let the program continue. If the number which our tool counts is equal to the number of interval, our tool will check the signal file to see if it exists and reset the number of our tool counts to zero. Our tool always checks the signal file more than one time in one second. It will change the number of interval dynamically and let itself check the signal file every two seconds. Using this method can reduce some
29
overhead with polling method.
4.3.3. Saving Memory Space
Sometimes, you may want to inject the same instrumentation code into different function. We can wrap it to a function and they need only one copy. Figure 4-8 (a) shows that function call A and function call B are using the same instrumentation code before call function A and function B. It uses two copy of the same instrumentation code. Figure 4-8 (b) shows that the result of using our method. We add function calls for function call A and function call B, and modify the entry of function indirect table to jump to them. Finally, we use function calls which we added to call instrumentation code.
30
CALL Function A
Function A …
Jump to Address of Inject Code Jump to Address of Inject Code Jump to Address of Function C
… …
Inject Code …
Jump to Address of Function A CALL Function B
… …
Inject Code …
Jump to Address of Function B
(a) Function B … CALL Function A Function A …
Jump to Address of Saving A Jump to Address of Saving B Jump to Address of Function C
… … Inject Code … RETN CALL Function B … … (b) Function B …
Call Inject Code Jump to Address of Function A
Call Inject Code Jump to Address of Function B
Figure 4-8: (a) Two copy of inject code (b) One copy of inject code
4.4. Blocking Buffer Overflow Attacks
Buffer overflow attacks are a serious and dangerous problem. In this section, we introduce the buffer overflow detection and how to block buffer overflow attack by using our tool.
31
4.4.1. Detection of Buffer Overflow
We apply the idea of StackGuard to implement a buffer overflow detection. This technique is something different from StackGuard. First, StackGuard needs source code to instrument, but we need not. Second, StackGuard monitors all function at program starting, but we can monitor specific functions which we select at run time. It can reduce much overhead compared with StackGuard.
4.4.2. Analysis and Block the Critical Function
We want to block the buffer overflow attack, so we must know which function has buffer overflow vulnerability. We can use buffer overflow detection technique to find which function has buffer overflow vulnerability. In our tool, we apply the technique of StackGuard. When we find out the function which might be vulnerable to buffer overflow attack, we can stop it by using function blocking. We can see Figure 4-9 which is a control flow graph, the line with arrow represents the call sequence when program running. Working run means that program run correctly and all the functions which program has been passed. Function 1, 2, 3, 4 and 7 are in the working run. Failing run means that program will crash after buffer overflow attack, and all the functions which program has been passed. Function 1, 2, 5, 6 and 7 are in the failing run, and we can see that working run and failing run both call Function 7. In Figure 4-9, we assume that Function 6 has been found buffer overflow vulnerability. We block Function 6 and prevent server from crashing after buffer overflow attack, see Figure 4-10.
32
Figure 4-9: Buffer overflow function in failing run
Figure 4-10: Block the buffer overflow function in failing run
Sometimes, you will find that a function which has buffer overflow vulnerability is at intersection of working run and failing run. See Figure 4-11, we assume that Function 7 has buffer overflow vulnerability and it is in the intersection of working run and failing run. If we block Function 7, it might affect the behavior of working run. Our tool can log the function calling list, and we want to find the candidates of critical function. We define critical functions are the predecessor of buffer overflow and there are no relationship between critical functions and working run. The candidate of critical functions will be found easily, we can find the functions in failing run but they are not in working run. In Figure 4-11, we know Function 5 and Function 6 are candidates of critical functions. We try to block Function 5 or
33
Function 6 to prevent server from crashing after buffer overflow attack and it shows in Figure 4-12.
Figure 4-11: Buffer overflow function at intersection of working run and failing run
34
5. RESULTS AND ASSESSMENT
We use our tool to protect the software which has buffer overflow vulnerability. Our experimental environment is shown in Table 5-1.
Table 5-1: Experiment environment
Device Description CPU Intel Pentium 4 CPU 3.40 GHz
Memory 1 GB
Operation System
Microsoft Windows XP SP2
5.1. Buffer Overflow Attack in Serv-U 4.1
Serv-U 4.1 has a buffer overflow vulnerability. Malicious users can use the bug of MDTM command to exploit the Serv-U 4.1.
5.1.1. Blocking Overflow Attack
We use our tool to detect buffer overflow in the Serv-U. We find that function whose address is 0x00683A88 has the buffer overflow vulnerability. We use logging functionality by our tool and find the control flow of Serv-U.
5.1.2. Performance Evaluation
We instrument the Serv-U with dynamic update functionality. We evaluate the performance of original program, and compare it with DUBS. Table 5-2 shows the performance by getting and putting many files with different size, and Figure 5-1 shows the performance graph. Blue line represents the original Serv-U and pink line
35
represents the Serv-U applying DUBS. We also provide another performance evaluation. Table 5-3 shows the performance by getting and putting many files whose size are 1K bytes and Figure 5-2 also represents it as a performance graph. We can see that Serv-U has little overhead when applying DUBS.
Table 5-2: Compare performance by file size
Series Operation Original With DUBS Slowdown 1 Get 1 MB File 1.8 sec 1.8 sec 0 % 2 Get 10 MB File 5.6 sec 5.8 sec 3.6 % 3 Get 100MB File 42 sec 43 sec 2.4 % 4 Put 1 MB File 2 sec 2 sec 0 % 5 Put 10 MB File 4.4 sec 4.6 sec 4.5 % 6 Put 100 MB File 32 sec 32.4 sec 1.3 %
Average 2 % 0 10 20 30 40 50 1 2 3 4 5 6 Series S ec onds Original With DUBS
36
Table 5-3: Comparison performance by number of files
Series Operation Original With DUBS Slowdown 1 Get 10 Files 2.6 sec 2.6 sec 0 % 2 Get 100 Files 17 sec 17.4 sec 2.4 % 3 Get 1000 Files 155 sec 169 sec 9.0 % 4 Put 10 Files 2.4 sec 2.4 sec 0 % 5 Put 100 Files 15.6 sec 16.2 sec 3.8 % 6 Put 1000 Files 144 sec 146 sec 1.4 %
Average 2.8 % 0 50 100 150 200 1 2 3 4 5 6 Series S ec onds Original With DUBS
Figure 5-2: Performance graph by number of files
5.2. Discussions
Our tool uses polling method in order to get the control of program. The problem of polling method is high overhead. We apply the DUBS on Serv-U 4.1 and we find that maximal overhead is 9.0 percent. Although it costs 9.0 percent overhead but it has a dynamic updating feature. We can control the function behavior and detect the buffer overflow vulnerability dynamically by this feature. Once buffer overflow
37
vulnerability immediately. The 9.0 percent overhead compares to system crash is little.
We also do some evaluation on Serv-U 4.1. The match rate of control flow finding in Serv-U 4.1 is 98%, and Serv-U produces 8 threads when it is running. Building function indirect table in Serv-U 4.1 needs 38 seconds because Serv-U has 26657 user defined functions.
38
6. CONCLUSION AND FUTURE WORK
We develop a tool, called DUBS, to protect COTS software and prevent malicious users from attacking the system. COTS software would crash when you use DUBS to protect the software at first attack. After first attacking, you would enable the detection and protection features in DUBS. Using DUBS, you can optionally enable the detection of buffer overflow vulnerability, by blocking the function with overflow vulnerability. This tool can also act as a better binary instrumentation tool, because it can instrument machine code into running program. The comparison of binary instrument tools is listed on Table 6-1. It also supports the feature which can change the behavior of functions.
Table 6-1: Binary instrumentation tools comparison table
Break 5 Bytes Small Function Detecting User Define Function Detecting User Define Function with Indirect Tables Instrument DLL Instrument Timing Handle Multithread Application Inject Machine Code in Running Time Block or Active User Define Function in Running Time Detours No No No Yes Loading Time Yes No No Danny Nebenzahl et al. No Yes
(IDA Pro) No Yes Rewrite
Binary File Yes No No
Vulcan No Yes Yes Yes
Rewrite Binary File or Loading Time Yes No No Etch No No No No Rewrite
Binary File Yes No No
Dynamic Updating Binary Software
Yes Yes
(OllyDBG) Yes Yes Loading
Time Yes Yes Yes
6.1. Limitation
Our work has some limitations, and we show them as follows.
39
Our tool can not control the function which is called by registers in order to control the function whose size is small than 5 bytes. Most of all instrumentation techniques insert a JMP instruction into function prolog. They will face the 5 bytes limitation problem, because JMP occupies 5 bytes.
6.1.2. Control Flow Logging
We find the user define functions and inject the breakpoint in the function prolog and epilog. We can log the control flow by receiving the debug event
EXCEPTION_BREAKPOINT. We find that the number of function call is more than function return when program logging finished. Because we can not inject the monitor code in function epilog in DLL files.
6.1.3. Buffer Overflow Vulnerability in Critical Function
We can block the function which has the buffer overflow vulnerability. But there is a condition. The function which we are blocked must be in the failing run and not in passing run. If you block the function which is in pass run, the right action might become wrong action. Robot FTP also has buffer overflow vulnerability, it occurs in
USER command. We can not protect the Robot FTP because its passing run and failing run are the same.
6.2. Future Work
6.2.1. Memory Space Reallocation
Scarce memory space is a big problem to us, because we need memory to create function indirect table and place the instrumentation code. We can use binary rewriting technique to enlarge the memory space.
40
6.2.2. Using Event Message Instead of Polling Method
Our tool uses polling method to get the control of program. It must do context switch when breakpoint occurs. It costs high overhead when doing context switch. Microsoft Windows supports message which is like the signal in Unix-like system and it can communicate two individual programs.
6.2.3. Code Injection with C Language
Our tool can let users inject the code into running program. It supports injecting the machine code now. If you want to inject C language code, you must compile the C language code first before injecting it, but it has many limitations. For example, you must re-calculate the offset of function which in the library.
41
REFERENCES
[1] Steve Ranger, "Microsoft faces up to security threat," Computing,
Http://www.Computing.Co.uk/vnunet/news/2123457/microsoft-Faces-Security-Threat,
[2] Michael Zhivich, Tim Leek and Richard Lippmann, "Dynamic Buffer Overflow Detection," Workshop on the Evaluation of Software Defect Detection Tools, June. 2005.
[3] Gerald C. Gannod and Betty H.C. Cheng, "Strongest Postcondition Semantics as the Formal Basis forReverse Engineering," Proceedings of the Second
Working Conference on Reverse Engineering, July. 1995.
[4] Anonymous "Once upon a free()," Http://www.Phrack.org/phrack/57/p57-0x09, [5] M. Hicks, J. T. Moore and S. Nettles, "Dynamic software updating," in PLDI '01:
Proceedings of the ACM SIGPLAN 2001 Conference on Programming Language Design and Implementation, 2001, pp. 13-23.
[6] Michael Hicks, "Practical Dynamic Software Updating for C," November. 2005. [7] Matt Pietrek, Windows 95 System Programming SECRETS. IDG Books, 1995, [8] Galen Hunt and Doug Brubacher, "Detours: Binary Interception of Win32
Functions," Proceedings of the 3rd USENIX Windows NT Symposium, July. 1999.
[9] Yennun Huang, P. Emerald Chung and Chandra Kintala, "NT-SwiFT: Software Implemented Fault Tolerance on Windows NT," Journal of Systems and
Software, November. 2002.
[10] Johny Srouji, Paul Schuster, Maury Bach and Yulik Kuzmin, "A Transparent Checkpoint Facility On NT," Proceedings of the 2nd USENIX Windows NT
Symposium, August. 1998.
[11] Programming Methodology Group, "Automatic Software Upgrades,"
Http://pmg.Lcs.Mit.edu/upgrades/,
[12] I. Sun Microsystems, "JPDA Enhancements,"
Http://java.Sun.com/j2se/1.4.2/docs/guide/jpda/enhancements.Html,
[13] Crispan Cowan, Calton Pu, Dave Maier, Jonathan Walpole, Peat Bakke, Steve Beattie, Aaron Grier, Perry Wagle and Qian Zhang, "StackGuard: Automatic Adaptive Detection and Prevention of Buffer-Overflow Attacks," Proceedings
of 7th USENIX Security Conference, pp. 63-78, January. 1998.
[14] Hiroaki Etoh and Kunikazu Yoda, "Protecting from stack-smashing attacks,"
42
[15] Olatunji Ruwase and Monica S. Lam, "A Practical Dynamic Buffer Overflow Detector," Proceedings of the 11th Annual Network and Distributed System
Security Symposium, February. 2004.
[16] Anonymous "Parasoft. Insure++: Automatic runtime error detection,"
Http://www.Parasoft.Com,
[17] N. N. Julian Seward and J. Fitzhardinge, "Valgrind: A GPL’d system for debugging and profiling x86-linux programs," Http://valgrind.Kde.Org, [18] George C. Necula, Scott McPeak and Westley Weimer, "CCured: Type-Safe Retrofitting of Legacy Code," Proceedings of Symposium on Principles of
Programming Languages, pp. 128-139, 2002.
[19] F. Bellard, "TCC: Tiny C compiler," October. 2003.
[20] Anonymous "A "stack smashing" technique protection tool for Linux,"
Http://www.Angelfire.com/sk/stackshield/,
[21] Martin Rinard, Cristian Cadar, Daniel Dumitran, Daniel M. Roy and Tudor Leu, "A Dynamic Technique for Eliminating Buffer Overflow Vulnerabilities (and Other Memory Errors)," ACSAC, December. 2004.
[22] Ted Romer, Geoff Voelker, Dennis Lee, Alec Wolman, Wayne Wong, Hank Levy and Brian Bershad, "Instrumentation and Optimization of Win32/Intel Executables Using Etch," Proceedings of the USENIX Windows NT Workshop, August. 1997.
[23] Amitabh Srivastava, Andrew Edwards and Hoi Vo, "Vulcan: Binary transformantion in a distributed environment," Techical Report
MSR-TR-2001-50, 2001.
[24] Danny Nebenzahl, Mooly Sagiv and Avishai Wool, "Install-Time Vaccination of Windows Executables to Defend against Stack Smashing Attacks," IEEE
Transactions on Dependable and Secure Computing, vol. 3, pp. 78-90,
January-March. 2006.
[25] The Apache Jakarta Project, "BCEL: Byte Code Engineering Library," October. 2001.