國 立 交 通 大 學
電控工程研究所
碩士論文
應用於標記部份遮蔽或不均衡光線環境之可調動閥值擴增實
境系統
STAR: A Selectable Thresholding Augmented Reality System for
Occluded Markers and Unbalanced Lights
研 究 生: 吳嘉稘
Student: Chia-Chi, Wu
指導教授:黃育綸 博士
Advisor: Dr. Yu-Lun Huang
中華民國九十九年七月
應用於標記部份遮蔽或不均衡光線環境之可調動閥值擴增實境系統
STAR: A Selectable Thresholding Augmented Reality System for Occluded
Markers and Unbalanced Lights
研 究 生: 吳嘉稘 Student: Chia-Chi, Wu 指導教授:黃育綸 博士 Advisor: Dr. Yu-Lun Huang
國 立 交 通 大 學 電控工程研究所
碩士論文
A Thesis
Submitted to Institute of Elcetrical Control Engineering College of Electrical Engineering
National Chiao Tung University in partial Fulfill of the Requirements
for the Degree of Master
in
Institute of Elcetrical Control Engineering July, 2010
Hsinchu, Taiwan, Republic of China 中華民國九十九年七月
應用於標記部份遮蔽或不均衡光線環境之
可調動閥值擴增實境系統
學生: 吳嘉稘
指導教授:黃育綸 博士
國 立 交 通 大 學電控工程研究所(研究所)碩士班
摘
要
擴增實境(Augmented Reality, AR)是一種新興的人機互動技術,可以即時的將虛擬物件 與實際的影像作結合。其中,多數AR系統使用標記(Planar markers)來判斷疊加虛擬物 件所需的角度與位置。但是,這些標記會因為不穩定的光線環境,或是因為部分的區 域被物體遮蔽,讓系統無法找到標記的正確位置。
在本篇論文之中,我們提出了兩種方式:動態廣域閥值(Dynamic global threshold) 以及適應性閥值(Adaptive threshold)來偵測不穩定光線下的標記。使用者可以依據自 己的需要,使用其中一種方式來偵測標記。另外,我們設計新的方形偵測法,使用邊 界重建(Boundary reconstruction)來重建被部份遮蔽的邊界。接著,我們使用部份模板 匹配(Partial pattern matching)演算法,提昇偵測部份遮蔽標記的穩定度。最後,透過 一連串的實驗,證實我們的系統能在不穩定的光線環境下或是在標記被遮蔽的狀況下 得到較好的偵測結果。相較現有的AR系統,我們的方法在兩倍亮度環境下或當標記的 遮蔽面積達到1/3時,仍可以偵測到該標記。
STAR: A Selectable Thresholding Augmented Reality System
for Occluded Markers and Unbalanced Lights
Student: Chia-Chi, Wu
Advisor: Dr. Yu-Lun Huang
Institute of Elcetrical Control Engineering
National Chiao Tung University
Abstract
Augmented Reality (AR) is a new human-computer interaction technology which exactly overlays physical image with the virtual objects in real time. Most AR systems use planar markers providing the positions and the angles information to correctly merge the visual objects. However, planar markers are difficult to detect under unbalanced light conditions or while the markers are partially occluded.
In this paper, we propose two methods, dynamic thresholding and adaptive thresholding, to cope with the marker detection under an unbalanced light environment. With the proposed methods, a user can select a proper one to get a better result according to users' requirements and purposes. We also propose new designed quadrangle detection and rebuild the boundaries of occluded markers by reconstructing boundaries, then applying partial pattern matching algorithms. Such a design improves the stability of maker detection when the marker is partially occluded. In the end of the paper, we conduct a series of experiments to demonstrate that our methods have better detection results in an unbalanced light environment or when the marker is partially occluded. Compared to the existing AR toolkits, the results show that the proposed methods can detect markers under double brighter conditions or when a marker is at most 1/3 occluded.
誌謝
我能完成這篇論文,首先要感謝黃育綸教授的細心指導。在我失去研究方向的時 候,總是能夠給我一盞指引的明燈。就算最近身體微恙,在修養期間,還是幫我修改 了論文中許多的錯誤。真的很感謝老師,也希望老師的身體能早日康復。 再來就要感謝曾勁源學長,每每接受我任性的要求,並且提供許多有用的資料。 要不是學長當時的提點,我可能就沒辦法做出這篇論文。蔡欣宜學姐與陳柏廷學長, 他們總是耐心的回答我的問題。還有洪精佑學長,要不是你跟我介紹AR,我可能就無 法接觸這麼有趣的領域了。另外就是跟我一起奮鬥、一起討論的澎哥,加油!RTES影 像組就靠你啦。當然還有實驗室的大家,一同創造出這個輕鬆的研究環境,讓我回想 碩二的這一年,除了單調的作實驗與寫論文之外,還多了許多有趣的回憶,讓我的研 究生活更為精彩。最後就是感謝家人與朋友們的支持,我也希望能不負眾望,在將來 會有更好的表現。Contents
摘要 i Abstract ii 誌謝 iii Table of Contents iv List of Figures vi Chapter 1 Introduction 1 1.1 Augmented Reality . . . 1 1.2 Contributions . . . 3 1.3 Organizations . . . 3 Chapter 2 Background 4 2.1 Planar Marker . . . 4 2.2 Detection Techniques . . . 5 2.2.1 Threshold Techniques . . . 52.2.2 Boundary Detection Techniques . . . 7
2.2.3 Pattern Matching Algorithms . . . 8
2.3 Summary . . . 8
Chapter 3 Related Work 9 3.1 ARToolKit . . . 9
3.2 ARTag . . . 11
3.4 Summary . . . 13
Chapter 4 Selectable Thresholding Augmented Reality System 14 4.1 Tool Design . . . 14
4.2 Labeling Phase . . . 15
4.2.1 Dynamic Global Thresholding . . . 16
4.2.2 Adaptive Thresholding . . . 17
4.3 Marker Detection Phase . . . 17
4.3.1 Flat Area Removal . . . 18
4.3.2 Quadrangle Detection . . . 19
4.3.3 Boundary Reconstruction . . . 20
4.3.4 Finding Inner Boundary . . . 22
4.4 Pattern Matching Phase . . . 23
4.4.1 Partial Pattern Matching . . . 23
4.5 Summary . . . 25
Chapter 5 Experiment Design 26 5.1 Experimental Environments . . . 26
5.2 Immunity to Light Condition . . . 27
5.2.1 Single Marker Detection . . . 27
5.2.2 Multiple Markers Detection . . . 29
5.3 Immunity to Partial Occlusion . . . 30
5.4 Computational Performance . . . 32
5.5 Summary . . . 33 Chapter 6 Conclusion and Future Work 34
List of Figures
2.1 Two types of AR planar markers (a) Template marker (b) ID-marker . . . 5
2.2 An example for integral image . . . 7
2.3 Boundary following steps. . . 8
3.1 Structure of ARToolKit . . . 10
3.2 Example of ARToolKit detection flow . . . 10
3.3 Structure of ARTag . . . 11
3.4 Structure of ARToolKitPlus . . . 12
4.1 Structure of STAR . . . 15
4.2 Detection under different illuminance with dynamic global threshold . . . 17
4.3 Using global threshold and adaptive threshold to detect multiple markers under unbal-ance light . . . 18
4.4 (a) Horizontal Prewitt mask (b) Vertical Prewitt mask . . . 19
4.5 Example of quadrangle detection (a) The start point (b) The sample points (c) Calcu-late the slopes of each sample points (d) The part includes corner point (e) The correct corner position (f ) The object is regarded as quadrangle while four corners are found . 20 4.6 Example of boundary reconstruction (a) The object with detected corners and sample points (b) The longest side of the boundary and the longer neighbored side (c) The three correct points (d) The slopes of the two shorter sides next to the standard sides (e) The intersection point of the two line equations (f ) The reconstructed boundary . . . 21
4.7 The example of failed outer boundary reconstruction . . . 22
4.8 The following steps of Figure 4.7 . . . 23
4.9 An example of an occluded marker. The orange area shows the parts for pattern matching. 24 4.10 The four recalculated templates for the Figure 4.9 example . . . 25
5.1 The single marker detection under different illuminance . . . 28 5.2 The multiple markers detection under different illuminance . . . 29 5.3 Markers occluded by different sized black triangles . . . 31
5.4 Two examples of partial occluded marker detection by using STAR. (a) Use white object occlude marker's inner boundary, and (b) Use black object occlude marker's inner pattern. 32
Chapter 1
Introduction
1.1
Augmented Reality
Augmented Reality (AR) is an interaction technology which exactly overlays the physical image with the virtual object in real time. By interacting with objects in the real world, people can easily control the objects in the virtual world. A common definition of AR technology should (1) combine real and virtual image, (2) interact in real time, and (3) register the virtual image with the real world [1]. These characteristics make AR a perfect tool for entertainment [2], education [3], and human–computer interaction [4] domains.
The AR technology can be divided into three major research areas: (1) tracking, (2) in-teraction, and (3) display techniques. Tracking is one of the most popular topics in the AR researches, which can be separated into three techniques: (1) vision-based tracking techniques, (2) sensor-based tracking techniques, and (3) hybrid tracking techniques [5]. Vision-based track-ing techniques use image processtrack-ing methods to calculate camera pose relative to the real world objects without using expensive sensors. Sensor-based tracking techniques usually use sensors such as magnetic, optical, GPS or other sensors to get more accurate information, compare to the vision-based tracking techniques. However, the high cost of sensors makes it unsuitable un-der some conditions. The third tracking techniques, combining the aforementioned techniques, intend to get robust tracking results with lower costs.
Many existing tracking methods adapt the vision-based tracking techniques, which usually use with planar markers, or so called fiducial markers. The planar markers provide coordinates-known feature points, which can improve the accuracy, stability and performance of the vision-based tracking systems [6]. The popular ARToolKit library [7] [8] is one of these AR systems using planar markers. However, using planar markers still suffers some drawbacks, (1) the marker may not be detected under unbalanced light conditions, and (2) the marker may be par-tially occluded while detection. These drawbacks lead to an undetectable result.
Detection under unbalanced lights is always a problem for AR systems using planar mark-ers. In unbalanced light conditions, the illuminance is different in every different parts of image frame. Since most tools use threshold method during the detection step, it is hard to choose a fix value to deal with unbalanced light conditions. Some of the tools use dynamic thresholds to solve the problem, such as ARToolKitPlus [9] [10], a promoted vision of ARToolKit, use a simple method to change global threshold while detection. Pintaric [11] proposed an adap-tive threshold method based on ARToolKit to cope with the unbalanced light detection. These threshold-based methods provide correct results when detecting single marker detection, but fail to detect multiple markers under unbalanced light conditions.
Another challenge in detecting markers is to correctly detect the marker even when it is partial occluded. Most existing systems use multiple markers to find the occluded marker by a pre-defined model and the non-occluded markers. Some existing systems use the hybrid-based methods to find the occluded markers [12]. These methods need sensors to detect occluded markers, increasing the cost of the systems. However, only few of the vision-based systems can find a marker that is partial occluded. Hirzer [13] proposed a gradient method to find the missing corner by searching marker's boundaries and corners, but this method fails while the marker is occluded by dark objects. ARTag [14] [15], another famous AR library, can detect
single marker with its periphery partially occluded, but still fail to detect the marker when its inner pattern is occluded.
1.2
Contributions
In this research, we present an AR system, Selectable Thresholding Augmented Reality System (abbreviated to STAR), which can deal with unbalanced light detections and partial oc-cluded markers detection. To detect a marker under unbalanced lights, we provide two methods (1) dynamic global thresholding, and (2) adaptive thresholding based on Bradley's algorithm [16]. The former method deals with the single marker detection while the later one is suit for multiple markers detection under unbalanced lights. A user can select a proper method to get a better result according to user's requirements and purposes. We also design a new method to detect partial occluded markers. When a marker is partially occluded, our method rebuilds the missing boundaries of the marker. By using the partial pattern matching technique, the proposed method can even detect the marker when its inner pattern is occluded.
To demonstrate that our system can detect markers under unbalanced lights or when the marker is partially occluded, we design a series of experiments to evaluate the system's perfor-mance. We also compare our system with other AR systems, to present the improvements.
1.3
Organizations
The thesis is organized as follows. We review the background and the existing algorithms for marker detection in Chapter 2. Then we introduce the common planar marker AR systems in Chapter 3. In Chapter 4 and 5, we explain our design and conduct experiments to evaluate the system performance. Finally, we conclude the thesis in Chapter 6.
Chapter 2
Background
The section details the planar markers used in AR techniques, and other image processing methods we applied to the proposed system, STAR.
2.1
Planar Marker
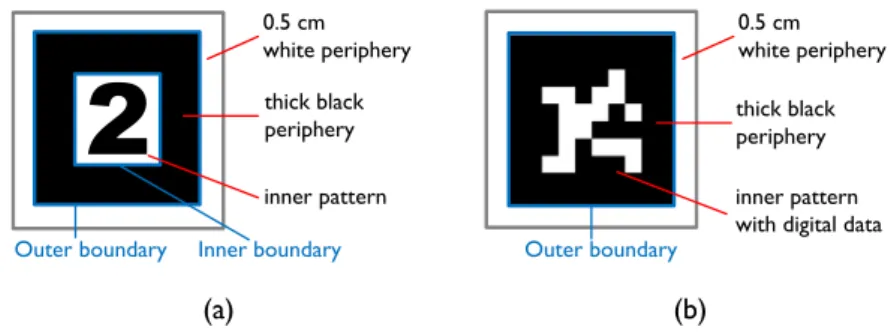
Vision-based AR systems usually use planar markers to obtain the positions and angles to merge the virtual images into real image. These planar markers should have two characteristics: (1) Square shape, and (2) Thick black peripheries. The square markers involve four right angles as the salient points for 3D detection, and the markers' thick black peripheries make them easy to be separated from the background objects. There are two common types of planar markers used in the existing AR systems, one is the template marker and the other is the ID marker. Figure 2.1 illustrates the two different planar markers. The template markers have both outer and inner boundaries and use geometry patterns or words as inner patterns, while ID markers only have outer boundaries and use the digital images as inner patterns.
In this paper, we adopt template markers in the proposed system, STAR. The template mark-ers are also used in ARToolKit [7] [8]. This kind of marker is composed of three parts: (1) white periphery, (2) thick black periphery, and (3) inner pattern. Some definitions don't take the outer white periphery as a part of template markers. But the clear boundary between contrastive black and white peripheries increases the detection rate. The second part is the thick black periphery, including square-shaped outer and inner boundaries. The existing AR systems can detect the
0.5 cm white periphery thick black periphery inner pattern
Outer boundary Inner boundary
0.5 cm white periphery thick black periphery inner pattern with digital data
Outer boundary
(a) (b)
Figure 2.1: Two types of AR planar markers (a) Template marker (b) ID-marker
two boundaries and identify markers from background objects easily. The last part, the inner pattern, helps identify different markers by using pattern matching algorithms.
In 2009, M. Fiala has indicated the template marker may have higher inter-confusing rate [14]. Comparing to the ID markers, template markers with both outer and inner boundaries are much easier to rebuild while occlusion occurs. In addition, when the marker's inner pattern is occluded, a template marker can still be detected by using partial pattern matching algorithms but the system may get a failure or wrong detection when using an ID marker.
2.2
Detection Techniques
In this section, we introduce the detection techniques used in many existing AR systems, including threshold, boundary detection and the pattern matching techniques.
2.2.1
Threshold Techniques
Threshold techniques are the most common techniques for image processing. When finding objects in an image frame, we can set a threshold to convert a color image into black-and-white image. The threshold should be closed related to the light conditions in the environment, so that it should be adjusted by the lights. An inappropriate threshold may make the detection failure
while a well-chosen threshold can reduce the difficulties in the subsequent image processing. Therefore, it is important to choose a right threshold to handle different light conditions. The common threshold techniques can be separated into two methods: (1) the global thresholding method, and (2) the adaptive thresholding method.
Global thresholding method is the simplest and the fastest method to find an object in an image frame. When a user sets a threshold value, the pixels in the whole image with grey val-ues larger than the threshold are set to white and other pixels are set to black. The fixed global threshold method, which used in ARToolKit, fails easily under the unbalanced light conditions. Other systems, such as ARToolKitPlus [9], use dynamic thresholding methods to solve the prob-lem, which changes the threshold randomly to guess the right threshold while the previous frame detection failed. This method performs well for the single marker detection, but it doesn't fit to multiple makers detection under the unbalanced light conditions.
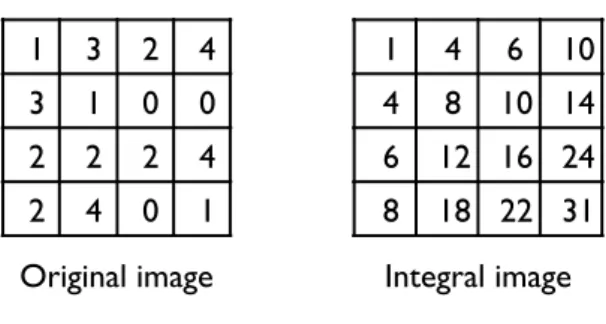
Another thresholding method is the adaptive thresholding method, or so called local thresh-olding method. This method sets different thresholds for different regions to solve the problem in detecting multiple markers. Pintaric [11] tries to find the marker region and calculates the weighted average of the region as a threshold. This method is simple and widely used in many AR systems, such as Hum-AR [3], and it also suit for ARToolKit. The marker position from the previous frame is required to get a correct adaptive threshold value in the present frame. Bradley et al. then proposed an adaptive thresholding method where no previous information is required. The threshold value is calculated by a weighted average from a fix-sized region, and used to determine the color of center pixel of the region. Nevertheless, this method has to calculate many adaptive thresholds while processing a single frame of image, which consumes a lot of time. Hence, D. Bradley uses an integral image to reduce the processing time. We show an example of integral image in Figure 2.2. The left image shows the grey level of every
1 3 2 4 3 1 0 0 2 2 2 4 2 4 0 1 1 4 6 10 4 8 10 14 6 12 16 24 8 18 22 31 Original image Integral image
Figure 2.2:An example for integral image
pixel in the original image, the integral image can be calculated by these pixels’ gray levels. After calculating an integral image, a summation of the region can be simply calculated by the four elements in the integral image. By using the integral image, the processing time can be dramatically reduced to fit the real time requirements in processing video.
2.2.2
Boundary Detection Techniques
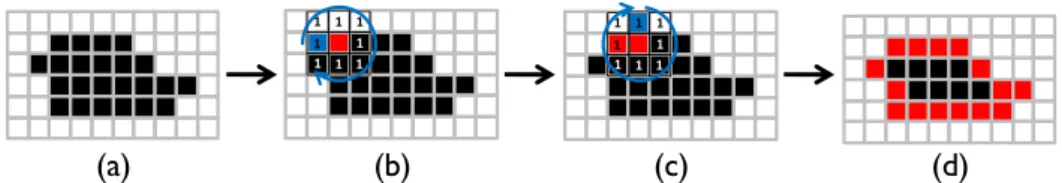
This classic boundary detection method is designed by Moore in 1968 [17] [18]. It is useful to detect the closed boundaries of an object. Figure 2.3 shows an example to detail the steps of finding the boundaries of an object. First, we locate the object's upper left corner, and mark it as the first boundary point and its left neighbor point as the background point. The two points are marked red and blue shown in Figure 2.3 (b). We check the 8-neighbors pixels of the boundary point, starting at the background point and proceeding in a clockwise direction. For an object, the first detected pixel is the second boundary point, and the former checked point is the new background point, which is the upper neighbor point of the second boundary point as shown in Figure 2.3 (c). The detection steps repeat to find new boundary points until it reaches to the first boundary point and re-found the second boundary point again. This method can find the closed boundary of objects simply and efficiently, but it fails to detect the inner boundaries of the hollow objects, such as the black peripheries of template markers.
1 1 1 1 1 1 1 1 1 1 1 1 1 1 1 1 (a) (b) (c) (d)
Figure 2.3: Boundary following steps
2.2.3
Pattern Matching Algorithms
The pattern matching algorithms are used to recognize the markers by matching the inner pattern with the template. A well-known pattern matching algorithm, Normalized Cross Cor-relation (NCC) [18], is widely used to identify patterns. ARToolKit also adopts NCC to match patterns. NCC correlates two patterns using Equation 2.1. In the equation, Gtand Gsrepresent
the template data and the marker inner pattern data, respectively. r means the correlation of the two data. The correlation approaches to 1 if Gtis similar to Gs. A marker is detected while the
correlation between the inner pattern and the template is larger than 0.5. r = ∑n i=1 ∑m j=1(Gt(i, j)− ¯Gt)(Gs(i, j)− ¯Gs) √∑n i=1 ∑m j=1(Gt(i, j)− ¯Gt)2 √∑n i=1 ∑m j=1(Gs(i, j)− ¯Gs)2 (2.1)
2.3
Summary
In this chapter, we discussed the two types of planar markers used in AR systems first, and then introduced the image processing methods we use in STAR. We compared the pros and cons of the two shaped markers and chose the template markers, which can be reconstructed easily while the marker is occluded. In our system, we use Bradley's adaptive threshold method to cope with multiple markers detection under unbalanced light. We also use boundary following to detect objects' outer boundaries, and Normalized Cross Correlation to match makers' inner patterns. By using these methods, we don't have to design new algorithms to detect boundaries
Chapter 3
Related Work
The section discusses several existing tools and libraries, including ARToolKit, ARTag and ARToolKitPlus, used for augmented reality technologies.
3.1
ARToolKit
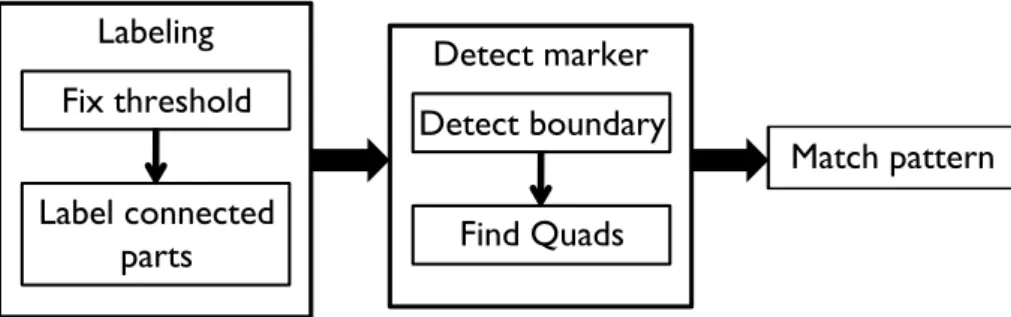
ARToolKit (ARTK) [7] [8], mainly developed by Hirokazu Kato, is one of the famous li-braries designed for AR applications. This popular tool is widely used in object tracking and human-computer interaction. ARTK is also an open source tool which can be applied on differ-ent platforms. With complete and detailed reference files, ARTK is a beginner-friendly tool for developing AR applications. The structure of ARTK, outlined in Figure 3.1. It can be separated into three phases: (1) Labeling, (2) Detect marker, and (3) Match pattern.
In the first phase, ARTK uses a method with a fixed global threshold to binarize a frame into a black-and-white image. After the binarization, the image contains several continued black blocks we called objects. To realize the number of objects in the image, ARTK use sequential labeling algorithm [19], assigning different labels to each object. The object area and region can also be calculated during the labeling phase. With the information of each object, ARTK can process object one by one in the following phase. The second phase contains two detections: (1) boundary, and (2) quadrangle detection. The boundary detection intends to find the closed-contour for each object by using the boundary following method [17]. Only if an object has closed boundary, the quadrangle detection can determine whether this object is a quadrangle or
Fix threshold Labeling Label connected parts Detect marker Detect boundary Find Quads Match pattern
Figure 3.1: Structure of ARToolKit
Hiro
Binarize image Detect contour Detect square Pattern matching
Success! Success!
Hiro
Hiro
Hiro
Success!
Figure 3.2: Example of ARToolKit detection flow
not. In the third phase, ARTK identifies markers by applying pattern matching method.
Figure 3.2 illustrates an example to explain the detection flow of ARTK. First, ARTK use a fix threshold (usually 100) to binarize the colorful image into black-and-white image. At the next step, the tool detects the boundary of each object and finds the outer boundary of marker's thick black periphery. Then, boundary of an object is detected by checking whether the boundary is quadrangle or not. Finally ARTK uses the pattern matching method to compare the inner pattern with the template. If the result is close to 1, ARTK takes the object as a marker.
The detecting technique of ARTK is very efficient, however, the results of marker detection is not always reliable under different circumstances. The fixed global threshold used in the first phase generates a non-robust result under unbalanced light conditions. In addition, the boundary detection can only be used to detect the outer boundary and results in a failure in detecting a marker while partial occlusion occurs.
Marker ID
identification
Boundary detection
Inner pattern detection
Get digital data
Sample inner pattern
Find quads by
gradient image
Get marker pose
Decode ID
Figure 3.3: Structure of ARTag
3.2
ARTag
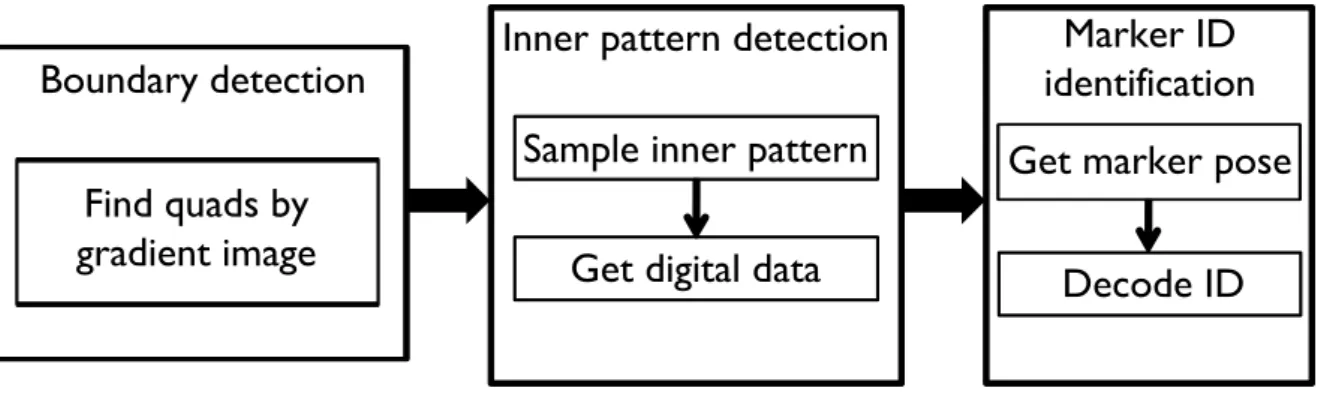
ARTag [14] [15] is another famous AR tool developed by Mark Fiala. ARTag uses ID markers to replace the template markers used in ARTK. Without using the pattern matching method, ARTag detects the inner pattern as a marker ID, which provides more robust information when detecting multiple markers at a time. The ID marker system adopted by ARTag supports up to 2002 different markers. Instead of the thresholding method, ARTag uses the gradient method to find a marker's quadrangle boundary, which provides better detection results for unbalanced light detection and partial occluded marker detection. Figure 3.3 shows the control structure of ARTag, which can also be separated into three phases: (1) boundary detection, (2) inner pattern detection, and (3) marker ID identification.
In the first phase, ARTag uses a boundary detection algorithm to find the quadrangle parts by using the gradient image. After finding the quadrangle objects, the tool tries to detect the inner patterns in the markers and sample it into a 6×6 grid. The sampled inner pattern can be translated into 36-bit digital codes. At the last phase, ARTag checks the 36-bit codes to find the pose and rotation of the marker, and decodes the digital code to get the marker ID. With the marker ID, ARTag can identify different markers correctly.
Threshold
Dynamic threshold Fixed threshold orMarker detection
ID marker detection Pattern matching orPose estimation
Signal marker or Multiple markersFigure 3.4: Structure of ARToolKitPlus
Compared to ARTK, ARTag has better performance in marker detection. However, ARTag fails to detect a marker while the inner pattern is occluded since the correct marker ID cannot be calculated from the digital code of the occluded inner pattern. We will demonstrate and discuss the occlusion failure in Chapter 5.
3.3
ARToolKitPlus
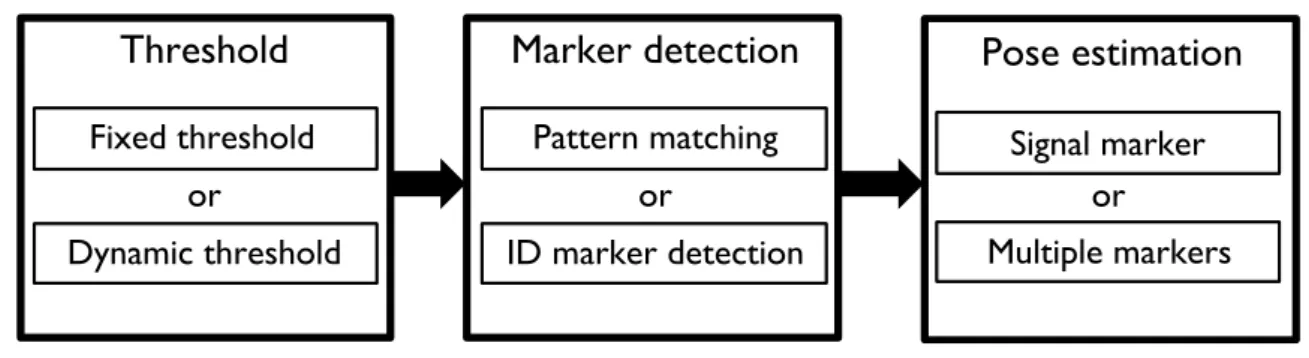
ARToolKitPlus (ARTK+) [9] [10], developed by Daniel Wagner, is a revision from ARTK. The main purpose of ARTK+ is to improve the performance of ARTK and apply the AR tech-nique on the mobile devices. Since accuracy and efficiency are always a tradeoff, ARTK+ uses a special detection technique which allows a user to choose the best detection method for differ-ent purposes. A user can choose high efficiency but less robust detection method for the mobile devices or use robust method for high computer power PCs. The flexible structure of ARTK+ is illustrated in Figure 3.4.
The structure flow of ARTK+ can be separated into three phases. The first phase determines a threshold value. One of the choices is specifying fixed global threshold, which is adopted by ARTK. Another choice is to use dynamic global thresholding, which uses the random number
The second phase is in charge of marker detection. A user can choose the template marker and choose pattern matching method used in original ARTK, which is an efficient but less robust method. Another choice is to use the ID marker system used by ARTag. Such a choice supports up to 4096 different markers. The last phase is to estimate pose. The pose estimation contains two sub phases: signal marker and multiple markers estimation. However, ARTK+ can only detect fix arranged multiple markers, which needs to set up the module before detection. It can't detect stably for separated multiple markers since the pose estimation can only estimate the pose of one marker in this type of detection.
ARTK+ truly improves the performance of original ARTK and gives more reliable result under many circumstances. However, ARTK+ does not fit to detect separated multiple markers, and does not performs well for detecting multiple markers under unbalanced light conditions. In addition, since the detection algorithm is similar to ARTK, ARTK+ also can't detect partial occluded markers.
3.4
Summary
We introduced three popular AR systems in this chapter, and discussed the problems for these systems. ARTK cannot handle unbalanced light detection and partial occluded marker detection. ARTag uses gradient methods to solve these two problems, but still can't detect inner pattern occluded markers. Another system, ARTK+, is a revision from ARTK and intends to improve the drawback of the unbalanced light detection. However, it is still unable to detect multiple markers under unbalanced light and the partial occluded markers. We will detail our designs to improve these problems in the next chapter.
Chapter 4
Selectable Thresholding Augmented
Reality System
The section interprets the structure of STAR, including the labeling phase, marker detection phase, and pattern matching phase.
4.1
Tool Design
Selectable Thresholding Augmented Reality System (STAR) is a tool to deal with unbal-anced light detection and partial occluded marker detection. STAR is based on ARTK [6] [7] which is an open source AR system and provides complete and detailed reference files. These characteristics make ARTK a suitable foundation than other existing AR systems. The purpose for STAR is to solve two problems for existing AR systems using planar markers (1) detect single and multiple markers under unbalanced lights, and (2) detect partial occluded markers. Moreover, the detection methods we use must be efficient to fulfill the real-time characteristic of AR definitions.
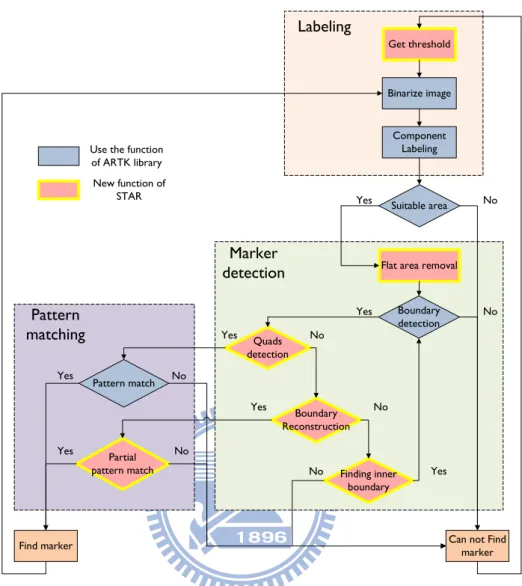
Figure 4.1 shows the structure of STAR, which is very similar to the structure of ARTK, but we add new steps and modify some original steps to improve the detection performance. The structure can be divided into three phases: (1) labeling, (2) marker detection, and (3) pattern matching. We will mention the details of these three phases in the following sections.
Flat area removal Boundary detection Quads detection Finding inner boundary Pattern match
Can not Find marker Find marker No Yes No Yes No No Yes Yes Get threshold Binarize image
Use the function of ARTK library New function of STAR Labeling Marker detection Component Labeling Pattern matching Boundary Reconstruction Partial pattern match No Yes No Yes Suitable area No Yes
Figure 4.1:Structure of STAR
4.2
Labeling Phase
The main purpose for this phase is to find the number of objects in an image, and assign different labels to identify these objects. Thus, we can check these objects one by one to find marker candidates in the following phases. This phase is composed of three steps: (1) get thresh-old, (2) binarize image, and (3) component labeling. The first step includes two methods for a user to choose: (1) dynamic global thresholding, and (2) adaptive thresholding. After getting the threshold value, we can binarize the image and find the objects by applying the sequential labeling algorithm [19]. While we want to solve the detection under unbalanced lights, we focus
on the two methods to get thresholds and detail them in the following sections.
4.2.1
Dynamic Global Thresholding
Dynamic global thresholding is a fast and simple method, which is suitable for single marker detection. This method can get the correct threshold in a short period of time under the changing light conditions, and it can also cope with general unbalanced light conditions. Different with ARTK+ [9], our dynamic global thresholding method doesn't change threshold randomly, but change it in three values. These threshold values are used to handle dark, normal and bright conditions. To find the three values, we test the detection rate under common illuminance range (from 100 Lux to 2000 Lux) by using different thresholds, and note the results in Table 4.1. From the test results, we choose the three thresholds as 70, 140, and 250 to deal with dark, normal and bright conditions separately.
Table 4.1: Detection under common illuminance range with different threshold illuminance\threshold 20 40 70 100 140 170 210 250 100 100% 100% 100% 0% 0% 0% 0% 0% 150 0% 100% 100% 100% 0% 0% 0% 0% 200 0% 100% 100% 100% 100% 0% 0% 0% 500 0% 0% 100% 100% 100% 100% 0% 0% 750 0% 0% 0% 77% 100% 100% 100% 100% 1000 0% 0% 0% 0% 100% 100% 100% 100% 1500 0% 0% 0% 0% 0% 0% 0% 100% 2000 0% 0% 0% 0% 0% 0% 0% 100%
During the marker detection, we will modify the threshold while the light condition changes. Since we don't use optical sensors, we change the threshold while our system can't find markers in the previous frame. We won't stop changing the threshold until we find a marker in the frame, in order to detect the new-incoming markers under any light conditions. Figure 4.2 shows the examples of using dynamic global thresholding to detect markers under dark, normal and bright
Dark condition
(250 Lux) Normal condition(870 Lux)
Light condition (1840 Lux)
Figure 4.2: Detection under different illuminance with dynamic global threshold
conditions.
4.2.2
Adaptive Thresholding
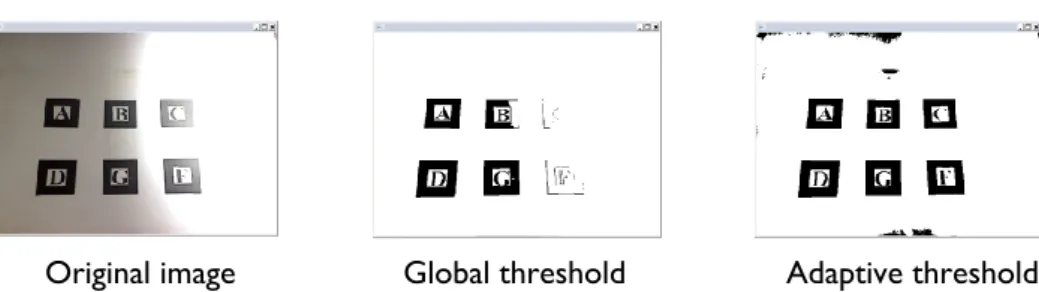
The adaptive thresholding method for STAR is based on the Bradley's [16] method we've mentioned in Chapter 2. In this method, we regard the center pixel which intensity is 5% lower than the region average as black. This method can provide correct results for multiple markers detection under unbalanced light conditions as showed in Figure 4.3. Nevertheless, this method is designed to process grey level images originally, which may get wrong results for processing color images. For example, the skin color which should be recognized as white color may be recognized as black color by applying the original Bradley's method. Thus, our adaptive thresholding method doesn't calculate one integral image with grey level but calculate three integral images with red, green and blue colors separately. A pixel is set to black while the three color intensities are less than the weighted average calculated by each integral image. This method may increase processing time, but it still suitable for real-time video process.
4.3
Marker Detection Phase
The marker detection phase is to find an object is whether a possible marker or not. This phase will consume a lot of time if we check every object one by one. Hence, we eliminate the
Original image Global threshold Adaptive threshold
Figure 4.3: Using global threshold and adaptive threshold to detect multiple markers under unbalance light
improper objects by the area first. Objects with too large or too small area are eliminated before this phase. The structure in this phase includes the following methods: (1) flat area removal, (2) boundary detection, (3) quadrangle detection, (4) boundary reconstruction, and (5) finding Inner boundary. The boundary detection method in the second step is the boundary following method [17][18] we've introduced in Chapter 2. We will introduce other new designed methods in the following sections.
4.3.1
Flat Area Removal
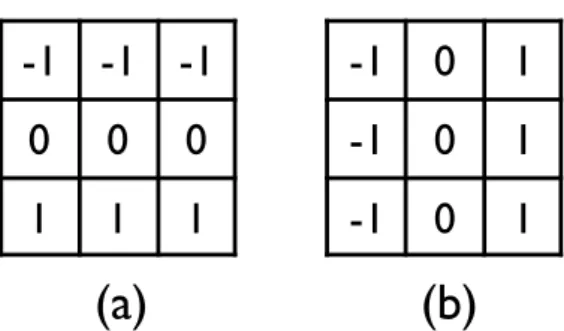
The boundary following algorithm can only detect outer boundaries of the template markers. The outer boundary detection can failed easily when a marker is partially occluded. In these cases, we want to use the inner boundary to rebuild the marker. In this step, we try to reveal the hollow objects' inner boundaries by using Prewitt mask [20][18] to remove objects' flat area. Figure 4.4 shows the Prewitt masks for both vertical and horizontal direction. If the pixel belongs to flat area, the results would be zero for both masks. We remove these pixels and reveal the outer and inner boundaries of the objects. These two boundaries will be checked in the following steps to determine an object is whether a marker candidate or not.
-1 -1 -1
0
0
0
1
1
1
-1 0
1
-1 0
1
-1 0
1
(a)
(b)
Figure 4.4: (a) Horizontal Prewitt mask (b) Vertical Prewitt mask
4.3.2
Quadrangle Detection
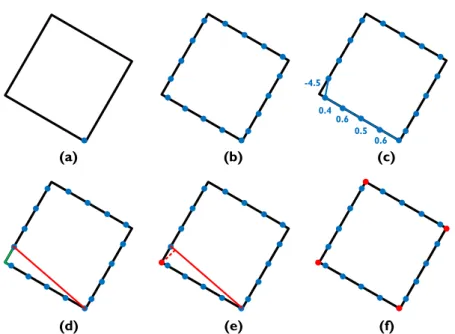
While we use the square-shaped planar markers, it is easy to find marker candidates by finding square objects in the image frame. Nevertheless, with the affection of perspective pro-jection, the markers won't be in square shape but in quadrangle shape in the grabbed frame image. In this step, we try to find these quadrangle shaped objects by locating the corner points of their boundaries. The corner points stand for the points with the slope changes the most in the near areas. When we locate all of the corner points, we can figure out the shape of the objects' boundaries and find the quadrangle shaped objects.
Figure 4.5 illustrates an example of our quadrangle detection method. First, we take the lowest point of an object's boundary as a start point. In the next step, we try to sample the boundary by 50 sample points. After sampling, the slopes of each sample points are calculated. Comparing the changing of these slopes, we can find a part includes the corner point. We call this part as "corner part", which is showed as the green segments in the Figure 4.5 (d). Then, we link a line between the start point and the second sample point of the corner part. With checking the distance from every point belongs to the corner part to the linked line, we can find the point with the longest distance as the corner point. After finding the corner point, we take the second sample point of the corner part as a new start point and reiterate the above steps until we find all corner points of the boundary. An object with its boundary has four corners is regarded as a
0.6 0.5 0.6 0.4 -4.5 (a) (b) (c) (d) (e) (f)
Figure 4.5: Example of quadrangle detection (a) The start point (b) The sample points (c) Calculate the slopes of each sample points (d) The part includes corner point (e) The correct corner position (f) The object is regarded as quadrangle while four corners are found
candidate of complete marker, which can be recognized by pattern matching directly.
4.3.3
Boundary Reconstruction
The quadrangle detection method can find candidates of complete markers, but can't find the candidates of partial occluded markers. We want to find whether an object is a candidate of occluded marker or not in this step. Generally speaking, we can find more than four corners for the boundaries of occluded markers. However, an object with too many corners is impossible to be a marker. Hence, we only reconstruct the objects with their boundaries have more than four corners but less than fifteen corners.
Figure 4.6 shows an example of boundary reconstruction. With a marker occluded by a white triangle, we can find ten corners in the quadrangle detection step. We signed these ten corners as red circles and other sample points as blue circles in Figure 4.6 (a). First, we have to find two neighbored sides which are not occluded by the white triangle as the standard sides to
1.2 -0.8
(a) (b) (c)
(d) (e) (f)
Figure 4.6:Example of boundary reconstruction (a) The object with detected corners and sample points (b) The longest side of the boundary and the longer neighbored side (c) The three correct points (d) The slopes of the two shorter sides next to the standard sides (e) The intersection point of the two line equations (f) The reconstructed boundary
reconstruct boundary. We take the longest side of the boundary and the longer side next to it as the standard sides. Three correct corners can be found in these two standard sides. In the next step, we calculate the line equations of the two shorter sides next to the two standard sides. The intersection point of these two equations is the missing corner position. At the last step, we can rebuild the quadrangle boundary by three correct corners and one calculated missing corner.
This method can cope with the general occlude conditions and give stable results, but it may fail or give wrong results when the three sides of the inner boundary are occluded. Under this condition, it is useless to rebuild the boundary while the major part of inner pattern may also be occluded, making it impossible to be recognized by the partial pattern matching method in the next phase.
Boundary detection Quad detection Flat area removal
Fail! Success!
Find 15 corners rebuild fail Try to find inner
boundary
Hiro
Boundary reconstruction
Figure 4.7: The example of failed outer boundary reconstruction
4.3.4
Finding Inner Boundary
Inner boundary is important for the occluded marker detection and very useful when the outer boundary reconstruction failed. This situation occurs while finding too many corners in the outer boundary or calculating incorrect slope or incorrect missing point position during the reconstruction step. Figure 4.7 shows an example of failed outer boundary reconstruction while detecting too many corners for the circular occlude object.
This step includes two sub-steps (1) remove the outer boundary, and, (2) find the upper left corner of the inner boundary. While we have removed the flat area, the inner boundary is left after removing the outer boundary in the first sub-step. We can use the boundary following method again to find pixels belong to the inner boundary after finding the upper left corner in the second sub-step. Like the detection steps for outer boundary, the inner boundary is also checked by the quadrangle detection step and, if needed, the boundary reconstruction step. If an object with quadrangle-shaped inner boundary is detected, it would be regarded as a candidate of occluded marker. The candidate will be checked by using the partial pattern matching in the next phase. Figure 4.8 shows the inner boundary detection example, which is the following steps of the example in Figure 4.7. With recheck the inner boundaries, we can deal with much more occlusion situations than methods only detect the outer boundaries.
Boundary detection Quad detection Boundary reconstruction Find inner contour
Success! Fail! Success!
Partial
pattern
matching
Figure 4.8: The following steps of Figure 4.7
4.4
Pattern Matching Phase
The marker detection phase can find marker candidates from an image frame, and we have to ensure the candidates are true markers by matching the inner patterns. This phase can not only eliminate the incorrect candidates but also recognize different markers to each other. The former is very important while our boundary reconstruction method may detect the background objects as marker candidates which need to be eliminated in this phase.
The pattern matching method we use is the Normalized Cross Correlation method [18] we've introduced in Chapter 2. An inner pattern will be matched by the template in four different ori-entations to find the direction of marker's rotation. However, this method doesn't give reliable matching results while the inner pattern is occluded. The solution is using partial pattern match-ing method for boundary reconstructed candidates while usmatch-ing the original method to match the ordinary candidates.
4.4.1
Partial Pattern Matching
The original pattern matching method is not robust for partial occluded markers. To increase the robustness, we use the partial pattern matching method, which is very similar to the original pattern matching method. We divide the inner pattern into four parts, and only match the parts
Hiro
Figure 4.9: An example of an occluded marker. The orange area shows the parts for pattern matching.
which are not occluded. We show an example of occluded marker and the matching parts in Figure 4.9.
The first step in partial pattern matching is to find the position of occluded parts. In the marker detection phase, we can find a missing point of the occluded marker, which also indi-cates the position of occluded part. The second step is to recalculate the new templates in four directions. Figure 4.10 shows the four templates for the former example. After calculating the new templates, we can use NCC method to match the partial inner pattern and the new templates. The partial pattern matching method can match markers with occluded inner pattern, but it can't match correctly when more than quarter of inner pattern is occluded. These markers with large occluded area can't provide enough features and can be confused with the background objects while detection. It is not a good idea to regard the background objects as markers while we try to detect these broken markers. Thus, we regard markers with more than a quarter of their inner patterns are occluded as background objects, not the markers we intend to detect.
Hiro
H
iro
Hiro
H
ir
o
Figure 4.10: The four recalculated templates for the Figure 4.9 example
4.5
Summary
In this chapter, we detailed the structure of our AR system, STAR, and the new designed methods to improve the problems for other systems. The two thresholding methods in the la-beling phase are to solve the unbalanced light detection problems. Besides, the new quadrangle detection method and boundary reconstruction method make our system rebuild the boundaries of partial occluded markers. If the outer boundary reconstruction failed, we can also use the inner boundary to rebuild the marker. Finally, the partial pattern matching method increases the stability of the partial occluded marker detection results. We will demonstrate the STAR's ability by the experiments in the next chapter.
Chapter 5
Experiment Design
The section demonstrates the experiment results, including lighting immunity, partial oc-clusion immunity, and computational performance, and discusses the performance of each AR system.
5.1
Experimental Environments
The camera we used for grabbing images is Logitech Webcam Pro 9000. This camera can capture 2-megapixel high definition video and grab up to 30 frames per second (FPS) video. It also equips autofocus and auto exposure compensation functions which can also be adjust manually. With these two functions, we can emulate the experiment environments we need. The computer platform we use is an ASUS AS-D760 with 2.93GHz Intel Core2 Duo E7500 Dual-core processer and 2GB RAM with Windows XP SP3. This is the general equipment of the current Dual-core computers.
We conduct every experiment by the following steps:
1. Attach the 5×5 (cm2) sized marker on the vertical white wall. 2. Fix the camera at the distance of 40cm away from the marker.
3. Capture the VGA sized (640×480 pixels) video with frame rate at 30FPS. 4. Use the test program of different systems to detect the markers.
nity, and (3) computational performance separately. Before demonstrating these experiments in the following sections, one thing is worth mentioned. While ARTag only provides a demo execution file, we can't modify the source code to calculate the information we need, such as the detection rate or frame rate. In the following experiments, we use the "⃝" sign to show ARTag can well detect markers while the "×" sign means the system can barely detect the markers in the experiment. And in the speed performance experiment, since we can't measure the frame rate manually, the frame rate of ARTag is signed as "not available".
5.2
Immunity to Light Condition
Light condition is always an important issue for marker detection. To find the immunity of different light conditions for every planar marker AR system, we design two experiments finding the detection rates of single marker and multiple markers detection. In addition, we will test STAR by using both dynamic global thresholding method and adaptive thresholding method separately to show the performance of these two methods for different types of detection.
5.2.1
Single Marker Detection
In this experiment, we try to find the detection rate of existing AR systems detecting single marker under unbalanced lights. As Figure 5.1 shows, we set a light source and the illuminance of each part is different, confirm the definition of unbalanced lights. Then, we use the illumi-nance meter to find the positions with the illumiillumi-nance at 200, 500, 1000, 1500 and 2000 Lux. We attach planar marker to these positions and set the camera to grab images. We also disable the auto exposure compensation function to ensure the light condition won't be changed by the camera. During the detection, the detection rate is calculated by the percentage of the correct
Marker
Illuminance
200
500
1000
1500
light
(Lux)
Figure 5.1: The single marker detection under different illuminance
Table 5.1: The detection rate for single marker detection under different illuminance Illuminance (Lux) ARTK ARTag ARTK+ STAR (Global) STAR (Adaptive)
200 100.00% ⃝ 100.00% 100.00% 100.00% 500 100.00% ⃝ 100.00% 99.90% 100.00% 1000 0.00% ⃝ 99.70% 99.80% 100.00% 1500 0.00% ⃝ 20.10% 99.80% 99.76% 2000 0.00% ⃝ 21.00% 99.80% 2.06%
detection times in 1000 measurements, we record the average of 5 detection rates in Table 5.1.
Comparing the results in Table 5.1, we can find ARTag and STAR with dynamic thresh-olding method can give stable detection results under general illumination range while ARTK and ARTK+ can't. Since ARTK uses the fixed global thresholding method, it is hard to detect markers under bright conditions. ARTK+ tries to improve this drawback by using the random dynamic thresholding method, but still can't detect stably for markers in the bright environ-ments. It's because the random method needs to guess many times to find the right threshold in bright conditions, and it has to guess again while the chosen threshold doesn't provide stable detection results. Differ from AETK+, our dynamic global thresholding method detects well under different light conditions and only needs one or two frames to find the correct and stable
light
900
380
200
210
500
1500
Illuminance of
each marker (Lux):
3cm
4cm
Figure 5.2: The multiple markers detection under different illuminance
this method can't detect markers for illuminance exceeds 1500 Lux. It's because the adaptive thresholding method regards the color of the points which intensity is 5% lower than the region average as black. Nevertheless, in excessive bright conditions, the real black and white color are very close to each other in the grabbed images, makes it hard to classify these two colors by using adaptive thresholding method.
5.2.2
Multiple Markers Detection
The multiple markers detection under unbalanced light conditions is different to the single marker detection. The illumination for every marker is different to each other in the multiple markers detection, which increases the difficulty to detect every marker at the same time. In this experiment, we test each AR system using planar markers to detect six markers as illustrated in Figure 5.2. This diagram also shows the illuminations for each marker. We calculate the average detection rate for the six markers in 5000 times measurements, and note the results in Table 5.2.
From the data in Table fig:fig5.2, we know ARTag and STAR with adaptive thresholding method can find every marker in the same time while other systems or methods only provide
Table 5.2: The detection rate for multiple markers detection under different illuminance ARTK ARTag ARTK+ STAR (Global) STAR (Adaptive)
52.28% ⃝ 66.56% 76.64% 99.92%
unstable results. Although the detection rate of our dynamic thresholding method is not as good as the adaptive thresholding method, it still performs better than original ARTK and ARTK+.
In these two experiments, we simulate the unbalanced light conditions and detect single marker and multiple markers, separately. In single marker detection part, the changing of the illuminance in the marker's region is not as dramatically as the changing in the whole frame, making the system can use the global thresholding method to detect marker. However, when the illuminance changes too much in marker's region, the global thresholding method cannot detect this marker correctly. This is an unusual situation and seldom happens in the daily life. Hence, we think global thresholding method suitable for single marker detection under unbal-anced lights. In the multiple markers experiment, the adaptive thresholding method is the most appropriate way to detect these markers under unbalanced lights.
5.3
Immunity to Partial Occlusion
This experiment is to find the maxima occluded area while the AR systems can still provide stable results. For some of the marker detection methods, such as Hirzer's method [13], can only detect markers occluded by light color objects. Thus, in the experiment, we will test the systems to detect markers occluded by different sized white triangles and black triangles. Figure 5.3 shows the makers occluded by different size of black triangles. The triangle with 2% of marker area only occludes the white periphery. And triangles with 5% and 10% marker area occlude the outer boundary of the black periphery while the 25% sized triangle can occlude the inner
2
2%
2
5%
2
10%
2
25%
2
32%
2
50%
none
outer boundary
Inner
boundary
inner pattern
Occluded
area
Figure 5.3: Markers occluded by different sized black triangles
Table 5.3: The detection rate for marker occluded by different sized white triangles Occluded area ARTK ARTag ARTK+ STAR
0% 100.00% ⃝ 99.92% 100.00% 2% 99.94% ⃝ 99.98% 100.00% 5% 0.00% ⃝ 2.44% 99.84% 10% 0.00% ⃝ 0.00% 98.76% 25% 0.00% × 0.00% 99.58% 32% 0.00% × 0.00% 99.62% 50% 0.00% × 0.00% 0.00%
boundary. The inner pattern is occluded by using triangles with size larger than 32% of the marker area. The detection rates of 5000 measurements for marker occluded by white and black objects are note in Table 5.3 and Table 5.4.
From the results in Table 5.3 and Table 5.4, most systems can't detect stably when the marker's inner pattern is occluded except STAR. ARTK and ARTK+ can't detect black periphery
Table 5.4: The detection rate for marker occluded by different sized black triangles Occluded area ARTK ARTag ARTK+ STAR
0% 100.00% ⃝ 99.92% 100.00% 2% 100.00% ⃝ 70.44% 100.00% 5% 0.78% ⃝ 99.44% 99.94% 10% 0.00% ⃝ 99.94% 99.74% 25% 0.00% × 19.78% 99.52% 32% 0.00% × 0.00% 95.38% 50% 0.00% × 0.00% 0.00%
(a)
(b)
Figure 5.4: Two examples of partial occluded marker detection by using STAR. (a) Use white object occlude marker's inner boundary, and (b) Use black object occlude marker's inner pattern.
occluded markers since the boundaries are not quadrangle shaped anymore, makes the makers regarded as background objects in the quadrangle detection step. Another system, ARTag, can detect markers while the outer boundaries are occluded, but still can't cope with inner pattern occluded markers. It is because the ID marker used in ARTag can't provide correct digital data to calculate marker ID while the inner pattern is occluded. And for our system, STAR, can detect markers with less than quarter of inner pattern area is occluded. With the help of boundary re-construction method and partial pattern matching techniques, STAR can give more stable results than other systems in this experiment. We show the two examples of partial occluded marker detection by using STAR in Figure 5.4.
5.4
Computational Performance
In this experiment, we test the computational performance for each AR system to find whether the systems can interact in the real time or not, which is one of the definitions of AR techniques. The computational performance is evaluated by calculating the frame rates for each
Table 5.5: The frame rate for different AR systems ARTK ARTag ARTK+ STAR (global) STAR (adaptive)
29.74 NA 29.80 29.74 19.71
system. We execute test programs on the Dual-core desktop which merge a green square on the marker after detecting it, decreasing the time to draw complex visual objects. The computational performance of 5000 frames is recorded in Table 5.5 by using FPS.
The computational performances of ARTK, ARTK+ and STAR with dynamic global thresh-olding method are very close to 30 FPS, the fastest frame rate supported by the camera. Cer-tainly, these AR systems can interact in real time. For ARTag, the system we can't measure the frame rate, can actually interact in real time while we using the demo program in the previous experiments. The last system, STAR with adaptive thresholding method, is slower than other AR systems. It's because the method needs to calculate three integral images, makes the com-putational performance not as good as other systems. However, the frame rate of this method is higher than 16 FPS, the lowest frame rate for human persistence of vision, and reaches the real time definition for AR technologies.
5.5
Summary
We demonstrated STAR's performance by conducting three experiments in this chapter. For unbalanced light detection, STAR improves the drawbacks of ARTK and ARTK+ and performs as well as ARTag. On the other hand, STAR can detect inner pattern occluded markers while other systems can't provide stable and correct results. Besides, STAR is suitable for general desktop computers to process in real time. In conclusion, STAR has better immunities for both light and partial occlusion than other AR systems.
Chapter 6
Conclusion and Future Work
In this research, we design an AR system, STAR, solving two major problems for existing AR systems using planar markers (1) unbalanced light detection, and (2) partial occluded marker detection. This system is based on ARTK system, but we design a series of new detection methods to replace the original ones, which can rebuild the missing boundaries while markers are partial occluded. To deal with the detection unbalanced lights, we propose a dynamic global thresholding method and an adaptive thresholding method for a user to select by the requirements and purposes. Besides, we also design three experiments to evaluate (1) lighting immunity, (2) partial occlusion immunity, and (3) computational performance for our system and other existing AR systems. These experiments demonstrate our system can deal with two major problems and performs better than other existing AR systems.
In the next step, we will make effort to improve the computational performance of the adap-tive thresholding method, and find other thresholding methods to detect multiple markers under unbalanced lights efficiently and stably. Simultaneously, we are trying to apply our AR sys-tem on human pose recognizers and human-computer interaction syssys-tems, hoping to get fruitful results in the near future.
References
[1] R. Azuma et al., ''A survey of augmented reality,'' Presence-Teleoperators and Virtual Environments, vol. 6, no. 4, pp. 355--385, 1997.
[2] C. Kirner, E. Zorzal, and T. Kirner, ''Case Studies on the Development of Games Using Augmented Reality,'' in IEEE International Conference on Systems, Man and Cybernetics, 2006. SMC'06, vol. 2, 2006.
[3] D. C. P.-L. Mariano Alcaniz, Manuel Contero and M. Ortega, ''Augmented reality technol-ogy for education,'' 2010.
[4] S. White, D. Feng, and S. Feiner, ''Interaction and presentation techniques for shake menus in tangible augmented reality,'' in Proceedings of 2009 IEEE International Symposium on Mixed and Augmented Reality, 2009, pp. 39--48.
[5] F. Zhou, H. Duh, and M. Billinghurst, ''Trends in augmented reality tracking, interaction and display: A review of ten years of ISMAR,'' in Proceedings of the 2008 7th IEEE/ACM International Symposium on Mixed and Augmented Reality-Volume 00. IEEE Computer Society, 2008, pp. 193--202.
[6] H. Kato, K. Tachibana, M. Billinghurst, and M. Grafe, ''A registration method based on texture tracking using artoolkit,'' in The Second IEEE International Augmented Reality Toolkit Workshop, Nishi-Waseda Campus, Waseda University, Tokyo, Japan, 7th October, 2003.
aug-mented reality conferencing system,'' in iwar. Published by the IEEE Computer Society, 1999, p. 85.
[8] ''Artoolkit,'' http://www.hitl.washington.edu/artoolkit/.
[9] D. Wagner and D. Schmalstieg, ''Artoolkitplus for pose tracking on mobile devices,'' in Computer Vision Winter Workshop. Citeseer, 2007, pp. 6--8.
[10] ''Artoolkitplus,'' http://studierstube.icg.tu-graz.ac.at/handheld_ar/artoolkitplus.php. [11] T. Pintaric, ''An adaptive thresholding algorithm for the augmented reality toolkit,'' in Proc.
of the Second IEEE Int'l Augmented Reality Toolkit Workshop (ART03). Citeseer, 2003. [12] M. Maidi, F. Ababsa, and M. Mallem, ''Vision-inertial tracking system for robust fiducials
registration in augmented reality,'' in Computational Intelligence for Multimedia Signal and Vision Processing, 2009. CIMSVP '09. IEEE Symposium on, march 2009, pp. 83 --90.
[13] M. Hirzer, ''Marker detection for augmented reality applications,'' 2008.
[14] M. Fiala, ''Designing Highly Reliable Fiducial Markers,'' IEEE Transactions on Pattern Analysis and Machine Intelligence, 2009.
[15] ''Artag,'' http://www.artag.net/.
[16] D. Bradley and G. Roth, ''Adaptive thresholding using the integral image,'' Journal of Graphics, GPU, Game Tools, vol. 12, no. 2, pp. 13--21, 2007.
[17] G. Moore and M. Gaithersburg, ''Automatic scanning and computer processes for the quan-titative analysis of micrographs and equivalent subjects,'' in Pictorial pattern recognition: proceedings. Thompson Book Co., 1968, p. 275.
[18] R. C. Gonzalez and R. E. Woods, Digital Image Processing (3rd Edition). Upper Saddle River, NJ, USA: Prentice-Hall, Inc., 2006.
[19] A. Rosenfeld and J. L. Pfaltz, ''Sequential operations in digital picture processing,'' J. ACM, vol. 13, no. 4, pp. 471--494, 1966.
[20] J. Prewitt, ''Object enhancement and extraction,'' Picture processing and Psychopictorics, pp. 75--149, 1970.