i
國
立
交
通
大
學
光電工程研究所
碩 士 論 文
應用於
2D/3D 切換影像之
快速反應菲涅爾液晶透鏡
Fast Response Multi-electrode Driving Fresnel Liquid Lens
For Auto-stereoscopic 2D/3D Switching Display
研 究 生:黃怡菁
指導教授:謝漢萍 博士
黃乙白 博士
ii
應用於
2D/3D 切換影像之
快速反應菲涅爾液晶透鏡
Fast Response Multi-electrode Driving Fresnel Liquid Lens
For Auto-stereoscopic 2D/3D Switching Display
研 究 生: 黃怡菁 Student:Yi-Ching Huang
指導教授: 謝漢萍 Advisor:Han-Ping D. Shieh
黃乙白
Yi-Pai Huang
國 立 交 通 大 學
光 電 工 程 研 究 所
碩 士 論 文
A DissertationSubmitted to Institute of Electro-Optical Engineering College of Electrical and Computer Engineering
National Chiao Tung University in partial Fulfillment of the Requirements
for the Degree of Master in
Electro-Optical Engineering 2010
Hsinchu, Taiwan, Republic of China
iii
應用於
2D/3D 切換影像之
快速反應多電極菲涅爾液晶透鏡
(MeD-Fresnel LC Lens)
碩士研究生:黃怡菁
指導教授:謝漢萍教授
黃乙白副教授
國立交通大學
光電工程研究所
摘
要
為了得到更自然的立體影像,近年來已有許多專家及廠商投入立體顯示器的 發展。大多數立體顯示器使用固定式的光學元件,但此種顯示器僅能提供3D 影 像,無法提供2D 影像。因此,可切換 2D、3D 影像顯示器的發展便顯得重要。 本論文的設計目標為低驅動電壓且能自由的快速切換於 2D 影像與 3D 影像 的光學元件(多電極菲涅爾液晶透鏡,MeD-Fresnel LC lens)。在模擬中,藉由設 計出其最佳結構,降低液晶層厚度達到可快速反應之Fresnel 透鏡曲線。實作後, 量測結果顯示在相同焦距下,MeD-Fresnel LC lens 的操作電壓 5 伏特遠低於傳統 液晶透鏡的30 伏特;而 MeD-Fresnel LC lens 可在低於 1 秒的時間內快速有效聚 焦,較傳統液晶透鏡的4~10 秒快速地多。若在操作電壓時搭配過電壓方式(Over-Drive method),MeD-Fresnel LC lens 的反應時間可大大再減低至僅 0.2 秒。 故此MeD-Fresnel LC lens 具有低驅動電壓、快速切換 2D、3D 影像等優點。較現 行之相關技術更易於在立體顯示器上實現。
iv
Fast Response Multi-electrode Driving
Fresnel Liquid Crystal Lens For
Autostereoscopic 2D/3D Switching Display
Student: Yi-Ching Huang Advisor: Dr. Han-Ping D. Shieh Dr. Yi-Pai Huang
Institute of Electro-Optical Engineering National Chiao Tung University
Abstract
Recently, many researchers invest in developing 3D display technology to produce more natural images from displays. Since most of display applications use the fixed optical components to display 3D images, the 2D images cannot be provided by the same displays. Thus, a 2D/3D switchable display is needed.
In this thesis, we designed an optical component which was driven by low operating voltage and can switch between 2D and 3D modes within a fast rate. In simulation, an optimized structure was designed to fit the Fresnel lens-like distribution to reduce the cell gap and achieve a fast switching rate. In experiment, the measurement result indicated that the Fresnel lens-like distribution and a fast switching rate (less than 1s) without using over-drive method were both achieved. Besides, with over-drive method, the switching time could be reduced to 0.2s, which was much shorter than the conventional structures (~ 4~10s). Moreover, the operating voltage (~5volts) was much lower than the conventional structures (~30volts).
In conclusion, the 3D display with the proposed structure not only has effective focusing ability and low operating voltage, but fast switching rate.
v
誌
謝
能夠順利完成本篇論文,首先要感謝我的指導教授謝漢萍教授以及黃乙白教 授。感謝老師帶領我進入顯示器領域,並且在求學與研究的過程中給予我許多指 導與鼓勵。在生活上,更從兩位教授身上學習到許多待人處事的方法,在此向兩 位教授致上最誠摯的謝意。 而兩年在實驗室裡的日子裡,我最為感謝的是致維哥與 TJ 學長,兩位學長 在這兩年中教導了我很多事情與概念,且總是在我遇到研究瓶頸的時候給我鼓勵、 推著我向前邁進,對我的論文及成長幫助有很大的幫助。此外,與芳正學長、凌 嶢學長、國振學長、精益學長、奕智學長、柏全學長、育誠學長、小皮學姐、正 咩學姐的討論與相處也讓我獲益匪淺;而與同學們,姚順、筱儒、期竹、景文、 世勛、耆賢、泳材、甫奕以及光電三俠一起切磋學習與成長的過程,更是我珍貴 的回憶。此外也很感謝雅惠姐以及實驗室的學弟妹們,與你們的相處讓我的碩士 生涯中充滿了樂趣。非常感謝大家,陪著我走過了這兩年的歲月。 最後,我要感謝我的家人,因為有你們的鼓勵與支持付出,我才能夠順利的 完成碩士學業,從夢寐以求的交大畢業。千言萬語也道不盡我心中的感激,謝謝 所有陪伴與關懷我的人,感謝你們!!vi
Table of Contents
摘
要 ... iii
Abstract ... iv
誌
謝 ... v
Figure Captions ... viii
List of Tables ... xii
Chapter 1 ... 1
1.1 Preface ... 1 1.2 Principle of 3D image ... 2 1.3 3D display technologies ... 4 1.3.1 Stereoscopic displays ... 5 1.3.2 Auto-stereoscopic displays... 51.3.3 Multiplexed 2D type display ... 5
1.3.4 2D/3D switching methods... 9
1.4 Introduction to liquid crystal ... 13
1.5 Liquid crystal lens (LC lens) ... 15
1.6 LC lens with 2D/3D switching ... 18
1.6.1 Active LC lenticular lens ... 19
1.6.2 Polarization active micro-lens... 20
1.6.3 Multi-electrode driven liquid crystal lens (MeD-LC Lens) ... 21
1.7 Motivation and objective ... 22
1.8 Organization ... 22
Chapter 2 ... 23
2.1 Introduction ... 23 2.2 Fabrication process ... 23 2.3 Measurement system ... 29Chapter 3 ... 32
vii
3.1 Introduction to MeD-Fresnel LC lens ... 32
3.2 Design of MeD-Fresnel LC lens ... 33
3.2.1 Fresnel lens ... 35 3.2.2 Simulation steps ... 35 3.2.3 Simulation result ... 36 3.3 Discussion ... 40 3.4 Summary ... 42
Chapter 4 ... 43
4.1 Introduction ... 43 4.2 Measurement results ... 434.2.1 Reconstruction of the MeD-Fresnel LC lens ... 44
4.2.2 Operating voltage and response time ... 45
4.2.3 Crosstalk phenomenon ... 50
4.3 Summary ... 52
Chapter 5 ... 54
5.1 Conclusions ... 54
5.2 Future work ... 55
5.2.1 Simple circuit fabrication ... 55
5.2.2 Full resolution 3D image ... 56
viii
Figure Captions
Fig. 1-1 History of display technology. ... 1
Fig. 1-2 Depth cues. ... 2
Fig. 1-3 Vergence angle. ... 3
Fig. 1-4 Accommodation. ... 3
Fig. 1-5 Horizontal disparity. ... 4
Fig. 1-6 Classification of 3D display technology. ... 4
Fig. 1-7 General ideas of the time and spatial multiplexed type. ... 6
Fig. 1-8 3D display based on sequentially switching backlight with focusing foil. ... 6
Fig. 1-9 Spatial multiplexed displays: parallax barrier. ... 7
Fig. 1-10 Spatial multiplexed displays: lenticular array lens. ... 8
Fig. 1-11 Slanted lenticular lens 3D display with multi-view by the Philips company. 8 Fig. 1-12 2D/3D switching display with Active Parallax Barrier. ... 10
Fig. 1-13 Basic concepts of lens switching method. ... 12
Fig. 1-14 Geometry to calculate refractive index change with liquid crystal molecule orientation. ... 14
Fig. 1-15 Conventional lens. ... 15
ix
Fig. 1-17 The geometry of the focused GRIN Lens. ... 16
Fig. 1-18 Structure of the traditional LC cylindrical lens. ... 18
Fig. 1-19 Principle of active LC lenticular lens. ... 20
Fig. 1-20 Principle of polarization switch LC lens. ... 20
Fig. 1-21 Principle of the MeD-LC lens. ... 21
Fig. 2-1 Fabrication steps. ... 24
Fig. 2-2 Schematic picture of step1 and step 5. ... 25
Fig. 2-3 The mask pattern of top substrate and bottom substrate. ... 26
Fig. 2-4 Flow of fabricating ITO electrodes, ... 27
Fig. 2-5 Prototype of MeD-Fresnel LC lens. ... 28
Fig. 2-6 Experimental setup. ... 29
Fig. 2-7 Schematic picture of confocal microscopy. ... 30
Fig. 2-8 Confocal microscope system. ... 31
Fig. 2-9 Light intensity photos of 3rd, 6th and 9th layers inside the MeD-Fresnel LC lens by confocal microscopy. ... 31
Fig. 3-1 Concept of the MeD-Fresnel LC lens: (a) Lens-off state for 2D mode, and (b)Lens-on state for 3D mode. ... 33
Fig. 3-2 MeD-Fresnel LC lens structure. ... 34
Fig. 3-3 Refractive index distribution of the conventional MeD-LC lens with (a) outer electrodes, and (b) inner electrodes. ... 34
x
Fig. 3-4 Cross section of (a) lenticular lens and (b) Fresnel lens. ... 35
Fig. 3-5 Concept of MeD-Fresnel LC lens: Fresnel lens + MeD-LC lens = MeD-Fresnel LC lens. ... 35
Fig. 3-6 (a) Structure of flat electrode as the bottom electrode, (b) Structure of multi-electrode as the bottom electrode, and (c) Simulation Fresnel lens curves of different bottom electrode form. ... 37
Fig. 3-7 (a) Structure of electrode width to slit width ratio as 1:1, (b) Structure of electrode width to slit width ratio as 2:1, and (c) Simulation Fresnel lens curves of different electrode width to slit width ratio. ... 38
Fig. 3-8 Simulation result of error function (EF) with electrode width. ... 39
Fig. 3-9 Equivalent Fresnel lens of the optimized MeD- Fresnel LC lens. ... 39
Fig. 3-10 Cross-section of the operated MeD-Fresnel LC lens. ... 40
Fig. 3-11 (a) Structure of the MeD-Fresnel LC lens without alignment issue, (b) Structure of the MeD-Fresnel LC lens with alignment displacement 5.3μm, and (c) Simulation Fresnel lens curves with and without the alignment issue. ... 41
Fig. 4-1 MeD-Fresnel LC lens prototype. ... 44
Fig. 4-2 Light intensity distribution images inside the MeD-Fresnel LC lens. ... 44
Fig. 4-3 Equivalent Fresnel lens shape of simulation and experimental results. ... 45
Fig. 4-4 (a) Captured image of the MeD-Fresnel lens before applying voltage, (b) Captured image of the MeD-Fresnel lens after applying voltage, and (c) Focusing measurement of the MeD-Fresnel LC lens. ... 46
xi
Fig. 4-5 Sequential focusing images of the MeD-Fresnel LC lens. ... 47
Fig. 4-6 Concept of the over-drive method. ... 48
Fig. 4-7 Sequential focusing images of the MeD-Fresnel LC lens with over-drive method. ... 48
Fig. 4-8 Relationship between focusing ability and response time of the LC lenses. . 49
Fig. 4-9 Relationship between focusing ability and response time of the MeD-Fresnel LC lens. ... 50
Fig. 4-10 Light intensity distribution of the MeD-Fresnel LC lens with 6 view. ... 51
Fig. 5-1 Structure of the MeD-Fresnel LC lens with High-R material. ... 55
Fig. 5-2 Diagram of an auto-stereoscopic full resolution 3D display. ... 56
Fig. 5-3 Scheme of scanning LC lens. ... 57
Fig. 5-4 A 4-inch MeD-Fresnel LC lens array. ... 58
Fig. 5-5 Captured images of the MeD-Fresnel LC lens array: (a) before applying voltage, and (b) after applying voltage. ... 58
Fig. 5-6 Captured images of the scanning MeD-Fresnel LC lens. ... 59
xii
List of Tables
Table. 1-1 2D/3D LC lens switching methods. ... 19 Table. 3-1 Relative parameters of the optimized MeD-Fresnel LC lens. ... 40 Table. 4-1 Comparison of conventional LC lenses and the MeD-Fresnel LC lens. .... 53 Table. 5-1 Relative MeD-Fresnel LC lens parameters for a 4-inch display. ... 57
1
Chapter 1
Introduction
1.1 Preface
After the cathode ray tube (CRT) was invented in 1897, display technologies have developed over the least hundred years as shown in Fig. 1-1. From black and white CRTs to colorful CRTs to flat panel displays, display developments were motivated by trying to satisfy human visual pleasure. To produce more natural images, the high-definition television (HDTV) was developed. However, the techniques above are used for 2D displays and the image quality for these displays lacks reality due to two-dimensional images expression.
Though human vision, the 3D image is closer to the real world image due to the extra details it provides, such as relative depth. Thus the 3D image has higher reliability for displaying image information. To produce more natural images from display, 3D display technologies are expected to be the dominant next generation display technology.
2
1.2 Principle of 3D image
The main mechanism for observing 3D images is a viewpoint dependent disparity between the images received by each eye. From the slight differences in the two images projected on the retina of the eyes, the human brain converges the two images and give a sensation of depth though a process known as stereopsis [1] [2].
The human visual system interprets the two images on the retina though three depth cues, oculomotor, monocular and binocular depth cues [3] [4], as shown in Fig. 1-2.
Fig. 1-2 Depth cues.
Oculomotor depth cues are caused by the feedback from the eye muscles used to control vergence and accommodation. Vergence is the angle at which the eyes must cross, in order to center on the object. The human brain can adjust the object distance by vergence angle degree, as shown in Fig. 1-3. Accommodation means the change of eye lens shape which helps the human brain to distinguish object distance, as shown in Fig. 1-4.
3
Fig. 1-3 Vergence angle.
Fig. 1-4 Accommodation.
Redundancy is built into the visual system, even people with monocular vision are able to perform well when judging depth in the real world. The number of cues present in 2D images contribute to a sense of depth, such as motion parallax, shading, occlusions, relative size, fogging, texture gradient and perspective distortion, as shown in Fig. 1-2.
According to statistics, the average distance between human eyes is approximately 65mm. Due to the different positioning of left and right eyes, the images projected on the retina have slight differences, called binocular disparity. Binocular disparity includes angular and horizontal disparity and causes binocular depth cues. Angular disparity is known as vergence. Horizontal disparity is the distance between points in the scene appearing in the image projected on the retinal plane, as shown in Fig. 1-5.
4
Fig. 1-5 Horizontal disparity.
Although humans perceive depth information by the cues mentioned above, a display system cannot produce 3D information though occulomotor depth cues. Therefore, a 3D display system must use monocular and binocular depth cues to produce 3D information.
1.3 3D display technologies
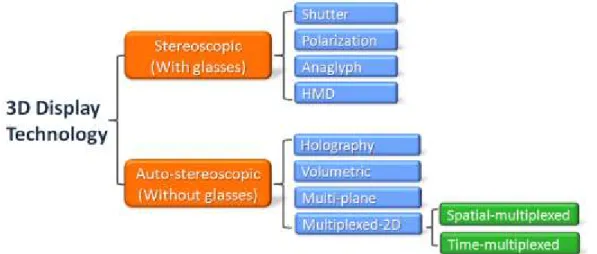
Nowadays, 3D display technologies are in two groups, Stereoscopic and Auto-stereoscopic (with and without glasses), as shown in Fig. 1-6.
5
1.3.1 Stereoscopic displays
Stereoscopic displays require users to wear a device to ensure the left and right images are seen by the correct eye. For instance, the display provides images with two polarization states (ex. Left- circular and right-circular polarization), the polarization glasses (composed of two different polarization lenses) block light with different polarization, and let the same polarization light pass though. Thus, left and right eyes receive different images and observe 3D images. However, glasses are costly and inconvenient for users to wear.
1.3.2 Auto-stereoscopic displays
Auto-stereoscopic displays do not require users to wear any device and can separate left and right images to the correct eye. There are several technologies which can produce 3D images, such as the holographic type [5], volumetric type [6], multi-plane type, and multiplexed-2D type. The previous three techniques produce 3D images directly as seen in the real world, but they have drawbacks such as: the holographic type is hard to produce on a large scale, the volumetric type is too bulky, and the multi-plane type has an alignment issue and users can only receive the images from a single front display angle.
For the past few years, many researchers have providing different images to both eyes from different viewing angles with the same display system. This method is known as the “Multiplexed-2D type”.
1.3.3 Multiplexed 2D type display
Multiplexed-2D type display can be divided into two parts: time-multiplexed and spatial-multiplexed. The general ideas of time-multiplexed type and
6
spatial-multiplexed type are shown in Fig. 1-7. The time-multiplexed type divide the images into left and right images and project to left and right eyes sequentially. On the other hand, the spatial-multiplexed type provide the left and right images to both eyes simultaneously. These multiplexed systems all require optical components and liquid crystal displays (LCDs) to project images into the left and right eyes.
Fig. 1-7 General ideas of the time and spatial multiplexed type.
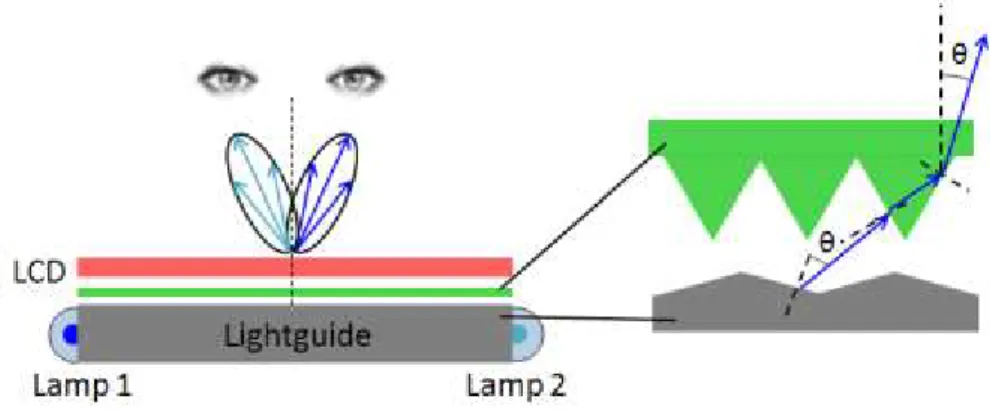
Many kinds of time-multiplexed configurations had been proposed [7] [8] [9]. One configuration used the principle of total internal reflection (TIR) to reflect the light to a certain direction, as shown in Fig. 1-8 [10]. By switching two light sources sequentially, the light was directed to a certain direction. Therefore 3D images were observed.
7
In the spatial-multiplexed type, there are also many methods such as parallax barrier [11] [12] and lenticular lens array [13] [14]. These optical components are used to project the left and right images into different viewpoints, and have been widely used in 3D display technologies. The basic principles of the auto-stereoscopic displays are illustrated in the following section.
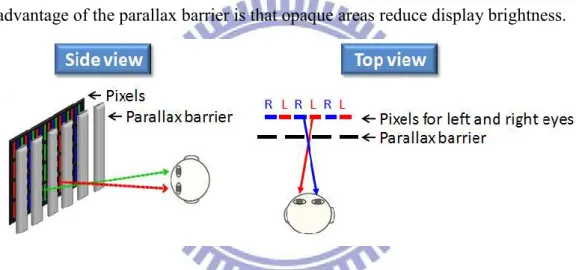
Parallax barrier
The parallax barrier uses a series of opaque vertical lines to block light from certain sub-pixels to the viewer’s left and right eyes as shown in Fig. 1-9. By optimizing the barrier geometry, the viewing window position and angles can be adjusted. The main disadvantage of the parallax barrier is that opaque areas reduce display brightness.
Fig. 1-9 Spatial multiplexed displays: parallax barrier.
Lenticular lens array
The lenticular lens array uses lenslets accurately attachs to the display. These lenses change the light path of certain sub-pixels and project into viewer’s left and right eyes as shown in Fig. 1-10. The main advantage of the lenticular lens array is high brightness, but the disadvantage is the resolution reduction in horizontal direction.
8
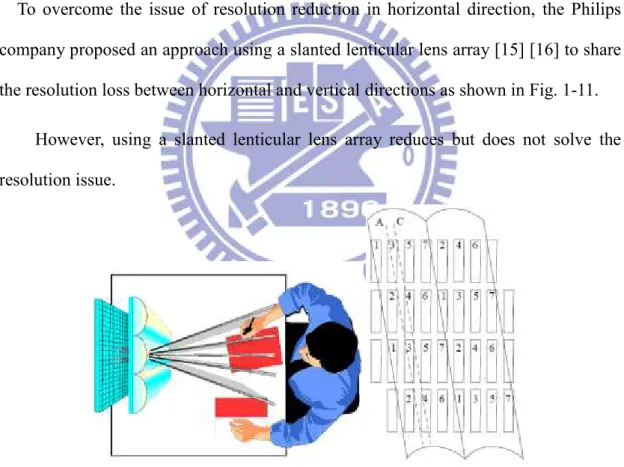
Fig. 1-10 Spatial multiplexed displays: lenticular array lens.
To overcome the issue of resolution reduction in horizontal direction, the Philips company proposed an approach using a slanted lenticular lens array [15] [16] to share the resolution loss between horizontal and vertical directions as shown in Fig. 1-11. However, using a slanted lenticular lens array reduces but does not solve the resolution issue.
9
1.3.4 2D/3D switching methods
The 2D/3D switching ability gives significant advantages to users who need both display types. Most users prefer to have a 2D/3D switchable display, because they do not want to have two displays on their desk.
If a 3D auto-stereoscopic display is used to show 2D information, both left and right eyes are still viewing a subset of pixels. The distorted effect is observed although the data no longer provides a stereo image pair. Thus, turning off the 3D function while viewing 2D images is desirable.
There are a number of display type can switch between 2D and 3D images. The current technologies for 2D/3D switching include active parallax barriers [17] and polarization activated micro lenses [18] [19] [20] [21].
Active parallax barrier
The parallax barrier is able to block light, thus giving switching flexibility between 2D and 3D displays as show in Fig. 1-12. When the voltage is off, the parallax barrier has no function and light transmit completely. When the voltage is on, the device acts as a spatial-multiplexed parallax barrier type. However, the drawback of the active parallax barrier is low brightness when displaying 3D images due to light being absorbed by barrier patterns.
10
Fig. 1-12 2D/3D switching display with Active Parallax Barrier.
Active Micro Lens
Equipping LCD with a lenticular lens array is a viable route to achieve multi-view 3D displays. Using a display with an active switchable LC lenticular lens array shows natural 3D images as well as high-resolution 2D images [22].
Among various types of 3D displays, switching methods can be divided into two categories: the control of transmittance, and the control of light direction. The former method controls the transmittance of stripe barrier patterns using a liquid crystal parallax matrix. But the low brightness is a serious limitation in 3D display modes.
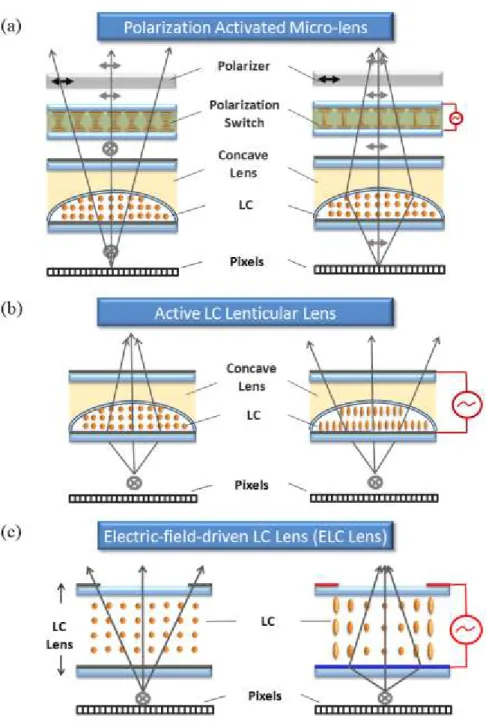
In the controlling optical path method, lens-switching components are introduced, such as polarization activated micro-lens [23], active LC lenticular lens [17] [24], and electric-field driven LC lens (ELC lens) [19]. In polarization activated micro-lens, anisotropic lens and polarization switching cell are used together to control the direction of polarized light as shown in Fig. 1-13(a). In an active LC lenticular lens array, concave lens patterns are formed inside the switching LC cell and the refractive
RIGHT EYE LEFT EYE BACKLIGHT RIGHT EYE LEFT EYE BACKLIGHT SWITCH LCD STANDARD LCD GLASS PIXELS TRANSPARENT PATTERNED ELECTRODE POLARIZER BARRIER ENABLED PARALLAX BARRIER
11
index difference between the LC and the geometrical concave shape controls the direction of incident light as shown in Fig. 1-13(b). However, these designs are not compatible with current liquid crystal displays (LCDs) production infrastructure. Besides, complete lens-off state is difficult to achieve dues to a residual index mismatching around the interface between the concave structure and liquid crystal molecules. In ELC lens, the LC director distribution under controlled non-uniform electric field distribution causes lens effect. And 2D/3D switching is solely achieved by the lens effect.
To realize how liquid crystal works inside the LC lens, the following sections will introduce the principle of liquid crystal and the LC lens.
12
Fig. 1-13 Basic concepts of lens switching method.
(a) It is caused by the polarization switching of LC under anisotropic lens.
(b) The on/off switching is driven by the change of LC convex lens under the concave structure.
13
1.4 Introduction to liquid crystal
Liquid crystal can be divided into two groups: positive and negative dielectric anisotropy. In positive dielectric anisotropy, the component along the optical axis is greater than the component perpendicular to the optical axis ( ). These kinds of LC molecules align parallel to an applied field. If the reverse is true ( ), the LC molecules align perpendicular to an applied field, and this kind of LC is called negative dielectric anisotropy. Both of these two LC types can be applied to a liquid crystal lens [25].
Liquid crystals are characterized by an orientation order of their constituent rod-like molecules. In nematic LC, orientation order has uni-axial symmetry, and the axis is parallel to a unit vector , called the “director”. By applying curtain voltage, the LC orientation changes and causes the change of the refractive index of the LC layer. While light passes through the LC layer, the light direction will be changed due to the change of the refractive index.
In Fig. 1-14, assume the light propagates in the z direction and polarized in the x direction. When the LC axial is not rotated, the light will be affected by the refractive index . When the LC axial is rotated with an angle θ, the light will be affected by both and . The slice of the indicatrix can be expressed as Eq.1-1.
14
Fig. 1-14 Geometry to calculate refractive index change with liquid crystal molecule orientation.
(1-1) And
(1-2) Therefore, Eq.1-1 can be written as Eq.1-3.
(1-3) Equivalently, (1-4)
Thus, the equivalence equation of rotation angle can be derived as Eq.1-5.
(1-5) Since the nematic liquid crystal does not align uniformly across the cell, a more useful form to solve the is Eq.1-6.
15
(1-6)
This expression gives the refractive index for light polarized in the x direction and propagates in the z direction as a function of the angular orientation of the nematic liquid crystals in the x-z plane. Therefore, when the LC direction is no longer perpendicular or parallel to the x direction, Eq.1-6 can be applied.
1.5 Liquid crystal lens (LC lens)
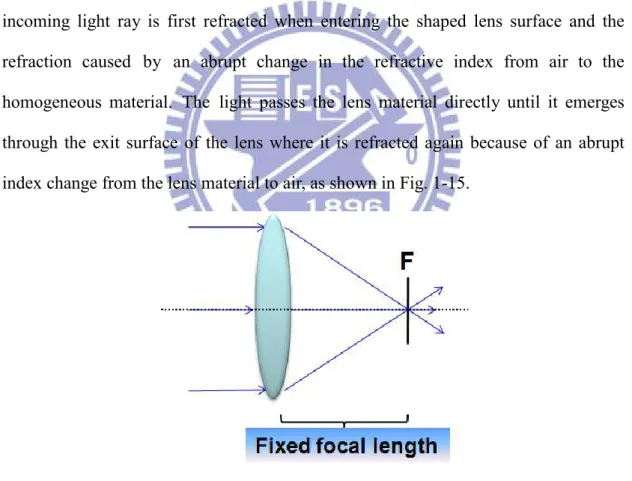
A conventional lens explains how the Gradient Index Lens (GRIN lens) works: An incoming light ray is first refracted when entering the shaped lens surface and the refraction caused by an abrupt change in the refractive index from air to the homogeneous material. The light passes the lens material directly until it emerges through the exit surface of the lens where it is refracted again because of an abrupt index change from the lens material to air, as shown in Fig. 1-15.
Fig. 1-15 Conventional lens.
GRIN is short for graded-index or gradient index which can refers to an optical element in which the refractive index varies. More specifically (from the Photonics
16
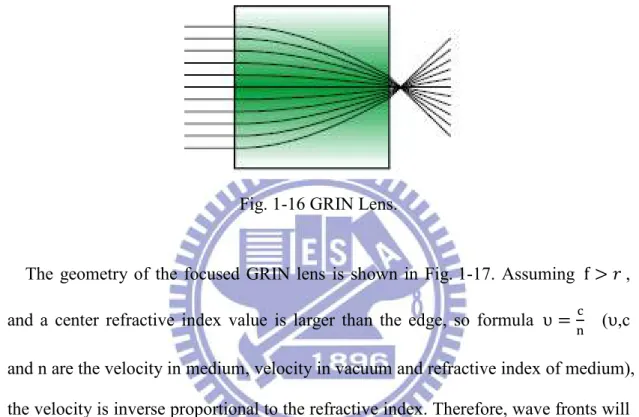
Dictionary), a GRIN lens is a lens whose material refractive index varies continuously as a function of spatial coordinates in the medium. Additionally, a graded-index fiber describes an optical fiber having a core refractive index that decreases almost parabolically and radially outward toward the cladding as shown in Fig. 1-16. However, the focal length of GRIN lens is fixed [27] [28].
Fig. 1-16 GRIN Lens.
The geometry of the focused GRIN lens is shown in Fig. 1-17. Assuming , and a center refractive index value is larger than the edge, so formula ( ,c and n are the velocity in medium, velocity in vacuum and refractive index of medium), the velocity is inverse proportional to the refractive index. Therefore, wave fronts will slow down when reaching the dense region and speed up in rare regions. In this case, the GRIN lens can be focused.
17
A ray traversing the lens on the optical axis passes along the optical path length (OPL), as . For a ray traversing at a height ,
overlooking the slight bending of ray path, . Since a planer wave front must be bent into spherical wave fronts, the OPLs from one wave to another, along any route, must be equal as follows,
(1-7) and (1-8) By substitution, (1-9)
where is the refractive index difference between the center and the edge ( ), if can be neglected, the focusing formula can be obtain by Eq.1-10.
(1-10) By substitution,
(1-11) where can be written as a parabolic function with a constant ,
(1-12) As a result, if the refractive index drops off parabolically from its high along the central axis, the GRIN lens would focus at point F. However, GRIN lens can only be operated as a lens with a fixed focal length. Hence, the application of LC lens must become practical. The LC lens acts as a GRIN lens with variable focal length and a normal layer with a certain refractive index though controlling the LC direction. Thus, 2D/3D switching ability can be achieved.
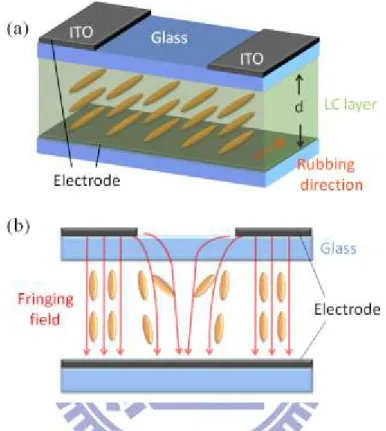
18
by applied voltages between two parallel electrodes, owning to the fringing field effect, as shown in Fig. 1-18(b). When light passes though the LC layer, the phase retardation changes and the LC layer works as a lens, and refracts light to different angles due to the different refractive indexes.
Fig. 1-18 Structure of the traditional LC cylindrical lens. (a) Top view and (b) Side view.
1.6 LC lens with 2D/3D switching
As mentioned in section 1.3.4, there are various methods which achieve 2D/3D switching, such as active LC lenticular lens and polarization active micro-lens. The catalogue of 2D/3D LC lens switching methods was shown in Table. 1-1.
19
Table. 1-1 2D/3D LC lens switching methods.
1.6.1 Active LC lenticular lens
A fixed concave lens pattern was formed inside the cell and the LC molecules (positive dielectric anisotropy) were placed between the concave lens and bottom substrate, as shown in Fig. 1-19. The refractive index of the concave lens was . If incident light from the underlying LCD display with polarization state perpendicular to the plane, it encounters a refractive index from high to low ( ) within the cell, resulting in a net lens-action to form 3D images.
If a voltage is applied to the lens cell, the extra-ordinary axis of the LC is aligned parallel to the lens axis. Therefore, the incident light encounters the lower refractive index corresponding to the ordinary axis of the LC. Since the ordinary refractive index matches the refractive index of the concave lens, the lens is effectively switched off and 2D images can be perceived.
20
Fig. 1-19 Principle of active LC lenticular lens.
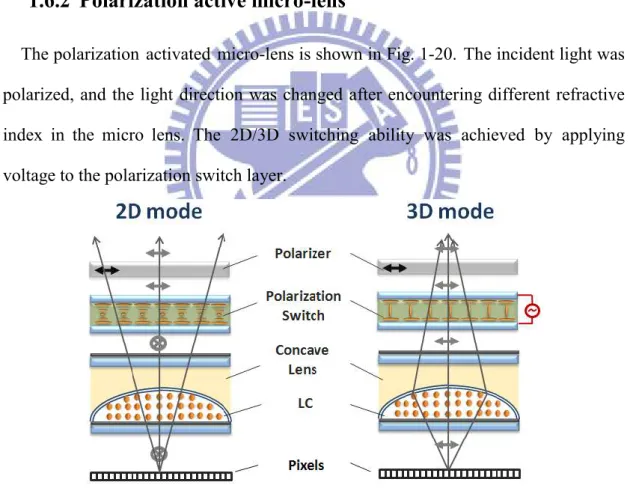
1.6.2 Polarization active micro-lens
The polarization activated micro-lens is shown in Fig. 1-20. The incident light was polarized, and the light direction was changed after encountering different refractive index in the micro lens. The 2D/3D switching ability was achieved by applying voltage to the polarization switch layer.
Fig. 1-20 Principle of polarization switch LC lens.
However, these two methods have some disadvantages, such as mismatching of LC alignment at the interface of the concave lens, as well as incompatibly with current LC
21
display production process. To overcome these issues, the Multi-electrode driven liquid crystal lens (MeD-LC Lens) was invented.
1.6.3 Multi-electrode driven liquid crystal lens (MeD-LC Lens)
The basic concept of one MeD-LC lens pitch [29] is shown in Fig. 1-21. At the voltage off state, incident light passes through the MeD-LC lens cell without change of propagation direction. After applying certain voltages, local electric fields are formed. The electric field at the lens edge is stronger than at the lens center. This non- uniform distribution of the electric field causes a non-uniform tilt angle of the LC director and the refractive index changes accordingly. Therefore, a phase difference was achieved and results in the change of light direction. In this case, 3D images can be perceived.
Fig. 1-21 Principle of the MeD-LC lens.
However, the MeD-LC lens has some drawbacks, such as high operating voltage (about 30 Vrms) and long response time of switching between 2D and 3D images
22
1.7 Motivation and objective
Display developments were driven by the desire to give people more realistic images. 3D displays have attracted the most interest. People want to see an image as naturally as possible. However, 3D displays still encounter many issues which needed to be improved. The parallax barrier 3D display has less light efficiency than lenticular lens 3D display. But the lenticular lens 3D display still looses resolution. And resolution loss depends on how many views the display can provide. Additionally, lenticular lens 3D display is not able to switch between 2D and 3D images. Therefore, some 2D/3D switching methods using LC lens were proposed but still faces issues of LC alignment mismatching at the interface of the concave lens, high operating voltage and long response time.
In order to improve the mentioned issues, the Multi-Electrode Driving Fresnel
Liquid Crystal Lens (MeD-Fresnel LC lens) for fast 2D/3D switching display was
proposed in this thesis. Compared with prior switching LC lens for 3D display, the MeD-Fresnel LC lens has lower operating voltage and shorter response time.
1.8 Organization
This thesis is organized as follows: the fabrication process of the MeD-Fresnel LC lens will be introduced in detail in Chapter 2. Additionally, this chapter also shows the major instruments used to measure the MeD-Fresnel LC lens. In Chapter 3, the design and simulation result of the MeD-Fresnel LC lens and discussion will be presented. The experimental results and summary will be shown in Chapter 4. Finally, conclusions and future work of this thesis will be discussed in Chapter 5.
23
Chapter 2
Fabrication and measurement Instruments
2.1 Introduction
The MeD-Frensel LC lens fabrication process was described in this chapter. The thickness of substrate glass was 700μm. After the standard cleaning process, the semiconductor process including spin coating, lithography, sputtering and leave-off was utilized in order to obtain the desired indium-tin oxide (ITO) pattern. Followed, the LC alignment layer was made by spin coating and rubbing techniques. Next, the top and bottom glasses were assembled with cell gap about 28μm and filled in the LC (E7). Finally, wires for various voltage driving were connected to each electrode.
2.2 Fabrication process
This section described the fabrication process in detail, including spin coating, lithography, wet etching, sputtering, leave-off, rubbing and assembling. The detail fabrication steps were listed below and as shown in Fig. 2-1.
24
25
I. Glass cleaning
For display application, glass is widely used as a substrate. In the fabrication, the glass of 0.7 mm thick was chosen. And the detailed sequence is as follow:
Step 1 : Place the glasses on the Teflon carrier, and put into a container with acetone as shown in Fig. 2-2. Ultrasonic vibrate for 20 minutes to remove the organic contamination on the glasses.
Step 2 : Rinse the glasses by DI water for 1 minute. Step 3 : Rubbing the glasses with detergent by hands. Step 4 : Rinse the glasses by DI water for 1 minute.
Step 5 : Place the glasses on the Teflon carrier, and put into a container with DI water as shown in Fig. 2-2. Ultrasonic vibrate for 40 minutes to remove the remained particle and detergent on the glass.
Step 6 : Use N2 purge to dry the glasses, and place glasses into a glass container with
a cover.
Step 7 : Put the glass container into an oven with 110℃ for 30 minutes.
26
II. ITO pattering
The detailed sequence is as follow and also can refer to Fig. 2-4.
Step 1 : Before the lithography process, glass substrate was cleaned by step I.
Step 2 : Put the glasses on the metal holder and put into the HMDS oven to eliminate the surplus steam and improve the adhesion between organic photoresist and the glass substrate.
Step 3 : A positive photoresist was applied and coated on the glass substrate.
Step 4 : Soft bake for one and a half minutes, to eliminate most of the solvent of the photoresist and enhance the adhesion.
Step 5 : Expose the glass with ultra-violet (UV) light source through shadow mask for 40 seconds. Consequently, the pattern on the mask was transformed to the positive photoresist after developing. The mask is as shown in Fig. 2-3. Step 6 : Check the pattern by optical microscope (OM), to see if there is any broken
line.
Step 7 : Sputter ITO upon the patterned photoresist.
Step 8 : Use leave-off technique to remove the phtotresist, and the desired ITO pattern can be reserved.
27
Fig. 2-4 Flow of fabricating ITO electrodes, (a) glass substrate,
(b) spin-coating Positive photoresist upon the glass substrate, (c) using lithography technique to obtain the latent image, (d) sputtering ITO upon the patterned photoresist, and
(e) using leave-off technique to remove phtotresist and reserve the desired ITO pattern.
28
III. LC Alignment Layer and Assembling
Step 1 : Cleaning the patterned glass with step I.
Step 2 : Put the glasses into the O-zone machine for 20 minutes to eliminate the organics on the glasses. This step makes the coating more efficiently.
Step 3 : Coating the solvent to make the PI adhesion more efficiently. Step 4 : Coating the PI.
Step 5 : Put the glasses into an oven with 220℃ for 60 minutes. Step 6 : Rubbing the glasses and make the rubbing direction mark.
Step 7 : Apply the ultra-violet (UV) glue mixed with spacer (28μm) on two sides of bottom glass.
Step 8 : Put the bottom glass on the top glass and fixed with a tape.
Step 9 : Press both top and bottom glasses to make sure the cell gap identically. Step 10 : Fill in the LC after curing.
Step 11 : Seal the edge with UV glue and curing.
Next, the ultrasonic solder was soldered on the electrode to enhance the adhesive of the solder and smeared with AB glue to avoid the wires coming off. Finally, the Multi-electrode Driving Fresnel Liquid Crystal Lens (MeD-Fresnel LC lens) will be measured.
29
2.3 Measurement system
I. CCD System
After the fabrication process, the optical properties of the MeD-Fresnel LC lens were measured by CCD. And the experimental setup was shown in Fig. 2-6. At first, the polarizer was set to be parallel to the electrode direction of the MeD-Fresnel LC lens. The LC direction was controlled by the voltage and the MeD-Fresnel LC lens was able to act as a Fresnel lens and focused at a certain point. By placed CCD at the focal point of the MeD-Fresnel LC lens, the intensity image and beam size of the MeD-Fresnel LC lens could be measured.
30 II. Confocal Microscope System
To compare the refractive index of the simulation and experimental results, the confocal microscope was used to analysis the light intensity distribution of each layer inside the MeD-Fresnel LC lens.
The schematic picture and the photo of confocal microscopy were shown in Fig. 2-7 and Fig. 2-8. Light source passes though the first pinhole and focused on the focal plane (F-plane as shown in Fig. 2-7) which is one LC layer (~3μm) inside the MeD-Fresnel LC lens. Due to the light source and the photomultiplier tube (PMT) have the common focal plane, the light intensity distribution of the F-plane can be detected by the PMT. And due to the PMT detects lights only from the F-plane, the recorded images have high resolution and low backdrop noise. By changing the z position of the F-plane, the MeD-Fresnel LC lens can be divided into 10 layers, and the light intensity distribution of each layer can be detected by the PMT as shown in Fig. 2-9. After light intensity was measured, the LC tilt angle of each layer inside the MeD-Fresnel LC lens can be calculated from , and the effective refractive index nθ can also be calculated from Eq.1-6. Then the optical path
difference between each point in one layer can be obtained. By averaging 10 layers, the total refractive index and optical path difference of the MeD-Fresnel LC lens can be obtained.
31
Fig. 2-8 Confocal microscope system.
Fig. 2-9 Light intensity photos of 3rd, 6th and 9th layers inside the MeD-Fresnel LC lens by confocal microscopy.
In our experiment, the MeD-Fresnel LC lens was measured by these two methods. And the results will be given in chapter 4.
32
Chapter 3
Design of Multi-electrode Driving Fresnel
Liquid Crystal Lens (MeD-Fresnel LC Lens)
The structure design and the simulation result of MeD-Fresnel LC lens were described in this chapter. At first, the MeD-Fresnel LC lens switching idea was illustrated. Second, the concept of Fresnel lens, the simulation steps and results were clarified. Third, the mismatch issue of double layer multi-electrode structure was discussed. Finally, a brief summary was given.
3.1 Introduction to MeD-Fresnel LC lens
The MeD-Fresnel LC lens switching concept is shown in Fig. 3-1. At the Lens-off state (without applying voltage), incident light passes though the structure directly and formed 2D images. At the Lens-on state (applying voltage), a non-uniform electric field distribution is developed and causes a non-uniform LC tilt angle distribution. Thus the equivalent refractive index distribution of the LC tilt angle is also non-uniform. For the incident light with linear polarized direction parallel to the rubbing direction, the wavefront is affected by the non-uniform refractive index distribution, and the propagation direction is changed. Eventually, the images are refracted to different angles and form 3D images.
33
Fig. 3-1 Concept of the MeD-Fresnel LC lens: (a) Lens-off state for 2D mode, and (b)Lens-on state for 3D mode.
3.2 Design of MeD-Fresnel LC lens
As mentioned in 1.6.3, the MeD-LC lens has drawbacks such as high operating voltage and long response time of switching between 2D and 3D images. From the LC rise time and decay time formula as shown in Eq.3-1(γ 1 is the LC rotational viscosity,
d is the LC cell gap, K is the LC elastic constant, Vth is the threshold voltage, V is the
applied voltage, and Vb is the bias voltage) [30], the LC response time can be further
reduced by decreasing the LC cell gap. τ γ π (3-1) τ γ π (3-1) Otherwise, to reduce the operating voltage, a double-layer multi-electrode must be arranged in order within the LC device, as shown in Fig. 3-2. For the MeD-LC lens, the outer electrode made the electric field distribution smooth and continuous in the LC cell, thus the refractive index distribution was close to the ideal curve, as shown in Fig. 3-3(a). If the electrodes were inside the cell, the discrete electric field would appear
34
due to the grating structure, as shown in Fig. 3-3(b). However, the Fresnel lens is a combination of discrete prisms, thus the discrete electric field is useful for building Fresnel LC lens. Hence, the proposed MeD-Fresnel LC lens with low operating voltage was obtained. The width of each electrode was the same and the LC director was homogeneously aligned parallel to the electrode. And the specific operating voltages were supplied to each electrode with respect to one lens pitch of the MeD-Fresnel LC lens.
To decrease the LC cell gap, the concept of Fresnel lens is described in next section.
Fig. 3-2 MeD-Fresnel LC lens structure.
Fig. 3-3 Refractive index distribution of the conventional MeD-LC lens with (a) outer electrodes, and (b) inner electrodes.
35
3.2.1 Fresnel lens
Compared to a conventional spherical lens, the Fresnel lens [31][32] reduces the amount of material required by breaking the lens into a set of different prisms, as shown in Fig. 3-4. The Fresnel lens keeps the optical properties similar to a conventional spherical lens but has lower cell gap.
Fig. 3-4 Cross section of (a) lenticular lens and (b) Fresnel lens.
By combining the concept of Fresnel lens and the MeD-LC lens, the MeD-Fresnel LC lens structure was obtained and was shown in Fig. 3-5.
Fig. 3-5 Concept of MeD-Fresnel LC lens: Fresnel lens + MeD-LC lens = MeD-Fresnel LC lens.
3.2.2 Simulation steps
To have focusing ability as conventional lenticular lens, the MeD-Fresnel LC lens wavefront must be consistent with the parabolic curve in Eq.3-2, which is the
36
substitution of Eq.1-10. The two-dimensional LC-cell simulation software was used to calculate the LC director profile distribution. Besides, the error function EF [33] shown in Eq.3-3 was defined for determining the difference between the MeD-Fresnel LC lens (Si) and the ideal Fresnel lens (Pi). The larger EF value meant the aberration was more serious.
Δ (3-2)
(3-3)
The MeD-Fresnel LC lens for a 3-inch 2D/3D display, the lens pitch (WL) and cell
gap(d) were set as 188μm and 28μm, the focal length was 1mm. Due to the electrode width, the ratio of electrode width (WE) and slit width (WS) of the MeD-Fresnel LC
lens, and the form of the bottom electrode (flat electrode or multi-electrode) affected the performance, optimization of the above parameters was needed.
At first, we set the electrode number of each prism of the MeD-Fresnel LC lens was the same. Then we assumed the bottom electrode as flat electrode, and the ratio of electrode width to slit width was 1:1. Under this condition, we can found a suitable electrode width. After a suitable electrode width was found, the Δn of each prisms must be checked. If the Δn is high enough, the fabrication can be begin. If the Δn is not high enough, the equivalent Fresnel prisms height is not tall enough, and the MeD-Fresnel LC lens focal length will become larger. Thus, the form of bottom electrode, the ratio of electrode width to slit width must be altered. And the previous steps should be repeated until the result fits all the conditions.
3.2.3 Simulation result
37
[34], the commercial software DIMOS.2D (Autronic- Melchers GMBH) was used to calculate the LC director profile distribution. The LC parameters used in the simulation were as follows: nematic LC E7 (Δn = 0.22), dielectric constants ε ⊥= 5.2
and ε //= 19.3, splay elastic constant K11= 11.1 pN, bend elastic constant K33= 17.1
pN, extraordinary refractive index ne= 1.7472 and ordinary refractive index no=
1.5271.
The simulation result of flat electrode as the bottom electrode turned out to be low Δn. Thus, we chose multi-electrode as the bottom electrode, and aligned the multi-electrode with the top substrate to fit the ideal Fresnel lens curve, as shown in Fig. 3-6.
Fig. 3-6 (a) Structure of flat electrode as the bottom electrode, (b) Structure of multi-electrode as the bottom electrode, and (c) Simulation Fresnel lens curves of different bottom electrode form.
38
After the bottom electrode form was chosen as multi-electrode, the simulation Fresnel lens curve of different electrode width to slit width ratio was shown in Fig. 3-7. When the ratio of electrode width to slit width was 1:1, the EF value was 1.8; when the ratio of electrode width to slit width was 2:1, the EF value was 1.1. Besides, the equivalent Fresnel lens curve of the ratio as 2:1 fitted the ideal curve more. Thus, we chose the ratio of electrode width to slit width as 2:1.
Fig. 3-7 (a) Structure of electrode width to slit width ratio as 1:1,
(b) Structure of electrode width to slit width ratio as 2:1, and (c) Simulation Fresnel lens curves of different electrode width to slit
width ratio.
The optimized value of electrode width was chosen as 5.33μm, because it tended to saturate as shown in Fig. 3-8. The equivalent Fresnel lens of the optimized MeD- Fresnel LC lens was shown in Fig. 3-9. The sharpness of the optimized MeD- Fresnel
39
LC lens was similar to the ideal Fresnel lens. The relative parameters of the optimized MeD-Fresnel LC lens were also shown in Table. 3-1.
Table. 3-1.Relative parameters of the optimized MeD-Fresnel LC lens.
Fig. 3-8 Simulation result of error function (EF) with electrode width.
Fig. 3-9 Equivalent Fresnel lens of the optimized MeD- Fresnel LC lens.
40
Fig. 3-10 Cross-section of the operated MeD-Fresnel LC lens.
Table. 3-1 Relative parameters of the optimized MeD-Fresnel LC lens.
3.3 Discussion
The structure of the MeD-Fresnel LC lens with multi-electrode at both top and bottom side inside the LC device was shown in Fig. 3-2. During the fabrication process, the alignment issue of multi-electrode at both top and bottom side may be occurred. Thus we assumed the alignment displacement between the top and bottom substrate is aμm and the largest displacement is equal to the electrode width, as shown
41
in Fig. 3-10(b). The simulation Fresnel lens curves of the MeD-Fresnel LC lens with and without the alignment issue were shown in Fig. 3-11. The largest alignment displacement resulted in asymmetric Fresnel lens curve, but it was still similar to the simulation curve of the MeD-Fresnel LC lens without alignment issue.
Fig. 3-11 (a) Structure of the MeD-Fresnel LC lens without alignment issue, (b) Structure of the MeD-Fresnel LC lens with alignment displacement 5.3μm, and
42
3.4 Summary
In this section, the MeD-Fresnel LC lens with closer Fresnel lens-like distribution was investigated. The MeD-Fresnel LC lens cell gap was almost half comparison with the conventional LC lens. Thus, the response time of the MeD- Fresnel LC lens could be reduced to quarter of the conventional LC lens’ response time. Moreover, the maximum operating voltage of the MeD-Fresnel LC lens was much lower than the conventional LC lens.
Otherwise, the fabrication process of the MeD-Fresnel LC lens is similar to the semiconductor process. By these well-developed fabrication processes, the designed MeD-Fresnel LC lens can be produced. And the experimental results will be shown in the next chapter.
43
Chapter 4
Measurement Results
4.1 Introduction
The objective of the measurement is to investigate the performance, operating voltage and response time of the MeD-Fresnel LC lens. According to the simulation result presented in Chapter 3, and the experimental result in this chapter, our design shows low operating voltage and fast response time compare to the conventional LC lens. Finally, the crosstalk phenomenon of the MeD-Frensel LC lens will also be shown in this chapter.
4.2 Measurement results
The MeD-Fresnel LC lens prototype was fabricated and as shown in Fig. 4-1, each MeD-Fresnel LC lens has 24 electrodes at both top and bottom substrates that can apply operating voltage individually to form different sharpness. After fabrication, the MeD-Fresnel LC lens was measured. The measurement results included four parts: equivalent Fresnel lens shape, operating voltage, response time and crosstalk phenomenon. The performance of our device can be judged with these four items.
44
Fig. 4-1 MeD-Fresnel LC lens prototype.
4.2.1 Reconstruction of the MeD-Fresnel LC lens
First of all, we divided the MeD-Fresnel LC lens into 10 layers and measured the light intensity distribution of each layer by the confocal microscope. The light intensity distribution images of each layer were shown in Fig. 4-2. After rebuild the LC orientation from light intensity as mentioned in section 2.3, the equivalent Fresnel lens shape was obtained and as shown in Fig. 4-3. The result showed that our device can really build the different sharpness and formed the Fresnel lens.
45
Fig. 4-3 Equivalent Fresnel lens shape of simulation and experimental results.
Although the experimental result was similar to the simulation curve, it still exist little difference. The equivalent Fresnel lens height of the experimental result was lower than the simulation result, and this difference might be caused by the fabrication inaccuracy. In the patterning ITO step of the fabrication process, the electrode to slit width ratio might not be perfect 2:1. Moreover, if the top and bottom substrates had a twist angle, the LC orientation would not identical to the simulation result and cause insufficient Δ n and Fresnel lens height.
4.2.2 Operating voltage and response time
To check the focusing ability of the MeD-Fresnel LC lens, the specific voltages were operated on each electrode, and the CCD was placed at the focal plane of the MeD-Fresnel LC lens to measure the light intensity distribution. The captured images without and with applying voltages were shown in Fig. 4-4(a) and (b), and the light intensity distributions were also shown in Fig. 4-4(c). The green region in Fig. 4-4(c) indicated the width of one MeD-Fresnel LC lens when focusing status. The red line and blue line indicated the light distribution before focusing and after focusing respectively. This result showed that the light was focused effectively by the MeD-Fresnel LC lens.
46
Besides, the beam size can be judged by the full width at half maximum (FWHM), and the smaller beam size indicates a more efficient focus. Comparing with different structures liked the MeD-Fresnel LC lens with multi-electrode at both top and bottom substrates, and lens with multi-electrode at top substrate and flat electrode at bottom substrate, the FWHM of our design was about 59um, which was smaller than the other (~80um). This result showed that the MeD-Fresnel LC lens with multi-electrode at both top and bottom substrates focus the light more efficient than the lens with multi-electrode at top substrate and flat electrode at bottom substrate.
Fig. 4-4 (a) Captured image of the MeD-Fresnel lens before applying voltage,
(b) Captured image of the MeD-Fresnel lens after applying voltage, and (c) Focusing measurement of the MeD-Fresnel LC lens.
47
In addition, the focus length was about 1mm and the driving voltage was about 5 volts under this operation. Compared to the operating voltage of the MeD-LC lens (~30volts), our design has really low operating voltage.
To calculate the switching rate of the MeD-Fresnel LC lens, the sequential captured images were shown in Fig. 4-5. The fabricated test cell included two MeD-Fresnel lenses and the interval rate between each frame was 0.2s. From the result in Fig. 4-5, the MeD-Fresnel LC lens could focus the light effectively within 1s. The switching rate was also much less than conventional MeD-LC lens which switching rate was 4s~10s.
Fig. 4-5 Sequential focusing images of the MeD-Fresnel LC lens.
In LCD applications, the over-drive method is used to reduce the response time. By applying a large voltage pulse through the electrodes first, the LC molecules rotated in a very short time. Then the desired operating voltage signal was applied to stabilize the focusing ability. The schematic picture of the over-drive method was shown in Fig. 4-6.
Combining the over-drive method with the MeD-Fresnel LC lens, a voltage pulse (3 times of the desired operating voltage) was applied to the test cell, and then the desired operating voltage signal (5Vrms) was also applied. With the over-drive method, the
48
switching rate of the MeD-Fresnel LC lens was reduced effectively within 0.2s. The sequential captured images were shown in Fig. 4-7.
Fig. 4-6 Concept of the over-drive method.
Fig. 4-7 Sequential focusing images of the MeD-Fresnel LC lens with over-drive method.
To analyses the relationship between focusing ability and response time, the light intensity distributions at the focal point of the LC lenses were measured per 0.2 second. The results of the MeD-LC lens (with and without over-drive method) and the MeD-Fresnel LC lens (with and without over-drive method) were shown in Fig. 4-8. The purple curve in Fig. 4-8 indicated the response time of the MeD-Fresnel LC lens
49
(without over-drive method) is about 0.8 second. Compared to the response time of the MeD-LC lens (the navy blue curve in Fig. 4-8), which was about 8 second, the response time of the MeD-Fresnel LC lens was short. Besides, the response time of the MeD-LC lens with over-drive method (voltage pulse were 3 times and 5 times of the desired operating voltage) was still longer than the MeD-Fresnel LC lens without over-drive method.
Fig. 4-8 Relationship between focusing ability and response time of the LC lenses.
Moreover, focus on the response time from 0 second to 1 second, the light blue and orange curves in Fig. 4-9 indicated the response time of the MeD-Fresnel LC lens with over-drive method (voltage pulse was 15Vrms and 25Vrms) is about 0.2 second. This
result showed the response time of the MeD-Fresnel LC lens can be reduced effectively by over-drive method and the response time after improvement is more suitable for applications.
50
Fig. 4-9 Relationship between focusing ability and response time of the MeD-Fresnel LC lens.
4.2.3Crosstalk phenomenon
In 3D displays, crosstalk can be defined as the leakage of left eye image to the right eye and right eye image to the left eye, as shown in Eq.4-1 [19]. The crosstalk phenomenon can be minimized when the images are projected to the exact eyes. When the crosstalk is too high, human brain no longer perceives two different images and causes no 3D sensation.
(4-1) To investigate the crosstalk, the commercial software, Light-Tools, was used to calculate the crosstalk phenomenon of the MeD-Fresnel LC lens by inputting Δ dlens
profile. Δ dlens is the height of the equivalent Fresnel lens and was substituted by the
refractive index, Δ nLC, as shown in Eq.4-2 and Eq.4-3 (Δ nLC is the refractive index
51
is the refractive index of the equivalent Fresnel lens).
Δ Δ (4-2) Δ Δ
(4-3) By ray-tracing method, the light intensity distribution of each viewing zone was simulated. After shifting the light source from pixel 1 to pixel 6 at a time, the light intensity distribution of each pixel can be obtained. For the eye distance of 65mm and a 1.4m viewing distance, the light intensity distribution of the MeD-Fresnel LC lens was shown in Fig. 4-10. After calculated by Eq.4-1, crosstalk of the MeD-Fresnel LC lens was obtained and around 29%, which was a little higher than the MeD-LC lens (about 24%) but lower than the conventional double electrode LC lens (about 42%). The results demonstrated that 3D display with the MeD-Fresnel LC lens has larger crosstalk than the MeD-LC lens, but less crosstalk than the conventional double electrode LC lens.
52
4.3 Summary
The Multi-electrode Driving Fresnel Liquid Crystal Lens (MeD-Fresnel LC lens) with double-layer multi-electrode structure had been fabricated and measured. By supplying specific operating voltages on each electrode, the MeD- Fresnel LC lens sharpness was similar to the Fresnel lens. Furthermore, the MeD-Fresnel LC lens not only focused light effectively and switched in less than 1 second without using over-drive method, but also had the benefit of low operating voltage (~5volts) and short focusing length (188mm lens pitch with 1mm focal length). It also meant that a fast switching between 2D and 3D image could be obtained by switching MeD-Fresnel LC lens on and off. Besides, with the over-drive method, the switching rate could be reduced to about 0.2 second.
To estimate the performance of the 3D display with our design structure, the crosstalk phenomenon was investigated. And the crosstalk of the MeD-Fresnel LC lens was about 29%, which was higher than the MeD-LC lens (~24%), but lower than the conventional double electrode LC lens (~42%). Therefore, the 3D image quality of our design structure will be a little worse than the 3D display with the MeD-LC lens, but better than with the conventional double electrode LC lens. The comparisons were summarized in Table. 4-1.
53
Table. 4-1 Comparison of conventional LC lenses and the MeD-Fresnel LC lens.
O: Good Δ: Normal X: Bad OD: Over-Drive method.
Comparison
MeD-
Fresnel LC
Lens
MeD-LC
Lens
(SID’09, Y.P. Huang, et al.)Double
Electrode LC
Lens
(JJAP’06, Y.S.Lin, et al.)Operating Voltage
O
(~5Vrms)Δ
(~ 30Vrms )X
(~ 60Vrms )Crosstalk
Δ
(~29%)O
(~24%)X
(~42%)Response
Time
Without
OD
O
(<1s)X
(~9s)With OD
(Voltage×3)
O
(~0.2ms)X
(~1.5s)With OD
(Voltage×5)
O
(<0.2ms)X
(~1.2s)Fabrication
Cell
Δ
(WE=5.3μm)O
( WE=14.5μm)Circuit
X
(Complex)O
(Simple)54
Chapter 5
Conclusions and Future Work
5.1 Conclusions
To satisfy human visual pleasure, many researchers are working toward to invent an auto-stereoscopic, full resolution and wide viewing angle 3D display for multi-user. Moreover, a 2D/3D switchable display is desired to fulfill the requirement of users who need both display types.
Therefore, a novel active device, multi-electrode driving Fresnel liquid crystal lens, of 2D/3D switching display had been demonstrated in this thesis. By controlling the LC with switching voltage on and off, both 2D and 3D images can be provided. The simulation results indicated that a Fresnel lens-like distribution can be achieved. And the measurement result also showed that our device can build the Fresnel lens-like distribution and has a fast switching rate (less than 1s) without using over-drive method. Besides, with the double electrode at both top and bottom substrates inside the LC layer, the operating voltage (~ 5volts) was much lower than the MeD-LC lens (~ 30volts). By using over-drive method, the switching time could be reduced to 0.2s, compare to the switching time of the MeD-LC lens (~ 4~10s), the response time had been further improved. In addition, the crosstalk phenomenon showed that the 3D image quality of our design (X-talk~ 29%) will be a little worse than the MeD-LC lens (X-talk~ 24%), but better than the conventional double electrode LC lens (X-talk~ 42%).
55
focusing ability and low operating voltage, but fast switching rate.
5.2 Future work
5.2.1 Simple circuit fabrication
The MeD-Fresnel LC lens has 24 electrodes in one lens pitch. Compared to the conventional LC lens (2~7 electrodes), the MeD-Fresnel LC lens has complex circuit, as shown in Table. 4-1. To be more suitable for the LCD production, the electrode number of the MeD-Fresnel LC lens should be decreased to simplify the circuit.
In addition, a high resistance (High-R) material can make a gradient electric field distribution, and conserve the electric power. Thus, a High-R material may be useful to reduce the electrode number but still maintain the electric field distribution inside the LC layer, as shown in Fig. 5-1. By using the High-R material, the electrode number of the MeD-Fresnel LC lens may be reduced to 12, which is half of the origin MeD-Fresnel LC lens. Therefore, to maintain the optical performance, Fresnel lens distribution and to simplify the circuit, the High-R material may be analysed in future.
56
5.2.2 Full resolution 3D image
Although the MeD-Fresnel LC lens has effective focusing ability with low operating voltage and fast switching rate, it still cannot provide full resolution 3D images. Therefore, we propose to combine the time-multiplexed concept with our design structure to achieve providing the full resolution images, as shown in Fig. 5-2. By applying voltages sequentially, the LC lens can move (or scan) horizontally and project images into different viewpoints without decreasing image resolution, as shown in Fig. 5-3.
57
Fig. 5-3 Scheme of scanning LC lens.
Therefore, we cooperated with ITRI and fabricated a 4-inch MeD-Fresnel LC lens array. The relative MeD-Fresnel LC lens parameters for a 4-inch display were shown in Table. 5-1. And a scanning driving system was also provided by ITRI. The rudimental scanning result was shown in Fig. 5-6. In order to provide full resolution 3D images, the MeD-Fresnel LC lens array will be combined with a 6 view projection system. The performance of the MeD-Fresnel LC lens and the image quality during the scanning time will be investigated in the future.
58
Fig. 5-4 A 4-inch MeD-Fresnel LC lens array.
Fig. 5-5 Captured images of the MeD-Fresnel LC lens array: (a) before applying voltage, and (b) after applying voltage.
59
Fig. 5-6 Captured images of the scanning MeD-Fresnel LC lens.