國
立
交
通
大
學
資訊科學與工程研究所
碩
士
論
文
應用動態樁技術於合作式網頁應用程式測試
Applying Dynamic Stubbing Technique to Support Collaborative
Testing of Web Application
研 究 生:李佳玫
指導教授:曾憲雄 博士
黃世昆 博士
應用動態樁技術於合作式網頁應用程式測試
Applying Dynamic Stubbing Technique to Support Collaborative
Testing of Web Application
研 究 生:李佳玫 Student:Jia-Mei Lee
指導教授:曾憲雄 博士 Advisors:Dr. Shian-Shyong Tseng
黃世昆 博士 Dr. Shin-Kun Huang
國立交通大學
資訊科學與工程研究所
碩士論文
A ThesisSubmitted to Institute of Computer Science and Engineering College of Computer Science
National Chiao Tung University in partial Fulfillment of the Requirements
for the Degree of Master
in
Computer Science
June 2011
Hsinchu, Taiwan, Republic of China
i
應用動態樁技術於合作式網頁應用程式測試
研究生:李佳玫 指導教授:曾憲雄博士
黃世昆博士
國立交通大學資訊科學與工程學系研究所碩士班
摘要
現今,在網際網路上大量的免費人力資源通常被運用來減少測試成本與驗證軟體, 如:線上遊戲與開放原始碼軟體。然而,傳統的合作測試方法在不考慮大眾測試者有共 同的測試偏好與測試者素質參差不齊的情況下,往往會有測試時間難以收斂與測試報告 的可信度不高等議題。為了加速收斂網站測試,有必要應用細顆粒的網頁應用程式模型 來平行化測試工作。在這篇研究中,首先我們提出狀態轉換圖來為使用者的執行行為建 模以達到分解網頁應用程式測試問題的目的。更進一步為了達到加速測試速度與改善測 試報告的品質,並且減少合作測試的總成本,我們提出了一個動態樁技術來引導使用者 進行測試。動態樁技術結合所提出的細顆粒的網頁應用程式模型可以在大眾測試者沒有 察覺的情況下改變測試環境來導引他們解決子問題。實驗結果顯示我們所提出的方法可 以減少 50﹪的測試成本與增加 30﹪的偵測效能。 關鍵字:大眾化分類、合作式測試、網頁應用程式測試、狀態轉換圖、程式相依圖、動 態樁技術ii
Applying Dynamic Stubbing Technique to Support Collaborative
Testing of Web Application
Student: Jia-Mei Lee Advisors:Dr. Shian-Shyong Tseng
Dr. Shin-Kun Huang
Institute of Computer Science and Engineering Nation Chiao Tung University
Abstract
Nowadays, large volunteers creeping on internet are usually treated as free human resources for reducing test cost and validating software, like online games and open source software. However, traditional collaborative testing design and management approach encounters the long due time and doubting test report resulting from the common preferences of users and unqualified testers, respectively. A fine-grained Web application model is essential to refine job assignments for speeding up test coverage. In this thesis, we first propose State Transition Diagram to model the users‘ runtime behaviors for decomposing Web application testing problem. Then, based on this fine-grained Web application model, a dynamic stubbing technique which allows folk testers contribute themselves in solving sub-problems with barely noticing the change of test environment is proposed for achieving faster test coverage speed and improving the quality of test report, and hence reduces the total cost of collaborative testing. The experimental results show that our proposed approach can reduce 50% test cost and increase 30% detection performance.
Keywords: folksonomy-based approach, collaborative testing, Web application testing, state transition diagram, program dependence graph, dynamic stubbing technique.
iii
誌謝
本篇論文的完成,首先我要感謝我的指導教授,曾憲雄老師,老師總是犧牲自己休 息的時間來指導我們並且不厭其煩的領導我一步一步的思考與表達方法的訓練,我所得 到的不只是一篇論文,還有整個領域的研究方法、思考邏輯。這是在碩士兩年的求學過 程中,最寶貴的知識。此外,也要特別感謝我的共同指導教授,黃世昆老師,在口試時 給我很豐富的意見,同時也要感謝我的口試委員,黃國禎教授、袁賢銘教授,感謝你們 許多寶貴的意見,讓整篇論文更完整。 再來也要感謝在研究過程中,給我許多鼓勵及建議的學長,宗儒學長,感謝你的付 出與教導讓我得以順利完成此篇論文。還有元昕學長,曾經給我很多鼓勵與豐富的知識。 還要感謝 605 的學長姐:喚宇學長、怡利學姐、佳榕學姐,在我最艱難的過程中給了我 很大的鼓勵與指導,讓我可以更努力的堅持下去,還有其他實驗室的學長姐,瑞鋒學長、 哲青學長、莉玲學姐,謝謝你們曾經給過的意見指導和幫助。再來是我最親愛的同學們, 楷元、嘉凱,這兩年來我們一起成長,所有苦的甜的回憶我會一輩子珍藏,要一直保持 聯絡! 最後我要感謝愛我的家人及朋友們,感謝爸媽從小栽培與關懷才能有現在的我,也 要感謝阿君、阿淳、旻旻、小瀞、呆瓜、小白,總是不斷的給我勇氣,一路上的支持與 鼓勵,很開心我的碩士生涯能夠有你們陪伴在旁。 感謝這一路上所經歷過的一切,所有的酸甜苦辣,都是我成長的力量,在此我獻上 最誠摯的感謝,謝謝你們。iv
Table of Content
摘要 ... i Abstract ... ii 致謝 ... iii Table of Content ... iv List of Figures ... viList of Tables ... viii
Chapter 1. Introduction ... 1
Chapter 2. Related Work ... 5
2.1 Structure of software systems ... 5
2.2 Behavior of software systems ... 5
2.3 Three-level dependence graph ... 6
Chapter 3. Web application testing model ... 8
3.1 Motivation ... 8
3.2 Value-oriented dependence graph ... 9
3.2.1 Tainted variables in branch predicate ... 10
3.2.2 Definition of value-oriented dependence graph ... 11
3.2.3 Value-oriented Dependence Graph (VDG) construction algorithm ... 13
3.2.4 Example of value-oriented dependence graph ... 15
3.3. State transition diagram ... 22
3.3.1 Problem decomposition ... 22
3.3.2 Definition of state transition diagram ... 23
3.3.3 State Transition Diagram (STD) construction algorithm ... 25
3.3.4 Example of state transition diagram ... 28
Chapter 4. Dynamic stubbing technique for Collaborative testing ... 30
4.1 Motivation example... 30
v
4.2.1 Problem formulation ... 34
4.2.2 NP-Complete problem ... 36
4.3 Dynamic stubbing algorithm for Minimum Test Cost Problem ... 38
Chapter 5. Implementation and Experiment... 43
5.1 System architecture and implementation ... 43
5.1.1 System architecture ... 43
5.1.2 System implementation ... 44
5.2 Experimental design and results ... 47
5.2.1 Experimental design ... 47
5.2.2 Experimental results ... 48
Chapter 6. Conclusion ... 54
vi
List of Figures
Figure 1 Flow chart of program ... 3
Figure 2 Three-level dependence graph ... 7
Figure 3 Source code of Pay.aspx page (a) with its flow chart (b) in Example ... 9
Figure 4 Differents of three variables in Example 1 ... 11
Figure 5 Value-oriented dependence graph in Example 1 ... 13
Figure 6-1 Value-oriented dependence graph after executing Step 1 of VDG algorithm ... 18
Figure 6-2 Value-oriented dependence graph after executing Step 2 of VDG algorithm ... 18
Figure 6-3 Value-oriented dependence graph after executing Step 3 of VDG algorithm ... 19
Figure 6-4 Value-oriented dependence graph after executing Step 4 of VDG algorithm ... 19
Figure 6-5 Value-oriented dependence graph after executing Step 5 of VDG algorithm ... 20
Figure 6-6 Value-oriented dependence graph after executing Step 6 of VDG algorithm ... 20
Figure 6-7 Value-oriented dependence graph after executing Step 7 of VDG algorithm ... 21
Figure 6-8 Value-oriented dependence graph after executing Step 8 of VDG algorithm ... 21
Figure 6-9 Value-oriented dependence graph after executing Step 9 of VDG algorithm ... 21
Figure 6-10 Value-oriented dependence graph after executing Step 10 of VDG algorithm .... 22
Figure 6-11 Value-oriented dependence graph after executing Step 11 of VDG algorithm .... 22
Figure 7 Idea of problem decomposition ... 23
Figure 8 State transition diagram in Example 1 ... 25
Figure 9-1 State transition diagram after executing Step 1 of STD algorithm ... 28
Figure 9-2 State transition diagram after executing Step 2 of STD algorithm ... 29
Figure 10 Problem decomposition scenario ... 30
Figure 11 Due time of assignment 1 ... 32
Figure 12 Due time of assignment 2 ... 32
Figure 13 Intelligent collaborative testing system architecture ... 43
Figure 14 Screen shot of register page of ICTS ... 45
vii
Figure 16 Screenshot of ICTS guiding ... 46
Figure 17 Screenshot of complete information of ICTS ... 47
Figure 18 Comparison of state complete degree of testing ... 49
viii
List of Tables
Table 1 Property of Patterns of Different level ... 16
Table 2 Property of Patterns of Different variable ... 17
Table 3 Sub-problem completion time of each folk tester matrix ... 31
Table 4 Assignment 1 for shopping Web-site testing ... 31
Table 5 Assignment 2 for shopping Web-site testing ... 31
Table 6 Notations of MTCP in collaborative testing ... 34
Table 7 Notations of Dynamic stubbing algorithm ... 39
Table 8 Value-oriented dependence graph statistics ... 48
Table 9 State complete degree of testing comparing ... 49
Table 10 Comparison of test time between two groups ... 50
Table 11 Comparison of the folk testers per due time ... 50
Table 12 Ten defects in Web application ―BookStore‖ ... 51
Table 13 Comparison of test time of each state between two groups ... 53
Table 14 Comparison of fault-detection ability between two groups ... 53
1
Chapter 1 Introduction
Collaborative testing is widely used in industries to reduce test cost and assure the
software quality, especially in online game, open source software and Web applications. Low
reliability of Web application will lead to serious detrimental effects for businesses,
consumers, and the government because users increasingly depend on the Internet for routine
daily operations. However, lacking of good test design and management approach,
unqualified folk testers with some common preferences will slow down the test convergence
and produce suspect test report. Due to the untrammeled nature of folks, restricted test
scenario according to different test design and management approach may decrease their
willingness and hence reduce available human resources. It procures more cost of
collaborative testing. A good test design and management approach should take the
willingness and common preferences of folk testers into consideration.
Problem decomposition which reduces original collaborative testing problem into several
sub-problems is an efficient and effective approach for speeding up collaborative test and
increasing the quality of test report. The reduced sub-problems are easier and can be assigned
in parallel for decreasing the due time. Besides, the solution of sub-problems can be easily
merged to the one of original problem, and hence can complete test. In the meanwhile, testers
concentrating on small problem can detect faults more easily, and hence improving the quality
of test report.
The success of problem decomposition relies on a proper Web application model.
However, traditional Web application models, like page navigation diagram [1]-[9] and finite
state machine (FSM) [10]-[20] and Petri-net [21]-[25], do not take software fault into
consideration and hence suffer the risk of causing Type I and II error. A software fault
classification based on program dependence graph has been proposed [26]. Tung et al.
2
test suite with full fault-detection [27]. Huang further extended Tung‘s model to three-level
program dependence graph (page level, function level and code level) for considering the
perspectives from folk testers (Web pages) and test objective from developer (basic blocks
coverage) [28]. However, the three-level program dependence graph is a coarse-grained
model because itdoes not model input values. Hence it cannot be applied to further problem
decomposition according to runtime behavior of users.
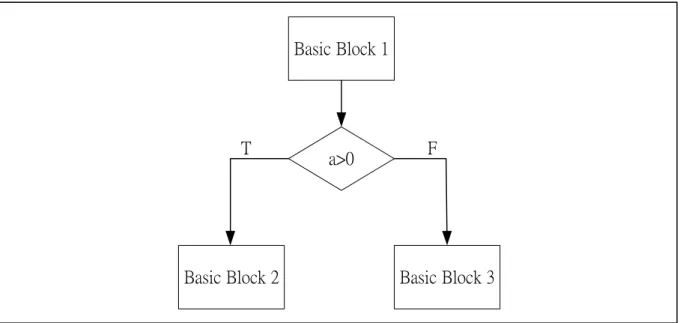
In this thesis, we refine coarse-grained three-level dependence graph to fine-grained
value-oriented dependence graph (VDG) which models users‘ runtime behavior by
considering runtime input value. Figure 1 shows flow chart of program containing basic
blocks 1, 2, and 3 where each basic block means they are a maximal code fragments without
branching of a function [29]. If value of variable a is more than 0 then basic block 1 and basic
block 2 can be covered. Otherwise, basic block 1 and basic block 3 can be covered. So,
different values of variable may have different behaviors of program. By considering input
value, the testing problem can be further decomposed into two sub-problems which are still
able to meet the test criteria, basic blocks coverage. For the purpose of fine turning
collaborative test plan, we further propose State Transition Diagram (STD) based on VDG in
Chapter 3. Each state of STD represents a program behavior of a page. Based on this state
transition diagram, we can assign job more precisely in collaborative testing and guide testers
3
Basic Block 1
a>0
Basic Block 2 Basic Block 3
T F
Figure 1. Flow chart of program
The Minimum Testing Cost Problem in collaborative testing (MTCP) can be considered
as a variant of Job Assignment Problem (or Optimum Representative Set Problem) [30] with
further constraints on testing resources and tester trustworthy. We reduce Job Assignment
Problem to MTCP and prove that MTCP is NP-complete in Chapter 4. Therefore, a
heuristic-based dynamic stubbing algorithm for job assignment is proposed to solve this
problem by overcoming the issue of centralized preferences and willingness of folk testers
which can speed up the test coverage and hence reduce the test cost.
We implement prototype system with our proposed approach by the dynamic stubbing
technique which allows folk testers contributing their human resources with barely noticing
varying test environment. Our collaborative testing system can collect tester user sessions
during testing processes. To support collaborative testing, we record the testing logs and guide
the test activities on our collaborative testing system. These testing logs are analyzed by
proposed report analysis algorithm to form high quality test report. The experimental results
show that our approach which reduces 50% due time and increases 30% detection rate is both
4
We briefly outline the contents of this thesis. Chapter 2 provides related works. Chapter
3 gives the Web application modeling and the corresponding value-oriented dependence graph
construction algorithm and state transition diagram construction algorithm. We also present
the dynamic stubbing technique to support the Minimum Collaborative Testing Problem with
the proposed heuristic-based dynamic stubbing algorithm in Chapter 4. Chapter 5 explains
5
Chapter 2 Related Works
In the chapter, we will discuss several different models of the web applications testing,
and each model has different test goals. We briefly describe two types of the models,
including structure of software systems only considering structure of systems and behavior of
software systems considering both structure and behavior of systems.
2.1 Structure of software systems
There are some models which describe structure of program as follows. A program
dependence graph [31]-[37] is a directed graph in which the nodes are statements and
predicate expressions and the edges are dependences between the nodes. Two types of
dependences are data dependence and control dependence between nodes. The data
dependence between two statements means that the input variable of a statement is transferred
from the other statement. The control dependence means that the flow of statements is
decided by certain predicate expressions. The UML class diagrams [38] describing structures
of software systems are also a directed graph in which nodes are classes of an object-oriented
system and edges are dependences and inheritances between classes.
These structure-based models are unable to describe behaviors of folk testers and hence
not suitable for collaborative testing.
2.2 Behavior of software systems
Another kind of software models, including page navigation diagram and finite state machines, aim to describe behavior of program. The page navigation diagram [1]-[9] is a
directed graph where nodes are Web pages and edges are links between Web pages. The
model can describe all test paths for Web applications testing. Huaikou et al. [1] proposed an
approach which uses a regular expression characterizing the directed graph on page
6
tool for automatically navigating links of Web applications and exploring execution test paths
through dynamic components of Web applications with a search algorithm. Shengbo et al. [4]
and Zhongsheng et al. [7] proposed an algorithm to generate Test-Trees from page navigation
diagram for satisfying link and page coverage.
The Final State Machine (FSM) [10]-[20] is used to model Web applications and it is a
directed graph including nodes and edges. There are two types of the nodes: Web pages and
associated components. There are three types of the edges: link edge, call edge and build edge.
The link edge means that Web page can link the other Web page or component. The call edge
means that Web page can call component through delivering requests to it. The build edge
means that the component can build the new web page as responses to the requests. Andrews
et al. used FSM to model and test Web applications, and then proposed an approach which
decomposes Web application into several subsystems based on FSM with constraints to
generate test sequences [10]. Liping et al. proposed the Kripke structure that is a model of
FSM to model Web applications from the user‘s viewpoint [15]. The model can generate test sequences satisfying state and transition coverage for Web applications. However, page
navigation diagram and finite state machines did not consider fault-detection ability and were
risk of suffering Type I and II error. Furthermore, these models are coarse-grained because of
the lack of input domain information. Three-level dependence graph which is also a model of
behavior of software system is presented in next section.
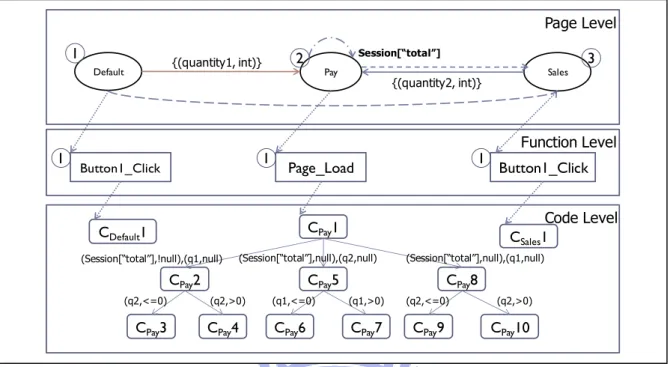
2.3 Three-level dependence graph
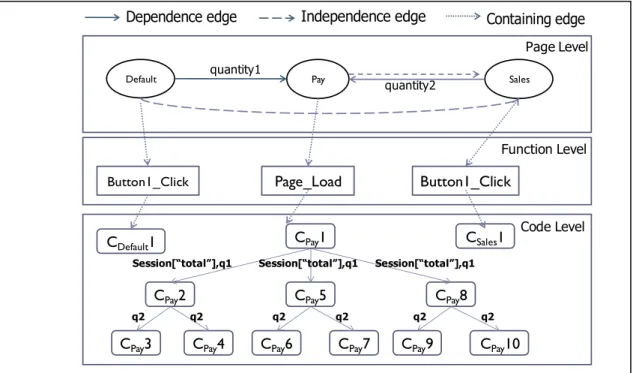
Huang [28] considered the perspectives from folk testers (Web pages), test objective
from developer (basic blocks coverage) and fault-detection ability to propose three-level
dependence graph (page-level, function-level and code-level), illustrated in Figure 2. In
page-level, the nodes are Web pages and the edges are links between Web pages. In
7
statements. And in code-level, the nodes are basic blocks that are a maximal code fragments
without branching of a function and the edges are control flow between the basic blocks.
Dependence edge and independence edge are intra-level edges where dependence edge can
transfer data between Web pages, functions, and basic blocks. And the other edge is
containing edge which can connect different nodes between page-level, function-level, and
code-level. However, this three-level dependence graph cannot model the users‘ runtime
behavior, and is hence coarse-grained and improper for fine job assignment in collaborative
testing.
Dependence edge Independence edge Containing edge
Default Pay Sales
Page Level
Code Level
CPay2
Button1_Click Page_Load Button1_Click
Function Level quantity1 quantity2 CPay5 CPay8 CPay3 CPay4 CPay1
CPay6 CPay7 CPay9 CPay10
Session[“total”],q1
q2
CDefault1 CSales1
Session[“total”],q1 Session[“total”],q1
q2 q2 q2 q2 q2
8
Chapter 3 Web application testing model
In the chapter, we will propose a novel model to support the collaborative testing for
Web application. First, we start with a motivation example and then propose a fine-grained
value-oriented dependence graph which models user‘s input domain information based on
three-level dependence graph [28]. Finally, we propose state transition diagram which is a
novel runtime behavior model for decomposing original collaborative testing problem into
several sub-problems.
3.1 Motivation
One of the most importance objectives in software testing is to assure the software
quality by covering all the code statements. However, covered code statements in each
execution depend on input values. The Example 1 is given to motivate us that a fine job
assignment needs to take variable value into consideration.
Example 1:
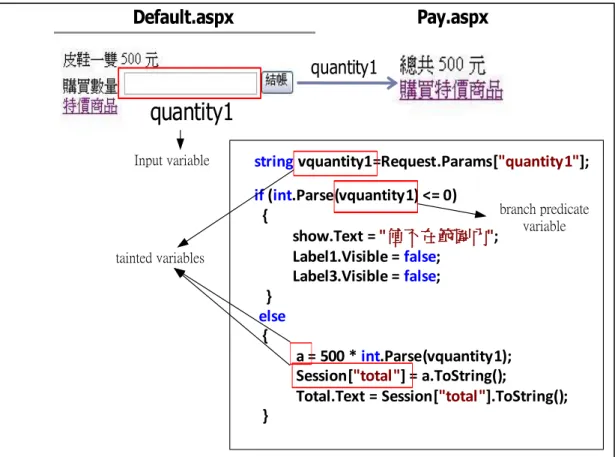
The shopping Web-site contains Default.aspx, Pay.aspx, and Sales.aspx pages.
Consumers decide the amount of shoes (quantity1) and socks (quantity2) they want to buy in
Default.aspx and Sales.aspx, and then this purchase information will be transferred to
Pay.aspx for following payment. Figure 3a shows source code of Pay.aspx page. Figure 3b
shows the flow chart for the source code of Pay.aspx page, and these basic blocks can be
covered depend on consumer‘s input different values from Default.aspx page. If consumers
key in quantity1 value which is less than or equal to 0, then CPay1 and CPay2 will be covered in
9 Default.aspx Pay.aspx Sales.aspx quanity1 quanity2
stringvquantity1=Request.Params["quantity1"];
if(int.Parse(vquantity1) <= 0) { show.Text = "值不在範圍內"; Label1.Visible = false; Label3.Visible = false; } else { a = 500 * int.Parse(vquantity1); Session["total"] = a.ToString();
Total.Text = Session["total"].ToString(); } CPay1 CPay2 CPay3 Pay.cs CPay1 Int.Parse(vquantity1)<=0 CPay2 CPay3 T F (a) (b)
Figure 3. Source code of Pay.aspx page (a) with its flow chart (b) in Example 1
3.2 Value- oriented dependence graph
Based on the above motivated example, the three-level dependence graph shown in
section 2.3 cannot describe different executions in different values because it cannot model
users‘ input values. We first define the tainted variables in branch predicate which can be controlled by user and decide the flow of executions, and then we refined three-level
dependence graph to value-oriented dependence graph. The definition and construction
algorithm of value-oriented dependence graph are also presented in this section. Finally, an
10
3.2.1 Tainted variables in branch predicate
Figure 3 motivates us that a fine job assignment requires the value information of
variables. However, only some variables will depend on user‘s input to influence the program
execution flow. Therefore, we first consider the variable which can decide the flow of a
program. This kind of variables dominating the execution flow is defined as branch predicate
variables. In collaborative testing, testers can only use input variable and hyperlink to validate
Web site. Hence, we define input variable and tainted variable which are controllable variable
of testers. Finally, the tainted variables in branch predicate in a fine collaborative testing are
defined if it is branch predicate variables and tainted variable. The formal definitions and
notations of branch predicate variables, input variable, tainted variable and tainted variables in
branch predicate are provided below:
Definition 1 (Branch predicate variables VBPi)
A variable VBPi is the ith branch predicate variable if it is related to program behavior of a
page. It affects code flow chart of the page.
Definition 2 (Input variable VINi)
A variable VINi is the ith input variable if it is a frame of each page which user can input
value.
Definition 3 (Tainted variable VTi)
A variable VTi is the ith tainted variable if there is related to the input variable VIi of the
page.
Definition 4 (Tainted variable in branch predicate VTBPi)
A variable VTBPi is the ith tainted variable in branch predicate if it is branch predicate
variable and tainted variable which means it affects program behavior of the page.
Example 1 of the above variables is shown in Figure 4, where quantity1 is the only input
11
and Total.Text. vquantity1 is the only variable which will influence the flow of Pay.aspx and
hence is branch predicate variable. Therefore, in this simple example, vquantity1 is both
branch predicate variable and an element of tainted variable, and hence is the tainted variable
in branch predicate in collaborative testing on this shopping website.
quantity1
Default.aspx Pay.aspx
quantity1
stringvquantity1=Request.Params["quantity1"];
if(int.Parse(vquantity1) <= 0) { show.Text = "值不在範圍內"; Label1.Visible = false; Label3.Visible = false; } else { a = 500 * int.Parse(vquantity1); Session["total"] = a.ToString();
Total.Text = Session["total"].ToString(); }
tainted variables
branch predicate variable Input variable
Figure 4. Differents of three variables in Example 1
3.2.2 Definition of Value- oriented dependence graph
Three-level dependence graph [28] is proposed to connect the perspectives from folk
testers (Web pages), test objective from developer (basic blocks coverage). However, the lack
of variable value information of three-level dependence graph cannot lead to fine
collaborative testing. We further extend three-level dependence graph to value-oriented
dependence graph by considering variable value information. There are three types of the
vertexes (a set of pages, a set of functions, and a set of basic blocks) in the value-oriented
12
graph. Three of them are intra-level edges representing the connections within page-level,
function-level, and code-level. The other two are inter-level edges representing the
connections between different levels. The formal definition of value-oriented dependence
graph is provided below:
Definition 5: Value-oriented dependence graph Value-oriented Dependence graph G= (V, E)
VINi is an input variable
I= {VINi| VINi is an input variable} is the set of input variables
R= ∏i=1nR(VINi)=R(VIN1) ×R(VIN2) ×…×R(VINn), where R(VINi) is an image of variable VINi
V=VP∪VF∪VC, where
VP= {PAi| PAi is a page} is the set of the pages
VF= {Fi| Fi is a function} is the set of the functions
VC= {Ci| Ci is a basic block} is the set of the basic blocks
E=EP∪EF∪EC∪EPF∪EFC, where
EP= {(PAi, PAj, Iij, Rij)|PAi, PAj ∈ Vp, Iij ∈ I , Rij ∈ R}
EF= {(Fi, Fj , Iij, Rij)|Fi, Fj ∈ VF , Iij ∈ I , Rij ∈ R }
Ec= {(Ci, Cj, Iij, Rij)|Ci, Cj ∈ Vc, Iij ∈ I , Rij ∈ R }
EPF= {(Pi, Fj)| Pi∈ VP, Fj∈ VF}
EFC= {(Fi, Cj)| Fi∈ VF, Cj∈ VC}
Figure 5 shows value-oriented dependence graph in Example 1. Compared to three-level
dependence graph, we further record tainted variable in branch predicate value information in
edges. Different tainted variable in branch predicate values decide the permission of distinct
edge and hence decide which basic blocks will be covered in different execution. The details
of value-oriented dependence graph construction algorithm will be presented in the next
13
Default Pay Sales
Page Level
Code Level
CPay2
Button1_Click Page_Load Button1_Click
Function Level {(quantity1, int)} {(quantity2, int)} CPay5 CPay8 CPay3 CPay4 CPay1
CPay6 CPay7 CPay9 CPay10 (Session[“total”],!null),(q1,null) (Session[“total”],null),(q2,null) (Session[“total”],null),(q1,null)
(q2,<=0) (q2,>0) (q1,<=0) (q1,>0) CDefault1 CSales1 (q2,<=0) (q2,>0) Session[“total”] 1 2 3 1 1 1
Figure 5. Value-oriented dependence graph in Example 1
3.2.3 Value-oriented Dependence Graph (VDG) construction algorithm
First, we will detect nodes of page-level, function-level, and code-level based on
different pattern sets of each level, and then construct edges of each node in page-level,
function-level, and code-level with the subroutine ―EdgeConstruction‖ based on the pattern
sets of each level. Finally, we construct the variables of each type with the subroutine
14
Value-oriented dependence graph construction algorithm Input:
Folder which stores file of each page
Page code segments Ba={Ba1,…,Ban} , Bc={Bc1,…,Bcn}
Pattern set of declare page PP Pattern set of declare function PF Pattern set of declare code PC
Pattern set of declare input variables PI Pattern set of declare global variables PG
Pattern set of declare branch predicate variables PBP TP, where TP=PP∪PF∪PC
Output: Value-oriented Dependence graph,G=(V,E) , where V=VP∪VF∪VC,
E=EP∪EF∪EC∪EPF∪EFC
Method:
Initial: V=∅,E=∅
Step1: For each line L in folder
If L contains pattern PP then add the node into VP
Step2: For each Bci in Bc
2.1: For each line L in Bci
If L contains pattern PF then add the node into VF
2.2: Add edge from the page node to the function node Step3: For each Bci in Bc
3.1: For each line in Bci
If L contains pattern PC then add the node into VC
3.2: Add edge from the function node to the basic block code
Step4:
4.1: For each Bai in Ba
EdgeConstruction(Bai,PP)
4.2: For each Bci in Bc
EdgeConstruction(Bci,PP)
Step5: For each BFi in VF
EdgeConstruction(Bci,PF)
Step6: For each B in VC
EdgeConstruction(Bci,PC)
Step7: For each Bai in Ba
I (Vi) = VariablesSetConstruction (Bai,PI)
15
G (Vi) = VariablesSetConstruction (Bci,PG)
Step9: For each Bci in Bc
T (Vi) = VariablesSetConstruction (Bci,I(Vi))
Step10: For each Bci in Bc
BP (Pi) = VariablesSetConstruction (Bci,PBP) Step11: TBP (Pi)= (
n i i P BP 1 ) ( )∩(
m j j V T 1 ) ( ) Subroutine: EdgeConstructionInput: Code segment B、TP
Output: Dependence graph of each level Method:
Step1: For each line L in B
If L contains pattern TP then construct edge of nodes
Step2: Return Dependence graph of each level
Subroutine: VariablesSetConstruction
Input: Code segment B、TP
Output: Set of variable S Method:
Step1: For each line L in B
If L contains pattern TP then add the variable into S
Step2: Return S
3.2.4 Example of Value-oriented dependence graph
At server side, there are various techniques to develop dynamic web page such as
ASP.NET with C#, JSP, and PHP. At client side, HTML and JavaScript are used widely to
support the development of the web applications. Hence, we only consider the ASP.NET with
C# language, and the other language such as HTML, JavaScript can be considered by simple
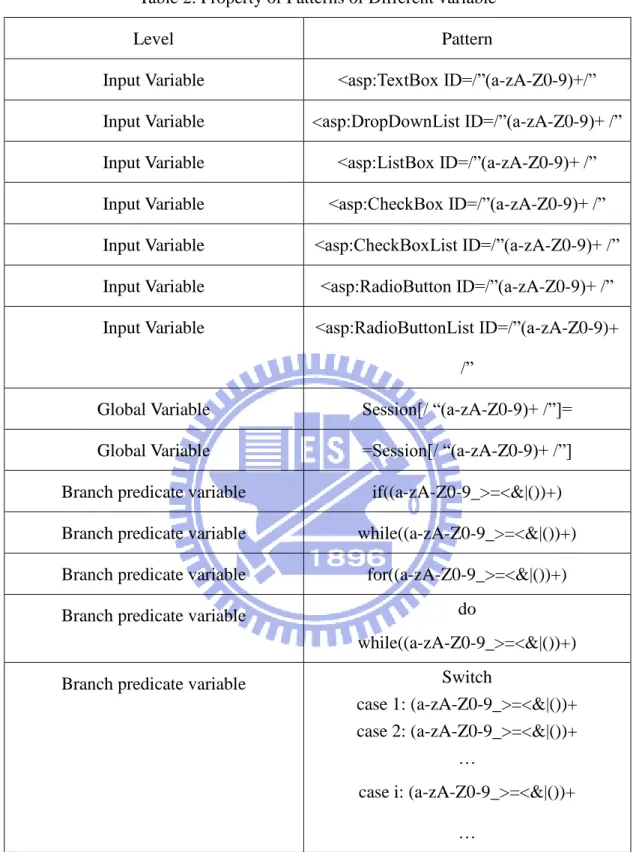
extension. In Table 1, according to different levels with page, function, and code we classify
16
according to different variables with input, global, and branch predicate we classify patterns
of these variables in the value-oriented dependence graph.
Table 1. Property of Patterns of Different level
Level Pattern
Page Node .aspx
Page Edge Response.Redirect
Page Edge NavigateUrl
Function Node (protected| private |
public)?[ ](void|bool|int|float)
Function Edge Function caller
Code Node (if|else|for|while|switch)
17
Table 2. Property of Patterns of Different variable
Level Pattern
Input Variable <asp:TextBox ID=/‖(a-zA-Z0-9)+/‖
Input Variable <asp:DropDownList ID=/‖(a-zA-Z0-9)+ /‖
Input Variable <asp:ListBox ID=/‖(a-zA-Z0-9)+ /‖
Input Variable <asp:CheckBox ID=/‖(a-zA-Z0-9)+ /‖
Input Variable <asp:CheckBoxList ID=/‖(a-zA-Z0-9)+ /‖
Input Variable <asp:RadioButton ID=/‖(a-zA-Z0-9)+ /‖
Input Variable <asp:RadioButtonList ID=/‖(a-zA-Z0-9)+
/‖
Global Variable Session[/ ―(a-zA-Z0-9)+ /‖]=
Global Variable =Session[/ ―(a-zA-Z0-9)+ /‖]
Branch predicate variable if((a-zA-Z0-9_>=<&|())+)
Branch predicate variable while((a-zA-Z0-9_>=<&|())+)
Branch predicate variable for((a-zA-Z0-9_>=<&|())+)
Branch predicate variable do
while((a-zA-Z0-9_>=<&|())+)
Branch predicate variable Switch
case 1: (a-zA-Z0-9_>=<&|())+ case 2: (a-zA-Z0-9_>=<&|())+
…
case i: (a-zA-Z0-9_>=<&|())+
…
The Example 2 is given to illustrate the value-oriented dependence graph construction
algorithm, where Figures 6-1 to 6-11 show the results after executing steps 1 to 11,
18
Example 2:
The Example 2 continues Example 1. According to the source code of each page,
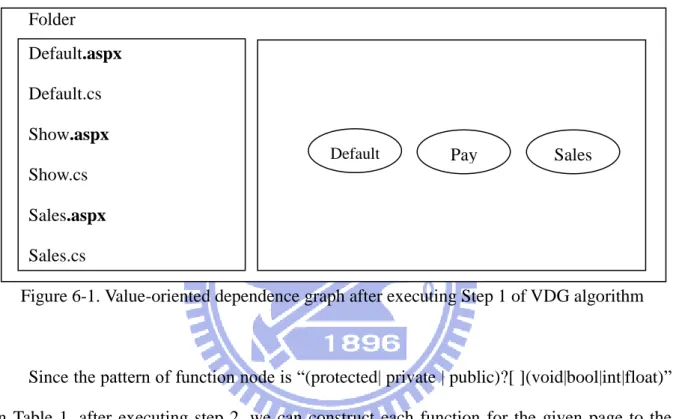
―Property of Patterns of Different level‖ in Table 1, and ―Property of Patterns of Different variable‖ in Table 2, we can construct the value-oriented dependence graph.
Since thepattern of page node is ―.aspx‖, after executing step 1, we can construct each
page to the node in page-level as shown in Figure 6-1.
Folder Default.aspx Default.cs Show.aspx Show.cs Sales.aspx Sales.cs
Figure 6-1. Value-oriented dependence graph after executing Step 1 of VDG algorithm
Since the pattern of function node is ―(protected| private | public)?[ ](void|bool|int|float)‖
in Table 1, after executing step 2, we can construct each function for the given page to the
node in function-level and connect the given page and the function with corresponding edge
as shown in Figure 6-2.
Page-level
Show.cs
protectedvoid Page_Load(object sender, EventArgs e)
{ } Function-level
Figure 6-2. Value-oriented dependence graph after executing Step 2 of VDG algorithm
Default Pay Sales
Page_Load
19
Since the pattern of code node is ―(if|else|for|while|switch)‖ in Table 1, after executing
step 3, we can construct each basic block for the given function to the node in code-level, and
connect the function and the basic block with corresponding edge as shown in Figure 6-3.
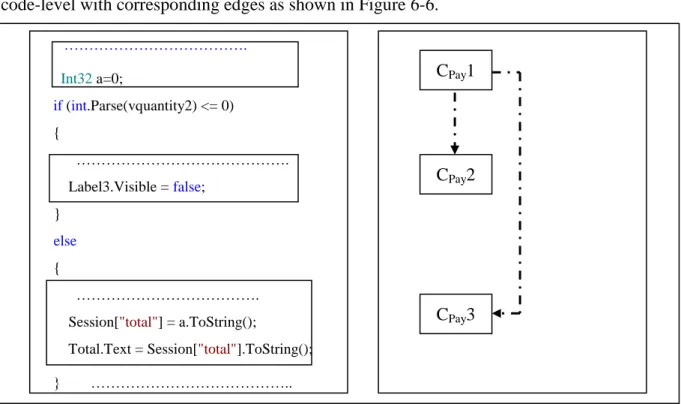
………. Int32 a=0; if (int.Parse(vquantity2) <= 0) { Function-level ………. Label3.Visible = false; } else { Code-level ……….
Session["total"] = a.ToString();
Total.Text = Session["total"].ToString(); } ………..
Figure 6-3. Value-oriented dependence graph after executing Step 3 of VDG algorithm
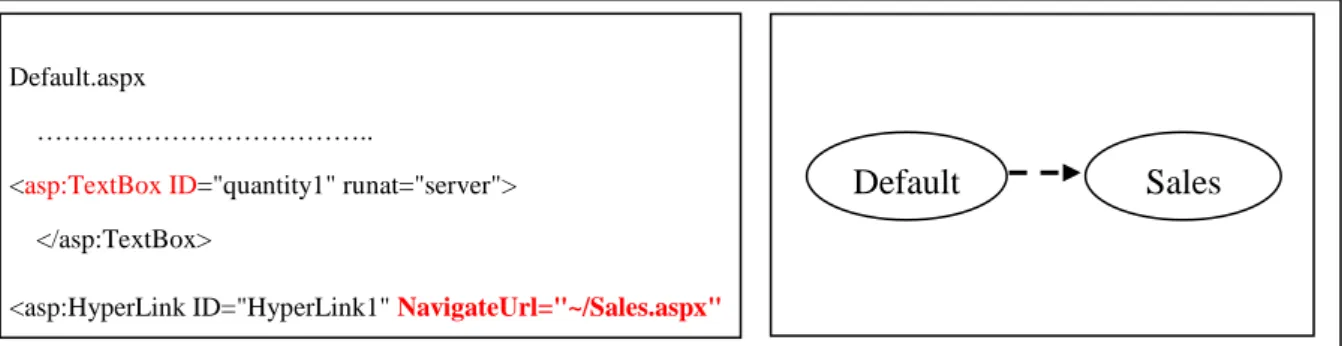
Since the pattern of page edge is ―Response.Redirect‖ and ―NavigateUrl‖ in Table 1,
after executing step 4, we can connect nodes in page-level with corresponding edges as shown
in Figure 6-4.
Default.aspx
………..
<asp:TextBox ID="quantity1" runat="server"> </asp:TextBox>
<asp:HyperLink ID="HyperLink1" NavigateUrl="~/Sales.aspx"
Figure 6-4. Value-oriented dependence graph after executing Step 4 of VDG algorithm
CPay1 CPay2 CPay3
Page_Load
20
Since the pattern of function edge in Table 1, after executing step 5, we can connect
nodes in function-level with corresponding edges as shown in Figure 6-5.
protectedvoid Page_Load(object sender, EventArgs e) { show(); }
Figure 6-5. Value-oriented dependence graph after executing Step 5 of VDG algorithm
Since the pattern of code edge in Table 1, after executing step 6, we can connect nodes in
code-level with corresponding edges as shown in Figure 6-6.
………. Int32 a=0; if (int.Parse(vquantity2) <= 0) {
………. Label3.Visible = false; } else { ……….
Session["total"] = a.ToString();
Total.Text = Session["total"].ToString(); } ………..
Figure 6-6. Value-oriented dependence graph after executing Step 6 of VDG algorithm
Since the pattern of input variable in Table 2, after executing step 7, we can construct
input variables of each page as shown in Figure 6-7.
Page_Load show
CPay1
CPay2
21 Default.aspx
………..
<asp:TextBox ID="quantity1" runat="server"> </asp:TextBox>
………..
Figure 6-7. Value-oriented dependence graph after executing Step 7 of VDG algorithm
Since the pattern of global variable in Table 2, after executing step 8, we can construct
global variables of each page as shown in Figure 6-8.
Pay.cs
……….. a = 500 * int.Parse(vquantity1);
Session["total"] = a.ToString();
Total.Text = Session["total"].ToString(); ………..
Figure 6-8. Value-oriented dependence graph after executing Step 8 of VDG algorithm
Since the pattern of input variable, after executing step 9, we can construct tainted
variables of each page as shown in Figure 6-9.
Pay.cs
………..
string vquantity1=Request.Params["quantity1"];
a = 500 * int.Parse(vquantity1);
Session["total"] = a.ToString(); ………..
Figure 6-9. Value-oriented dependence graph after executing Step 9 of VDG algorithm
Default quantity1 Pay In:Session[―total‖] Out:Session[―total‖] T(quantity1)={vquantity1,a, Session[―total‖]} Pay
22
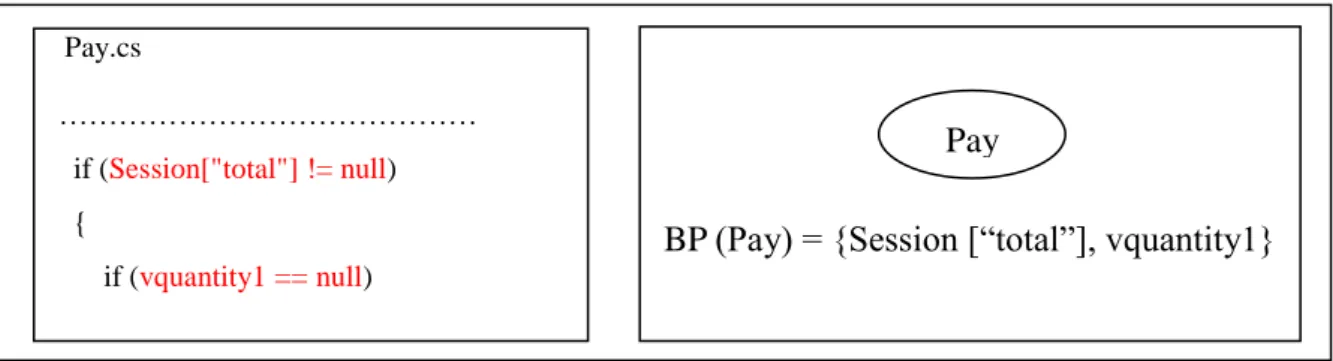
Since the pattern of branch predicate variables in Table 2, after executing step 10, we can
construct branch predicate variables of each page as shown in Figure 6-10.
Pay.cs
……… if (Session["total"] != null) {
if (vquantity1 == null)
Figure 6-10. Value-oriented dependence graph after executing Step 10 of VDG algorithm
Since the branch predicate variables and tainted variable, after executing step 11, we can
construct tainted variables in branch predicate of each page as shown in Figure 6-11.
TBP (Pi)= (
n i pi BP 1 ) ( )∩(
m j vj T 1 ) ( )Figure 6-11. Value-oriented dependence graph after executing Step 11 of VDG algorithm
3.3 State Transition Diagram
In the section, we first introduce problem decomposition idea to improve collaborative
testing, and then a novel Web application model, state transition diagram, and the
corresponding construction algorithm will be presented in this section. An example of state
transition diagram construction algorithm will be also provided in this section.
3.3.1 Problem decomposition
Value-oriented dependence graph provides an opportunity to refine collaborative testing.
For further improving collaborative testing, we decompose the Web application testing
problem into several sub-problems as shown in Figure 7. Each sub-problem which is easier BP (Pay) = {Session [―total‖], vquantity1}
Pay
TBP(Pay)={vquantity1,vquantity2 }∩{vquantity1,vquantity2,Session [―total‖],a}={vquantity1,vquantity 2}
23
than original problem because of the smaller size of sub-problem can be independently solved.
Afterwards, we can parallelly assign these sub-problems to different folk testers. This parallel
property can speed up the whole collaborative testing. However, this parallel assignment
requires a proper label design to integrate different test results for following job assignments
and final test report. And then, we can easily merge these sub-problems by tracing back
according to the labels of all sub-problems.
Original Problem: Web application testing
... ... ... Reduced Sub-problem 1.1 Reduced Sub-problem 1.2 Reduced Sub-problem 2.1 Reduced Sub-problem 2.2 Reduced Sub-problem 2 Reduced Sub-problem 1 Using: Value-oriented Dependency graph Reduced sub-problem i ... ... Reduced Sub-problem i.1 Reduced Sub-problem i.2
Figure 7. Idea of problem decomposition
3.3.2 Definition of State Transition Diagram
According to the idea of problem decomposition, we propose a novel Web application
model, state transition diagram, which is a fine-grained tree structure model. And it also
overcomes the cyclic problem in Web application testing under basic blocks coverage criteria.
The state transition diagram models users‘ runtime behaviors according to different basic
blocks coverage. Each state including two parts represents a behavior of the page. The first
part is the page number, and the second part is the set of the tainted variables in branch
predicate and its values which lead to different behaviors of program. The formal definition of
24
Definition 6: State transition diagram State transition diagram
VTBPi is a tainted variable in branch predicate
D= (S, δ, S0), where
S = {Si | Si is a state}, where
Si= (N, C), where
N ∈ { i | PAi is a page}
C ⊆ {(VTBPi, Ri) | VTBPi ∈ V, Ri ∈ R, i=1~n}, where
V= {VTBPi | VTBPi is a tainted variable in branch predicate} is a set of tainted variables in
branch predicate
R= ∏i=1nR(VTBPi)=R(VTBP1) ×R(VTBP2) ×…×R(VTBPn), where R(VTBPi) is an image of
variable VTBPi
δ is a transition function δ (Si, A)=Sj, where
A ⊆ {(VTBP, Ri)| Vi ∈ V, Ri ∈ R, i=1~n}
S0 is an initial state
Figure 8 shows the state transition diagram in Example 1. Compared to value-oriented
dependence graph, the tree structure provides a kind of problem decomposition. Each path
from root represents a sub-problem of Web application testing. The details of state transition
25
1,{(Session[“total”],null) } {(q1,<=0) ,(q2,null),(Session[“total”],null}
2,{(q1,<=0) ,(q2,null),(Session[“total”],null} 2,{(q1,> 0),(q2,null),(Session[“total”],null)} 3,{ (Session[“total”],null)} {(q1,> 0),(q2,null),(Session[“total”],null)} 3,{(Session[“total”],!null) } 0 0.1 0.3 0.2 0.1.1 { (Session[“total”],null)} {(Session[“total”],!null) } S0 S1 S4 S2 S3 2,{(q1,null),( q2, <=0),(Session[“total ”],null)} {(q1,null) ,(q2,<=0),(Session[“total”],null} S5 0.3.1 2,{(q1,null),( q2, <=0),(Session[“total ”],null)} {(q1,null) ,(q2,>0),(Session[“total”],null} 0.3.2 S6 2,{(q1,null) ,(q2, <=0),(Session[“total ”],!null)} S7 0.1.1.1 2,{(q1,null) ,(q2, <=0),(Session[“total ”],!null)} {(q1,null) ,(q2,<=0),(Session[“total”],!null} {(q1,null) ,(q2,>0),(Session[“total”],!null} S8 0.1.1.2
Figure 8. State transition diagram in Example 1
3.3.3 State Transition Diagram (STD) construction algorithm
From the purpose of speeding up collaborative testing, we first apply Breadth-First
Search (BFS) on the page-level of value-oriented dependence graph to parallelly distribute
folk testers. At each new visiting page, we further drill down to code-level of value-oriented
dependence graph to identify different states based on distinct program flow. In the
meanwhile, the proper label is created for these new states. The details of state transition
26
State transition diagram algorithm Input:
Value-oriented Dependence graph G,
C[i]: tainted variable in branch predicate C of each page PAi,
S0:initial state which Label 0,
N[i]:start basic block of each page PAi
color(i,c): node c is in code level of page PAi
Output: State transition diagram STD D=(S, δ, S0)
Method:
Initial: S=∅, δ=∅ , j=1, k=1
Step1: for each page number P which from small to large ∈ adj [S0.N] in G
ConstructionNextState (S, P) Step2: For each new state s‘ in S
2.1: k=1
2.2: for each page number P which from small to large ∈ adj[s‘.N] in G ConstructionNextState (s‘, P)
Step3: Repeat Step2 until there is no new state.
Subroutine: ConstructionNextState Input:
S: State
P: Page number
Output: null
Step1: IF S0 modify global value update global variable value of C[i]
ELSE update global variable value with S0 of C[p]
Step2: add the variable of edge into C[p] Step3: for each node c
Color (p,c)=white
Step4: StateCreation (S0,p, C[p],N[p],0)
27 Subroutine: IsANewState Input: SP: Previous state s: state i: Previous label Output: null Method:
Step1: IF the first part of s exists IF the second part of s exists Remove the state s Else
Add s into S in Sj, j++
Add second part of Sj into edge from SP to Sj
Label i.k, k++ Subroutine: StateCreation
Input:
SP:Previous state
p: page number
C[p]: tainted variable in branch predicate of p c0: start basic block of each page
i: Previous label Output: null
Method:
Step1: IF number of out-degree of c0 is zero or Color is black
1.1: color (p, c0)=black
1.2: Add p into first part of S‘
1.3: Add coming edge condition into second part of S‘
1.4: IsANewState(SP,S‘,i)
Step2: for each basic block c‘ in neighborhood of c0
IF condition of coming edge of c‘ accords with C[p]
2.1: add condition of coming edge of c‘ into second part of S‘ 2.2: color (p, c0)=black
28
3.3.4 Example of Constructing State Transition Diagram
The Example 3 is given to illustrate the state transition diagram construction algorithm,
where Figures 9-1 to 9-2 show the result after executing steps 1 to 2, respectively.
Example 3:
The Example 3 continues Example 2. According to the value-oriented dependence graph,
tainted variables in branch predicate of each page, and initial state, we can construct the state
transition diagram.
Since the first part of initial state, we find outgoing edge in page-level of VDG, and then
according to tainted variable in branch predicate of the page we search code-level of VDG,
after executing step 1, we can construct the new state of initial state. Second, if the state
doesn‘t exist then label and add to state transition diagram as shown in Figure 9-1.
Default Pay Sales
Page Level
Code Level
CPay2
Button1_Click Page_Load Button1_Click Function Level {(quantity1, int)} {(quantity2, int)} CPay5 CPay8 CPay3 CPay4 CPay1
CPay6 CPay7 CPay9 CPay10 (Session[“total”],!null),(q1,null) (Session[“total”],null),(q2,null) (Session[“total”],null),(q1,null)
(q2,<=0) (q2,>0) (q1,<=0) (q1,>0) CDefault1 CSales1 (q2,<=0) (q2,>0) Session[“total”] 1 2 3 1 1 1
Figure 9-1. State transition diagram after executing Step 1 of STD algorithm S0
2, {(q1,<=0),(q2,null),(Session *“total”+, null)-
,(q1,<=0),(q2,null),(Session *“total”+, null)-
1, ,(Session *“total”+, null)- 0
S0
S1 0.1
2, {(q1,<=0),(q2,null),(Session *“total”+, null)-
1
, ,(Session *“total”+, null)- Initial state: S029
Since the first part of the given new state we find outgoing edge in page-level of VDG,
and then according to tainted variable in branch predicate of the page we search code-level of
VDG, after executing step 2, we can construct new state of the given new state. Second, if the
state doesn‘t exist then label and add to state transition diagram as shown in Figure 9-2.
1,{(Session[“total”],null) } {(q1,<=0) ,(q2,null),(Session[“total”],null}
2,{(q1,<=0) ,(q2,null),(Session[“total”],null} 2,{(q1,> 0),(q2,null),(Session[“total”],null)} 3,{ (Session[“total”],null)} {(q1,> 0),(q2,null),(Session[“total”],null)} 0 0.1 0.3 0.2 { (Session[“total”],null)} S0 S1 S2 S3
Default Pay Sales
Page Level
Code Level
CPay2
Button1_Click Page_Load Button1_Click Function Level {(quantity1, int)} {(quantity2, int)} CPay5 CPay8 CPay3 CPay4 CPay1
CPay6 CPay7 CPay9 CPay10 (Session[“total”],!null),(q1,null) (Session[“total”],null),(q2,null) (Session[“total”],null),(q1,null)
(q2,<=0) (q2,>0) (q1,<=0) (q1,>0) CDefault1 CSales1 (q2,<=0) (q2,>0) Session[“total”] 1 2 3 1 1 1 1,{(Session[“total”],null) } {(q1,<=0) ,(q2,null),(Session[“total”],null}
2,{(q1,<=0) ,(q2,null),(Session[“total”],null} 2,{(q1,> 0),(q2,null),(Session[“total”],null)} 3,{ (Session[“total”],null)} {(q1,> 0),(q2,null),(Session[“total”],null)} 3,{(Session[“total”],!null) } 0 0.1 L3 0.2 0.1.1 { (Session[“total”],null)} {(Session[“total”],!null) } S0 S1 S4 S2 0.3
Figure 9-2. State transition diagram after executing Step 2 of STD algorithm
Repeat step 2 until has no new states and state transition diagram as shown in Figure 9-1. 3,{(Session[“total”], !null)}
30
Chapter 4 Dynamic stubbing technique for collaborative testing
In the chapter, we first provide an example to illustrate that different assignment leads to
distinct test cost in collaborative testing. The formal problem formulation of Minimum Test
Cost Problem (MTCP) in collaborative testing is presented in this chapter. We also prove
MTCP is NP-complete and hence propose a heuristic-based dynamic stubbing algorithm to
solve this optimization problem.
4.1 Motivating example
Figure 10 shows a simple Web application which contains nine states and eight sub-problems. Assume that each sub-problem needs to be executed once for completing test
and three folk testers A, B, and C are involved in this test. The completion time of each
sub-problem by different folk tester is listed in Table 3. The due time of collaborative testing
is set to be the last folk tester finishing the assigned jobs.
Problem 0 Sub-problem 0.1 Sub-problem 0.2 Sub-problem 0.3 Sub-problem 0.1.1 Sub-problem 0.3.1 Sub-problem 0.3.2 Sub-problem 0.1.1.1 Sub-problem 0.1.1.2
31
Table 3. Sub-problem completion time of each folk tester matrix
0.1.1.1 0.1.1.2 0.2 0.3.1 0.3.2
Tester A 160 sec 160 sec 80 sec 120 sec 120 sec
Tester B 165 sec 165 sec 85 sec 125 sec 125 sec
Tester C 170 sec 170 sec 90 sec 130 sec 130 sec
Two different assignments of the example are shown in Table 4 and Table 5. In each table,
entryij=1 represents that the jth job is assigned to ith tester. Assignment 1 represents that three
folk testers have centralized preference on sub-problem 0.1.1.1 and assignment 2 is unbiased
on testers‘ preferences. The due time of these two assignments are 390 sec and 300 sec as shown in Figure 11 and 12. This example illustrates that different assignment leads to distinct
test cost (due time) and the centralized preferences of folk testers will delay the whole
collaborative testing.
Table 4. Assignment 1 for shopping Web-site testing
0.1.1.1 0.1.1.2 0.2 0.3.1 0.3.2
Tester A 1 0 0 1 0
Tester B 1 1 0 0 0
Tester C 1 0 1 0 1
Table 5. Assignment 2 for shopping Web-site testing
0.1.1.1 0.1.1.2 0.2 0.3.1 0.3.2
Tester A 1 0 0 1 0
Tester B 0 0 0 0 1
32
Figure 11. Due time of assignment 1
Figure 12. Due time of assignment 2
4.2 Minimum Test Cost Problem in Collaborative Testing
Under Internet environment, there are a large number of free and experienced folk
human resources. Collaborative testing (or called Beta test) is usually used in online game and
open source software to reduce test cost in software development stage. Based on the idea of
beta test, we use folk testers in Internet to help us finding and reporting bugs. There are some
constraints while applying collaborative testing. First, folk testers may not start to test at the
0
200
400
600
Tester A
Tester B
Tester C
0
100
200
300
400
Tester A
Tester B
Tester C
33
same time and they may delay to start the next test job after finishing current jobs. Second, we
only consider those folk testers contributing themselves to collaborative testing. Therefore,
each folk tester solves one sub-problem at least. Third, due to different complexity of each
sub-problem, each sub-problem has distinct support threshold for completion. And then, the
quality of folk testers (trustworthy) is different in Internet; therefore, it needs to consider the
accumulation of the testers‘ trustworthy, rather than the number of testing. Final, each folk tester has different workload.
Before presenting our problem formulation, we first introduce the notations in Table 6.
The variables i represents the ith folk tester, the variable j represents jth sub-problem, and the
variable k represents kth assignment of the sub-problems. We use the binary variable. σijk
equals to 1 represents that the jth sub-problem is assigned to the ith folk tester in the kth
assignment. Otherwise, σijk equals to 0. TDe(i, j) stands for the delay time of the ith folk tester
start to solve the jth sub-problem, TEx(I, j) stands for the jth sub-problem execution time of the
ith folk tester, and T (i, j) stands for the jth sub-problem completion time of ith folk tester. Wi
represents the trustworthy of ith folk tester and Hi represents the workload of the ith folk tester.
34
Table 6. Notations of MTCP in collaborative testing
i = ith folk tester
j = jth sub-problem
k= kth assignment of the sub-problems
σijk= ith folk tester does the jth sub-problem in the kth assignment
TDe(i, j)= the jth sub-problem delay time of the ith folk tester
TEx(i, j)= the jth sub-problem execution time of the ith folk tester
T (i, j)= the jth sub-problem completion time of ith folk tester
Wi= the trustworthy weight of ith folk tester
Hi= the available time limit of the ith folk tester
STj=support threshold of the jth sub-problem
4.2.1 Problem formulation
The Minimum Test Cost Problem (MTCP) in collaborative testing can be formulated as
IP-formulation. The objective function is the minimum of due time on different assignment,
when due time is the maximum of the sum of sub-problem‘s time of each folk tester. The
constraint 6 is the complete condition that each sub-problem need to be tested at least support
35
Definition 7: Minimum Test Cost Problem (MTCP) definition Objective function:
j ijk i kmax
T
(
i
,
j
)
min
Subject to: 1.σijk ∈ {0, 1} , ∀i, j, k 2. TDe(i, j) ∈ R+ 3. TEx(i, j) ∈ R+ 4. T (i, j) ∈ R+ 5.
j ijk 1, k 6.
i j ijk i ST k W * , 7. STj >0 8.
j i ijk H k j i T( , ) , 9. Hi ∈ R+ 10.
j i ijk ijk k k k k , 2 ') 0, , ', ' ( 11. 0< Wi ≤ 136
4.2.2 NP-Complete problem
In the section, we introduce an NP-complete problem, Job Assignment Problem (JAP)
[30]. Then, JAP can be reduced in polynomial time to MTCP to complete the proof as
followed.
The corresponding decision problem of Minimum Test Cost Problem (MTCP):
MTCP = {<D, J, U, ST, W, H, T, t>}
D= (S, δ, S0) is a directed tree.
J is a set of sub-problems in D.
U is a set of folk testers.
ST is a function form JR+
W is a function form U(0, 1]
H is a function form UR+
T is a function form UJR+
And there is an assignment with due time at most t
Theorem 1
Minimum Test Cost Problem is NP-Complete.
Proof:
First, we show that MTCP belongs to NP. Given an instance of the problem, the
verification algorithm checks that sum of trustworthy Wi of assigned sub-problems of every
folk tester i of each sub-problem j exceeds the support threshold STj, the sum of the
completion time of assigned sub-problems of each folk tester i does not exceed Hi, the
assignment of the sub-problems differs from the other assignment of the sub-problems, and
checks whether the maximum of the sum of the completion time of assigned sub-problems of
37
Second, to prove that MTCP is NP-Hard, we show that JAPp MTCP. Let G=(V‘,E‘),
J‘={Pi|i=1,…,n}, U‘={Ui|i=1,…,m}, d(i, j)=0, the confirm function S(k) ∀k∈Pi, the
trustworthy function w by w(i, j) where i ∈U‘and j ∈J‘, the human resource function H by H(i)
∀i∈U‘, the execution time function T by T(Pi, j) ∀Pi∈J‘, j∈U‘, and the maximum total cost at
most t of JAP. We construct an instance of MTCP as follows. We form the tree D= (S, δ, S0)
where S=Pi, δ=0, S0=Pi and we define the test sub-problem set J=J‘, the folk tester U=U‘, the
support threshold function ST by STj=1 ∀j∈J, the trustworthy function W by Wi=w(i,j) ∀i∈U,
the available time function H by Hi=H(i) ∀i∈U, the completion time function T by T(i,
j)=T(Pi, j) ∀i∈U, ∀j∈J.
The instance of MTCP is then <D, J, U, ST, W, H, T, t>, where is easily formed in
polynomial time.
We now show that graph G‘ has an assignment δ of the maximum total cost at t if and only if the tree D‘ has an assignmentσ‗ of the maximum due time at most t. Suppose there is an assignmentδwith maximum cost at most t. Therefore, there exists an assignment σ‘ such that ijk 1 if ij 1, the support threshold STj=1 ∀j∈J , the trustworthy weight of folk
tester Wi=w(i,j) ∀i∈U, the available time Hi=H(i), the completion time T(i, j)=T(Pi,j) ∀i∈U,
∀j∈J. Thus, the assignment σ‘ is feasible solution and the maximum due time is t. Conversely, suppose that there is an assignment σ‘ with the maximum due time is t. Then, there existed an
assignment a such thatij ijk, the trustworthy w(i, j)=Wi ∀i∈U‘ and j∈J‘, the human
resource H(i)=Hi ∀i∈U‘, the execution time T(Pi, j)=T(i,j) ∀Pi∈J‘, ∀j∈U‘. Thus, the
assignment is a feasible solution and the maximum total cost is t. Hence, MTCP is
38
4.3 Dynamic stubbing algorithm for Minimum Test Cost Problem
Because Minimum Test Cost problem (MTCP) is an NP-Complete problem, we propose
heuristic approach to solve MTCP. First heuristic is to assign new coming tester the job which
requires the most effort to compete. This heuristic can speed up the whole testing. However,
the sub-problem completion time of different folk testers is distinct. Therefore, we further
predict the completion time to balance the following job assignments. Second heuristic is to
assign tester with high trustworthy the most doubting job. Since the quality of folk testers is
not the same, there may be opposite result on the same sub-problem. The second heuristic is
used to improve the quality of test report.
Before presenting our heuristic-based approach, the used notations are introduced in
Table 7. U represents the set of the folk testers, and Wi represents the trustworthy of the ith
folk tester. Mj represents the complexity of jth sub-problem. Sj represents the testing support of
the jth sub-problem and STj represents the support threshold of the jth sub-problem. TA (i, j)
stands for the actual execution time of the jth sub-problem done by the ith folk tester, and TEv(i,
j) stands for the evaluation time of the jth sub-problem done by the ith folk tester. FP (Sk)
represents the average trustworthy of folk testers which report bugs at the state k, and FN (Sk)
represents the average trustworthy of folk tester which don‘t report bugs at the state k. The details of these notations and the following proposed dynamic stubbing algorithm are listed
39
Table 7. Notations of Dynamic stubbing algorithm
Folksonomy user:
U= {i | i is the ith tester} is a set of folk testers
Trustworthy weight of the ith folk tester:
Wi ∈ (0, 1]
Complexity:
Mj=#line of code in sub-problem j
Support of the jth sub-problem:
Sj=
i i Ev A i j T i j W T (, ) ( ( , ))* ) (Support threshold weight of the jth sub-problem:
STj=Mj*c, where c is a constant
Actual execution time of the jth sub-problem, which had done by the ith folk tester:
TA (i, j) ∈ R+
Evaluation time of the jth sub-problem by the ith folk tester:
TEv (i, j) ∈ R+
Average trustworthy weight of folk testers which report bug at the state k
FP (Sk) =
Ut i i t W U 1, where Ut is the set of folk tester report bugs at the state k
Average trustworthy weight of folk testers which don‘t report bug at the state k
FN (Sk) =
Ut i i t W U 140
Dynamic stubbing algorithm Input:
User Profile
TEv(i, j):evaluation time of sub-problem j of tester i
State Transition Diagram D=(S, δ, S0)
S (PR): a set of all sub-problems
PR: a set of sub-problems
Output:
Testing time
Method:
Initial: PR=null, for each sub-problem j in S (PR) InitialMetadata(j)
Step1: for each sub-problem in S (PR) find the set of sub-problem S (PR) which the most
required tested
1.1: PR=FindTestedProblem(S (PR))
Step2: GuidingTester(PR,Ui)
Step3: IF the jth sub-problem of the ith tester has done
3.1: updating Sj=Sj + (TA (i, j)-TEv(i, j))*Wi
Step4: IF (Sj>STj, ∀j)
Testing Finish
ELSE
41
Subroutine: InitialMetadata Input: Sub-problem j
Output: Sub-problem j‘
Method:
Step1: According to the code complexity of j set up the STj of sub-problem j
STj <- X
Sj <- 0
Step2: return j‘
Subroutine: FindTestedProblem Input: S (PR): a set of all sub-problems
Output: a set of sub-problem PR
Method:
Initial: B=S (PR)
Step1: for each problem jin B
1.1: T (j) = (length (j) +1) [(Sj/STj) +α
( ) . ) ( j problem sub k j j T ]Step2: for n=1 to count (Ui)
2.1: add arc j j T( )} min{ into PR 2.2: remove j Step3: return PR
42
Subroutine: GuidingFolkTester Input:
State transition diagram D
F: all user profile
A set of sub-problem PR
A set of folk tester Ui
Output:
Method:
Initial: B=PR
Step1: for each sub-problem j in PR
Return arc min{
( ( ) ( ))| }k k k N k P j F S F S S j Step2: 2.1: IF B≠null
Assign j to the most trustworthy of tester i in Ui
ELSE
Assign arc max{length(j)}
j to the tester i in Ui
2.2: Sj=Sj+TEv(i,j)*Wi
Step3: According to j from left to right
3.1: apply D and F to assign input value which is not tested to the Tester
3.2: for each link L in the tested page
Block link button except the link of entering to the next tested page.
3.3: remove i from Ui
3.4: remove j from B
![Figure 6-9. Value-oriented dependence graph after executing Step 9 of VDG algorithm Default quantity1 Pay In:Session[―total‖] Out:Session[―total‖] T(quantity1)={vquantity1,a, Session[―total‖]} Pay](https://thumb-ap.123doks.com/thumbv2/9libinfo/8459829.183120/31.892.136.804.836.1058/dependence-executing-algorithm-quantity-session-session-quantity-vquantity.webp)