國 立 交 通 大 學
電信工程學系
碩 士 論 文
中繼式正交分頻多工存取系統之公平動態資源分配
Dynamic Resource Allocation for Relay-based
OFDMA Systems With Fairness Considerations
研究生:盧彥碩
指導教授:蘇育德 博士
中繼式正交分頻多工存取系統之公平動態資源分配
Dynamic Resource Allocation for Relay-based OFDMA
Systems With Fairness Considerations
研究生:盧彥碩 Student:Yen-Shuo Lu
指導教授:蘇育德博士 Advisor:Dr. Yu T. Su
國 立 交 通 大 學
電 信 工 程 學 系
碩 士 論 文
A ThesisSubmitted to Department of Communications Engineering College of Electrical and Computer Engineering
National Chiao Tung University in Partial Fulfillment of the Requirements
for the Degree of Master of Science
in Communications Engineering August 2009
Hsinchu, Taiwan, Republic of China
中繼式正交分頻多工存取系統之公平動態資源分配
研究生:盧彥碩
指導教授:蘇育德 博士
國立交通大學電信工程學系碩士班
中文摘要
正交分頻多工存取(OFDMA)網路的系統容量和涵蓋範圍可透過動態、機會 式的資源分配來大幅度的改善。然而這一類的無線資源分配牽涉到眾多系統參數 與設計之選擇及實務考量,複雜度相當高,絕大部分情況下無法有最佳的解決方 案。本文遂只考量於單一基地台、多個合作式中繼台和移動台的細胞式通訊系統 下的實際可行的次佳解。我們考慮的信號格式是類似 IEEE 802.16e 所使用的分 時多工,且只討論上傳的無線資源分配。這些無線傳送資源包含載波、電力和中 繼台。中繼台可能是專用的或者是沒有信號傳送,暫時閒置的移動台。除了第五 章討論的是放大再轉送(amplify and forward)之外我們都假設中繼方式是所謂 的解碼再轉送(decode and forward)。我們首先考慮的系統設計課題是:盡量降低總傳送能量但需滿足傳送率、服 務品質及每一次載波上所能攜帶的位元上限之要求。服務品質是指傳送錯誤率的 大小,這與次載波上所承載的位元量和所需要的傳送電力大小是有一定關係的。 因此位元分配(速率分配)就決定了能量的需求。第二項探討的課題則是在兼顧公 平性的要求下使得傳送速率總和最大,並要滿足每個用戶之電力、服務品質和最 低傳送率要求。 對於以上兩項課題我們個別都提出了兩種線性複雜度的次佳分配法。電腦模 擬結果顯示:我們所提出的演算法皆有甚佳的效能表現,除了達到大量能量的節 省或者是接近最佳的傳送率總和之外,我們也能兼顧維持穩定且良好的用戶間之 公平性。
Dynamic Resource Allocation for Relay-based
OFDMA Systems With Fairness Considerations
Student : Yen-Shuo Lu Advisor : Yu T. Su
Department of Communications Engineering National Chiao Tung University
Abstract
Capacity and coverage of an Orthogonal Frequency Division Multiple Access (OFDMA) network can be greatly enhanced by dynamically and opportunistically allocate the radio transmission resources. We restrict our investigation to a single-cell system with multiple cooperative relay stations and mobile stations (MSs). A TDD scenario is assumed and only the uplink transmission with the base station (BS) handling the resource allocation is considered. The transmission resources include subcarriers, power and relays with the later being dedicated relay stations or cooperative MS’s with unused signal dimensions. We first consider the scenario that the total transmit energy is to be minimized under rates, QoS and maximum per-subcarrier loaded bits constraints where QoS refers to the bit error rate (BER) requirement. As there is a deterministic relation between the number of bits carried by a subcarrier and the power (energy) needed to achieve a desired BER performance, once the QoS requirement is given, bit-loading (rate-assignment) is equivalent to energy appropriation. The second scenario is concerned about the problem of sum rate maximization with a fairness consideration plus power, QoS and minimum rates constraints.
For both scenarios we present two linear-complexity suboptimal solutions. Numerical results are given to show that the proposed solutions do offer attractive performance
advantages of either energy-saving or near-optimal sum-rate while maintaining much improved and robust fairness performance.
誌 謝
首先感謝我的指導教授 蘇育德博士這兩年來不只在研究上的諄諄教誨,使 得此篇論文能更加順利的完成,並且讓我在通訊領域上有更加深入的了解;在人 生的道路上也給予我適時的指引,讓我不至於迷失人生的方向。感謝口試委員給 予寶貴的意見,以補足這份論文的缺失與不足之處。另外也要感謝實驗室的學長 姐、同學以及學弟妹的幫忙還有鼓勵,讓我不僅在學習的過程中獲益匪淺,同時 也為這兩年的生活增添了許多色彩。 最後,我更要感謝一直關心我、鼓勵我的家人以及朋友們,沒有他們在背後 的支持,我無法這麼順利的完成論文,也因為有他們,使得我在繁忙的論文書寫 中不時能浮現一張張的笑臉,給予我繼續向前的動力與勇氣,僅獻上此論文代表 我最深的敬意。Contents
Chinese Abstract i
English Abstract ii
Acknowledgements iv
Contents v
List of Figures vii
List of Tables ix
1 Introduction 1
2 Cooperative Communications and Relay Networks 6
2.1 Relay System and Cooperative Transmission . . . 6
2.2 Relay Strategies and Protocols . . . 7
2.3 Capacity of Cooperative Transmissions . . . 10
3 Rates and QoS Constrained Energy Minimizing Resource Allocation Schemes 11 3.1 System Model and Assumptions . . . 11
3.2 Problem Formulation . . . 12
3.3 Proposed Resource Allocation Schemes . . . 14
I Computing the equivalent channel gains . . . 15
I Subcarriers assignment and bit loading . . . 16
3.3.2 Algorithm B . . . 17
3.4 Numerical Results and Discussion . . . 18
4 Power, Minimum Rate and QoS Constrained Sum Rate and Fairness Index Maximizing Resource Allocation Schemes 24 4.1 System Description and Basic Assumptions . . . 24
4.2 Definitions, Signal Model and Relay Selection . . . 26
4.3 Problem Statement . . . 29
4.4 Fairness Index Analysis . . . 31
4.5 Resource Allocation Schemes with Fairness Consideration . . . 32
4.6 Numerical Results and Discussions . . . 35
5 Resource Allocation in AF Cooperative Networks 48 5.1 Signal-Channel Model and Relay Selection . . . 48
5.2 Numerical Results and Discussions . . . 50
6 Conclusion 52
Bibliography 54
List of Figures
3.1 A cooperative cellular network. . . 13 3.2 The probability density function of the user locations; r0 = 150 m. . . 18
3.3 The probability density function of the user locations; r0 = 150 m. . . 19
3.4 Energy reduction ratio performance as a function of the priority threshold
γ with target BER = 10−3. . . . 20
3.5 Energy reduction ratio performance of the proposed cooperative trans-mission schemes. . . 21 4.1 A cooperative communication network with multiple source and relay
nodes and a single destination node. . . 25 4.2 The effect of SD link’s idled slots on Algorithm B’s sum rate performance;
4 MS users, 3 relay nodes, N = 128, PT = 128, BER = 0.001. . . 37
4.3 The effect of SD link’s idled slots on Algorithm B’s fairness performance; 4 MS users, 3 relay nodes, N = 128, PT = 128, BER = 0.001. . . 37
4.4 Sum rate performance of the proposed and MAS algorithms; 2 MS users, 3 relay nodes, N = 8, PT = 80, BER = 0.001. . . 38
4.5 Fairness performance of the proposed and MAS algorithms; 2 MS users, 3 relay nodes, N = 8, PT = 80, BER = 0.001. . . 38
4.6 Relative sum rate performance of the proposed and MAS algorithms; 2 MS users, 3 relay nodes, N = 8, PT = 80, BER = 0.001. . . 39
4.7 Relative fairness performance of the proposed and MAS algorithms; 2 MS users, 3 relay nodes, N = 8, PT = 80, BER = 0.001. . . 39
4.8 Sum rate performance of the proposed algorithms and the MAS algorithm; rate constraint 50, 3 relay nodes, N = 128, PT = 128, BER = 0.001. . . . 41
4.9 Fairness performance of the proposed algorithms and the MAS algorithm; rate constraint 50, 3 relay nodes, N = 128, PT = 128, BER = 0.001. . . . 41
4.10 Relative sum rate performance of the proposed algorithms; rate constraint 50, 3 relay nodes, N = 128, PT = 128, BER = 0.001. . . 42
4.11 Relative fairness performance of the proposed algorithm and the MAS algorithm; rate constraint 50, 3 relay nodes, N = 128, PT = 128, BER =
0.001. . . 42 4.12 Sum rate performance of the proposed Algorithm A; 4 MS users, 3 relay
nodes, N = 128, PT = 128, BER = 0.001. . . 43
4.13 Fairness performance of the proposed Algorithm A; 4 MS users, 3 relay nodes, N = 128, PT = 128, BER = 0.001. . . 43
4.14 Sum rate performance of the proposed algorithms and the MAS algorithm; 4 MS users, 3 relay nodes, N = 128, PT = 128, BER = 0.001. . . 44
4.15 Fairness performance of the proposed algorithms and the MAS algorithm; 4 MS users, 3 relay nodes, N = 128, PT = 128, BER = 0.001. . . 44
5.1 Sum rate performance of the proposed algorithms and the MAS algorithm; 4 MS users, 3 relay nodes, N = 128, PT = 128, BER = 0.001. . . 51
5.2 Fairness performance of the proposed algorithms and the MAS algorithm; 4 MS users, 3 relay nodes, N = 128, PT = 128, BER = 0.001. . . 51
List of Tables
1.1 Comparison of our proposals and previous related works . . . 5 3.1 Power Minimization Algorithm A (PMA). . . 22 3.2 Power Minimization Algorithm B (PMB). . . 23 4.1 Maximization Sum Rate Algorithm A (MSRA): A subcarriers, power and
relay assignment scheme for a multiple-relay cooperative communication network. . . 45 4.2 Maximization Sum Rate Algorithm B (MSRB): A subcarriers, power and
relay assignment scheme for a multiple-relay cooperative communication network. . . 46 4.3 The Modified Awad-Shen (MAS) Algorithm. . . 47
Chapter 1
Introduction
In spite of their relatively low deployment cost when compared with the wireline networks, future cellular networks are expected to support a wide variety of broadband service, thanks to the advancements in wireless technologies among which the Orthogonal Frequency Division Multiple Access (OFDMA) has enjoyed a overwhelming popularity due in part to its robustness against frequency selective fading and its flexibility in radio resource allocation for meeting various QoS requirements. It has been adopted or considered as a candidate multiple access scheme for many future local area or wide area broadband wireless networks.
OFDMA eliminates the frequency selectivity effect by transmitting a wide band signal on multiple orthogonal subcarriers, effectively converting it into parallel narrow-band signals. In a multiuser system, different subcarriers can be allocated to different users to provide an equivalent frequency division multiple access. As the link conditions are independent of one another, a subcarrier experiences deep fade for one user may yield satisfactory frequency gain for another user. As a result, an OFDMA system can exploit the so-called multi-user diversity in frequency selective fading channels by as-signing a subcarrier to the MS with the highest channel gain [1]. Another dimension of the multi-user diversity that worth exploiting is resource sharing and coordination. By offering each terminal’s unused resources to those needed and dynamically coordinat-ing the transmission schedules and contents, a cooperative communication network is
expected to achieve much higher throughput. Indeed, recent investigations have shown that if suitable coordination among nodes in a wireless network is in place, a relay-based cooperative communication scheme that incorporates the cooperative relays as a trans-mission option can significantly improve the performance of a wireless link and extend the coverage range. System capacity and throughput can also be enhanced through proper cooperation. For this reason, IEEE has formed a task force to develop multi-hop relay specifications for 802.16 air interface.
The problem of resource allocation in conventional OFDMA systems or in relay-aided OFDMA system has been intensively studied. Both decode-and-forward (DF) and amplify-and-forward (AF) relaying have been investigated. When a relay node is located nearer to the destination than the source, AF may be a better relay strategy because the probability of decode error on the relay node is higher. On the other hand, when a relay node is closer to the source than the destination, the received signal-to-noise ratio (SNR) may be higher enough to decode correctly and DF is a better option. The power allocation of a DF-based cooperative OFDM system was proposed in [2]. It also discussed the issue that under what condition a relay should be used. Weighted sum rate maximization (WSRmax) and weighted sum power minimization (WSPmin) problems were considered in [3]. The authors employed the Lagrange dual decomposition method to efficiently solve both optimization problems. A centralized utility maximization framework was considered in [4]. It was shown that the optimization of physical-layer transmission strategies, i.e., relay strategies and resource allocation (RA), can be done efficiently by introducing a set of pricing variables as weighting factors with the goal of maximizing the utility function of the application layer. Algorithms for subcarriers/time allocation on a relay-based OFDMA system for different frame structures such as time division or frequency division can be found in [5]. In [6], [10], they considered fairness aware adaptive resource allocation in single hop OFDM system. they impose proportional fairness constraints to make sure each user can achieve a required
date rate. [7] considered RA in OFDMA relay networks with fairness constraints on relay nodes. The authors applied a graph theoretical approach to transform the RA problem into a linear optimal distribution problem.
In this thesis, we regard subcarriers, relays and transmit power as part of the radio resource so that the RA problem becomes that of relay selection and subcarriers and power (or bits) assignment. Two performance criteria are considered. The first criterion considered is total energy minimization while the second criterion aims to maximize the overall sum rate with fairness consideration. In designing resource allocation schemes to meet the first criterion, we require that they subject to rates, BER (QoS) and maximum loaded bit number per subcarrier constraints. As for the other criterion we demand that the solutions satisfy the minimum rate, total power, and QoS constraints. The proposed algorithms require relatively low computing complexity but give near-optimal performance.
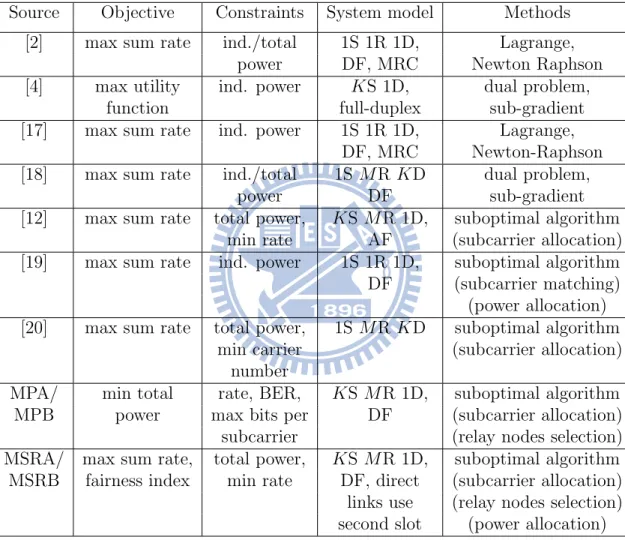
Compared with the major RA works reported in Table 1.1, we are dealing with more complicated problems, having to allocate more resources while subjecting to more constraints, which of course demand new solutions. For the first criterion, the resources include power, subcarrier and relay nodes and the constraints are rates, BER (QoS) and maximum loaded bit number per subcarrier. For relay node selection, we consider two different conditions and propose two solutions accordingly. For subcarrier assignment, we propose a pre-assignment partition approach that divides the subcarriers into several groups before assignment. For the second criterion, the resources considered are the same as the first one. We try to maximize the sum rate with a fairness consideration while meeting the minimum rate, total power, QoS constraints. The proposed protocol first determines if cooperative relay is beneficial based on a performance metric. If affirmative, the ensuing relay node selection is based on the same metric. In subcarrier allocation, we use a constraint-relaxation approach and take sum rate and fairness into account simultaneously. We also have a fine-tune step to ensure that all constraints are
met.
The organization of this thesis is as follows. The following chapter provides a general introduction to the relay-based cooperative communication paradigm. Chapter 3 deals with the first performance criterion and Chapter 4 presents solutions for the second criterion. Both chapters begin with a section on system model and assumptions that are needed for subsequent discussions. We then introduce new terminologies, definitions and derive some useful relations so that we can formulate the problem of concern in a compact form. The proposed algorithms are given in the following section and numerical performance and related discussions are given in the last section. These two chapters deal with DF-based cooperative networks, the extended solutions for AF-based networks are given in Chapter 5. Finally, we provides some concluding remarks in Chapter 6.
Table 1.1: Comparison of our proposals and previous related works
Source Objective Constraints System model Methods
[2] max sum rate ind./total 1S 1R 1D, Lagrange,
power DF, MRC Newton Raphson
[4] max utility ind. power KS 1D, dual problem,
function full-duplex sub-gradient
[17] max sum rate ind. power 1S 1R 1D, Lagrange,
DF, MRC Newton-Raphson
[18] max sum rate ind./total 1S MR KD dual problem,
power DF sub-gradient
[12] max sum rate total power, KS MR 1D, suboptimal algorithm
min rate AF (subcarrier allocation)
[19] max sum rate ind. power 1S 1R 1D, suboptimal algorithm DF (subcarrier matching)
(power allocation) [20] max sum rate total power, 1S MR KD suboptimal algorithm
min carrier (subcarrier allocation)
number
MPA/ min total rate, BER, KS MR 1D, suboptimal algorithm
MPB power max bits per DF (subcarrier allocation)
subcarrier (relay nodes selection)
MSRA/ max sum rate, total power, KS MR 1D, suboptimal algorithm MSRB fairness index min rate DF, direct (subcarrier allocation)
links use (relay nodes selection) second slot (power allocation)
Chapter 2
Cooperative Communications and
Relay Networks
2.1
Relay System and Cooperative Transmission
In a wireless communication system, transmitted signals often suffer from frequency selective fading and significant amplitude attenuation due to path-loss and shadowing. The later constraint leads to limited (range) coverage which can be improved by over-building the link with larger antennas and transmit powers. A simpler and more efficient alternate is using dedicated relay stations. The fading effect, on the other hand, can be effectively mitigated by spatial diversity. Since spatial diversity requires that the receive (or transmit) antennas be separated far enough that the corresponding received waveforms experience independent fading, it is not always practical to employ multiple antennas in a mobile station (MS). A transmission protocol that combines the features of both transmit diversity and relaying is the cooperation communication paradigm. A basic cooperative communication system consists of a source node, a relay and a des-tination node so that there are three component links within the system, namely, the source-to-destination (SD) or the direct link, the source-to-relay (SR) link, and the relay-to-destination link. Depending the component links’ conditions, the source can opt to use either only the direct link or all the links. The later option offer both diversity and
range gains if proper timing, waveform and radio resource coordinations amongst all nodes are in place. The cooperative diversity is achieved at the destination by combin-ing multiple signal copies from independently faded paths while the transmission range is increased by the additional hop when the source opts to relay part of or the entire waveform.
It is clear that cooperative communications take advantage of the multiuser diversity, i.e., the spatial, code, time or frequency dimensions that are not used by some network terminals and are made available to other user terminals. The relay nodes can be dedicated relay stations or MS’ which act as temporary relay nodes when there are unused transmission dimensions, i.e., the time slots, subcarriers, code channels that were assigned to them happen to be under-loaded.
A general cooperative communication system has multiple sources, relay nodes and destinations. The number of node transition for messages passing through from a source to a destination is called hops. Multi-hop relaying reduces the signal attenuation between the source and the destination by dividing one long path into several shorter links and offering alternative paths to destinations located in the shadow area. The disadvantage of multi-hop relaying is that the transmission delay will be increased as the number of hops grows. There is an obvious trade-off between the reception quality which depends on the number of hops, and the average delay. Two-hop and three-hop relaying achieve most of the throughput gain of multi-hop relaying and also improve the fairness as were shown in [13]. We shall focus on the two-hop relaying scenario.
2.2
Relay Strategies and Protocols
The most commonly used relay strategies in a cooperative communication or relay system are decode-and-forward (DF) and amplify-and-forward (AF). The performance of the two strategies has been intensively studied and compared. For a DF system, the relay nodes decode the transmitted packet first, and then forward the re-encoded
packet to the destination if decoding is successfully. There is another DF strategy called adaptive DF. Adaptive DF in which the source uses either source-relay channel state information (CSI) or feedback from the relay to decide between retransmitting the message or permitting the relay to forward the message does achieve second-order diversity in the high SNR region. In AF mode, the relay nodes may simply amplify their received packets and forward to the destinations. No demodulation or decoding of the received signal is performed in the case. No matter what strategies have been shown to improve the overall rate or diversity in wireless network.
In [15], it points out the location is the key to achieve a good cooperative diversity rather than the specific cooperative strategy. When inter-user channel tends to be a much better channel than either of the user channels, DF is a better option due to its higher received signal-to-noise ratio (SNR). On the other hand, when a relay node is located nearer to the destination than the source, AF may be a better relay strategy because the probability of decode error on the relay node is higher. A mixed DF-AF scheme that can switch to AF mode when relay nodes decode incorrectly is not practical though it can provide a better performance. [15] showed that there is certainly no practical benefit in considering a mixed-mode system since the gain is not worth the trouble.
Time and frequency domain are frequently used resources in wireless communication, and full-duplex and half-duplex are most popular communication protocol. In relay net-works, many previous works assume relay nodes can transmit and receive simultaneously in the same frequency band, i.e., full-duplex. However, since many limitations in prac-tical implementation preclude the terminals from full-duplex, half-duplex gathers more attention. While in half-duplex protocol, the relay node can not receive and transmit simultaneously by using the same communication resource. There are mainly two ac-cess schemes of half-duplex protocol. One is time division duplex (TDD) and the other is frequency division duplex (FDD). The relay node receives and transmits packets at
different time slots when using TDD. Similarly, the relay node receives and transmits packets on different frequency band when using FDD. Most cooperative protocols are consider in time-division multiple-access (TDMA).
In [8], the relay node assists in communication with the destination by either AF or DF the received signal. It proposes three different time-division multiple-access-based relay protocols that vary the degree of broadcasting and receive collision, and only half-duplex considered here. In Protocol I, the source communicates with the relay node and destination during the first time slot. In the second time slot, both the relay and source communicate with the destination terminal. This protocol realizes maximum degrees of broadcasting and receive collision. In Protocol II, the source communicates with the relay and destination over the first time slot. In the second time slot, only the relay node communicates with destination. This protocol realizes a maximum degree of broadcasting but realizes receive collision. The third Protocol is identical to Protocol I apart from the fact that the destination chooses not to receive the direct S −→ D signal during the first time slot. This protocol does not implement broadcasting but realizes receive collision. Note that while the signal conveyed to the relay and destination over the two time slots is the same under Protocol II, Protocol I and III can potentially convey different signals to the relay and destination .
Additional comments on the three protocols described above are in order. This conditions and setup for Protocol I are self-evident. Protocol II is logical in a scenario where the source engages in data reception from another nodes in the network over the second time slot thereby rendering it unable to transmit. Similarly, for Protocol III the destination may be engaged in data transmission to another nodes during the first time slot. Hence, the transmitted signal is received only at the relay nodes and buffered for subsequent forwarding. The different protocols convert the spatially distributed antenna system into effective single-input-multiple-output (SIMO) (with Ptorocol II), multiple- input-single-output (MISO) (with Protocol III), and
input-output (MIMO) (with Protocol I) channels allowing the fundamental gains of multiple-antenna systems such as diversity gain, array gain and interference cancelling gain to be exploited in a distributed fashion. There is still a simple protocol that [8] does not propose. The source communicates with the relay node during the first time slot, and the relay forwards to the destination in the second time slot. This protocol is also considered in many previous works due to its simplicity on the destination.
2.3
Capacity of Cooperative Transmissions
Cover and El Gamal established the capacity theorems for the basic (simplest) cooperative communication (relay) system in [16]. They provide the fundamental idea to extend to general relay systems. If we denote by Xs and Xrthe signals transmitted by
the source and the relay nodes, respectively, and by Yr and Ydthe signals received by the
relay node and destination node, respectively. The relay channel combines a broadcast channel (BC) and a multiple-access channel (MAC). The capacity of any relay channel with channel transition probability, p(yr, yd|xs, xr), is bounded above by
C ≤ sup
p(xs,xr)
min I(Xs, Xr; Yd), I(Xs; Yr, Yd|Xr) (2.1)
where the sup is over all joint distributions p(xs, xr). The relay channel is said to be
degraded if p(yr, yd|xs, xr) can be written in the form
p(yr, yd|xs, xr) = p(yr|xs, xr)p(yd|yr, xr) (2.2)
Equivalently, the relay channel is degraded if p(yd|xs, xr, yr) = p(yd|xr, yr). The previous
discussed Gaussian channel is therefore degraded and the capacity of the degraded relay channel is given by
C ≤ sup
p(xs,xr)
min I(Xs, Xr; Yd), I(Xs; Yr|Xr) (2.3)
where the sup is over all joint distributions p(xs, xr). (2.3) is achieved by the DF strategy
Chapter 3
Rates and QoS Constrained Energy
Minimizing Resource Allocation
Schemes
Many dynamic resource allocation algorithms and optimization techniques have been proposed in the literature for a multiuser OFDM system. The ultimate goal of all these efforts is to reach the highest throughput with minimum transmit power (or energy). The first category is power (energy) adaptive that minimize total used power (energy) given users’ data rates as the constraint. The second category is rate adaptive that maximize the sum rate with the constraint on the total power or individual power. There is also a third category of rate adaptive dynamic resource allocation algorithms which are developed to support variable bit rate services with fairness in the system. In this category while the objective is to maximize the total throughput with the total power constraint, the goal is to maintain the fairness among all users. In this section, we consider the power adaption case with QoS, user rates and maximum link loading constraints.
3.1
System Model and Assumptions
We consider an N-subcarrier OFDMA system in which there is a BS and M MSs randomly distributed within the cell. We assume that uplink channel state information
is available to the BS for resource allocation. Similar to conventional relay-based coop-erative communication systems, we assume a two-phase (time-slot) transmission scheme with perfect timing synchronization among all network users. We further assume that the number of subcarriers assigned to each user is the same and each subcarrier suffers from slow Rayleigh fading so that there is no change of the channel states during a two-phase period. Only the decode-and-forward (DF) cooperative relay is considered. Perfect decoding in the relay node is assumed and maximum-ratio-combining scheme is employed by the destination (BS) node.
To simplify the reception protocol, we require that a demultiplexed data stream from a source user must be carried by the same subcarrier no matter it is transmitted by a source node or a relay node. Such an assumption also make it possible for any MS to act as a source and a relay node simultaneously by allowing part of the subcarriers for relay and the remaining ones for transmitting its own data.
3.2
Problem Formulation
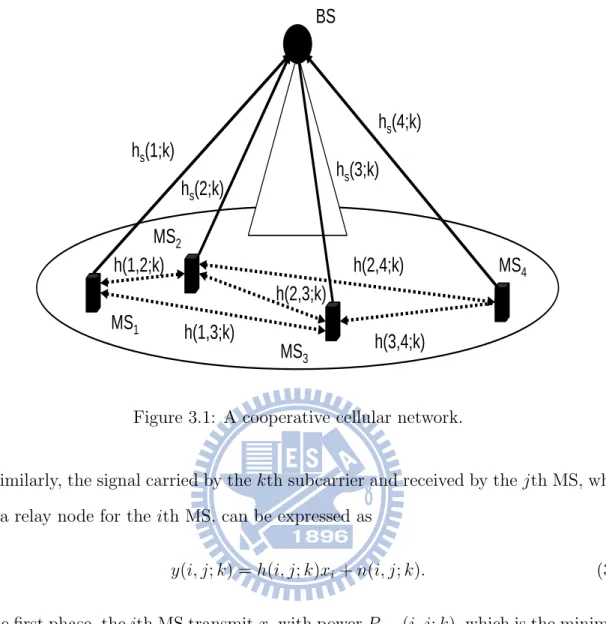
Denoted by h(i, j; k) the fading coefficient for the channel between the ith and the
jth MS when the kth subcarrier is used and by hs(i; k) that for the channel between the
ith MS and the BS. The corresponding transmit powers and received signals are denoted
by P (i, j; k), Ps(i; k), y(i, j; k) and ys(i; k) respectively. Then we have
ys(i; k) = hs(i; k)xi+ ns(i; k). (3.1)
where xi represents the data sent by the ith MS and ns(i; k) is the additive Gaussian
noise for the ith MS to BS link. The corresponding achievable rate is given by
Rs(i; k) ≤ log2 · 1 + Ps(i; k)|hs(i; k)| 2 Γσ2 ¸ . (3.2)
where Γ ' − ln(5∗BER)/1.5 is the signal-to-noise ratio (SNR) gap related to the de-signed BER [9]. For discrete bit-loading, rearranging (3.2) yields
Ps(i; k) ≥ ¡ 2Rs(i;k)− 1¢ Γσ 2 |hs(i; k)|2 def = Pmins (i; k). (3.3)
MS
1MS
3MS
2MS
4BS
h(1,3;k)
h
s(1;k)
h
s(2;k)
h
s(3;k)
h
s(4;k)
h(2,4;k)
h(3,4;k)
h(1,2;k)
h(2,3;k)
Figure 3.1: A cooperative cellular network.
Similarly, the signal carried by the kth subcarrier and received by the jth MS, which acts a relay node for the ith MS, can be expressed as
y(i, j; k) = h(i, j; k)xi+ n(i, j; k). (3.4)
In the first phase, the ith MS transmit xi with power Pmin(i, j; k), which is the minimum
power needed to satisfy the QoS requirement, i.e.,
P (i, j; k) ≥¡2R(i,j;k)− 1¢ Γσ2
|h(i, j; k)|2
def
= Pmin(i, j; k). (3.5)
Relay nodes will transmit the data stream to destination in the second phase. Des-tination receives two scaled data streams and combines two data streams by maximum-ration-combining scheme. The achievable rate of MS user i on subcarrier k with MS j as the relay node is bounded by
R(i, j; k) ≤ log2 · 1 + Ps(i; k)|hs(i; k)| 2+ P s(j; k)|hs(j; k)|2 Γσ2 ¸ (3.6)
The minimum required relay power Pr
min(j; k) is thus given by
Pr min(j; k) = (2R(i,j;k)− 1)Γσ2− P s(i; k)|hs(i; k)|2 |hs(j; k)|2 . (3.7)
The resource allocation is equivalent to the following optimization problem:
minX
i∈M
Ei(t) s.t.
P (i, j; k) ≥ Pmin(i, j; k), Ps(i; k) ≥ Pmins (i; k),
and Ps(j; k) ≥ Pminr (j; k), ∀ i, j, k X k Rs(i; k) = Ri ∀ i Rs(i; k) ≤ Rmax(k) ∀ i, k R(i, j; k) ≤ Rmax(k) ∀ i, j, k (3.8) where Ei(t) = P
k[Ps(i; k) + P (i, j; k)]T represents the energy expended by MS i and
T is the duration of a time slot. Rmax(k) represents the maximum number of bits that
can be sent by subcarrier k per (OFDM) symbol. We assume Rmax(k) = 6 (bits) in
our system. The problem (3.8) is to minimize the overall energy needed for T seconds of transmission. As it is a non-convex optimization problem, solving it in polynomial time is difficult. We present low-complexity suboptimal algorithms that offer acceptable performance for the problem in hand.
3.3
Proposed Resource Allocation Schemes
We propose two suboptimal algorithms to solve the above resource allocation prob-lem. The first algorithm (Algorithm A) requires that an OFDMA user can only have cooperation from a relay node. As a relay cannot always provide the best gains for all subcarriers associated with a source node, this scheme is simple but yields less satis-factory performance. Algorithm B lifts such a constraint and allows signals in different subcarriers of a particular source node be relayed by different relay nodes.
3.3.1
Algorithm A
I Computing the equivalent channel gains
We first define the equivalent channel gain (ECG) for a link from MS i through MS
j (as the relay node) to the BS using subcarrier k by
he(i, j; k) =
1
1
|h(i,j;k)| +|hs(j;k)|1
. (3.9)
The ECGs (3.9) from MS i through all relay nodes using subcarrier k are then computed. If no relay node is involved, the corresponding direct link ECG becomes
he(i, i; k) = 1 1 |hs(i;k)| + 1 |hs(i;k)| = |hs(i; k)| 2 . (3.10)
We further define IM = {1, 2, · · · , M } and the relay gain η(i; k)
η(i; k) = maxj∈IM he(i, j; k)
|hs(i; k)|
def
= he(i; k)
|hs(i; k)|
. (3.11)
which is an indicator to be used for judging if a relay through MS j using subcarrier k would bring about performance improvement for user i. The maximum ECG, denoted by he(i; k) and referred to henceforth as the best ECG for (i, k), and the corresponding
relay MS will be recorded for each (i, k) pair. Define the average relay gain ηi for MS i by
ηi =
PN
k=1η(i; k)
N , (3.12)
which is a measure of the potential relay gain in required transmission energy for MS i. MS i will use relay mode if ηi > 1 and the corresponding relay node is the one which
provides the maximum ECG on the most subcarriers for user i, i.e., MS j is selected as the relay node for MS i if
j = arg max l∈ IM nr(l), nr(l) = N X δ(l − arg max m he(i, m; k)) (3.13)
where δ(l) = 1, if l = 0 and δ(l) = 0, ∀ l 6= 0.
On the other hand, if instead, ηi ≤ 1, MS i will operate in the regular mode using
only the direct link. For fair comparison, the ECG he(i; k) associated with subcarrier k
of a direct link from MS i to the BS is then defined as 2|hs(i; k)|. For convenience, we
still denote the best ECG for MS i and subcarrier k by he(i; k) no matter if the channel
refers to a direct or indirect (with relay) link. I Subcarriers assignment and bit loading
After the best ECGs for all MS’ and all subcarriers are found, we partition the set of subcarriers CM = {1, 2, · · · , M } into the high priority group GH and the low priority
group GL by
GH = {k|ζk ≥ γ}, GL = CM \ GH (3.14)
where γ > 1 is a threshold to be determined, and
ζk = gk(1) gk(2) gk(1) = arg max i∈IM he(i; k) gk(2) = arg max i∈IM\{gk(1)} he(i; k). (3.15)
Subcarriers in each group are re-indexed in descending order of hk = maxihe(i; k) and
then assigned one-by-one according to the newly-sorted order.
The subcarrier assignment process within each group is the same but members of
GL are not assigned until those in GH have all been assigned. Each subcarrier k in
GH is to be allocated to the MS j if j = arg maxi∈IM he(i; k) unless it has been given
enough subcarriers. When that happens, i.e., if MS j has been given N/M subcarriers, and j = arg maxihe(i; k) for some k, then subcarrier k will be assigned to the MS l,
l = arg maxi∈IM\{j}he(i; k) unless the subcarrier quota of MS l has already been satisfied.
For the latter case, subcarrier k will be given to the MS whose he is the third largest
among all he(i; k)’s. Such a procedure continues until all subcarriers in GH have been
After finishing subcarrier allocation, we then start the bit-loading process for each MS user in a bit-by-bit manner. For a given source MS with rate (bit) requirement Ri,
we select within the subcarrier set assigned to it the one that requires the least transmit power increase. The power increase is estimated by (3.3) if it is allowed to use the direct link only and by (3.7) if a relay node is involved. The process repeats until every MS user’s rate (bit) requirement is satisfied. The complete resource allocation algorithm is summarized in Table 3.1.
3.3.2
Algorithm B
Algorithm B differs from Algorithm A in that it regards each subcarrier as a basic resource unit. A source MS can have multiple cooperative relay nodes so that it can distribute its data “cargo” among many subcarrier links with each link having distinct transmission rout. A MS can therefore direct the n/M appropriated subcarriers to reach the BS via various relay MS’. The relay strategy is determined in a per-subcarrier fashion so that a local optimal relay node is always selected.
The procedure for determining whether an MS user needs the help of a relay node for a particular subcarrier or not is the same that used in Algorithm A. In other words, for a given subcarrier we use (3.9), (3.10), (3.11) and (3.12) to calculate the ECG for each candidate relay, the relay gain for each (i, k) and the average relay gain for each MS. The average relay gain ηi is used to decide if MS i should use a relay link. If ηi > 1
the relay nodes information is recorded and the best ECG for subcarrier k and source MS i is given by
he(i; k)def= max
µ max
j he(i, j; k), |hs(i; k)|/2
(3.16) Having computed the best ECG’s for all (i, k) pairs, we then follow the subcarrier as-signment and bit-loading procedure described in the previous subsection, , i.e., Steps 3-5 of Algorithm A. The complete algorithm is summarized in Table 3.2.
3.4
Numerical Results and Discussion
Numerical performance of the proposed algorithms are presented in this section. We
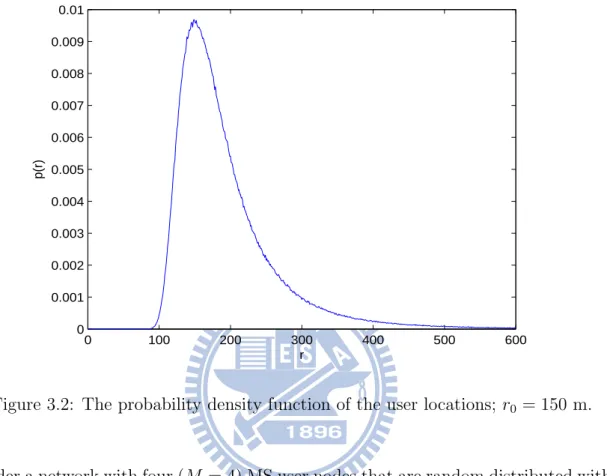
0 100 200 300 400 500 600 0 0.001 0.002 0.003 0.004 0.005 0.006 0.007 0.008 0.009 0.01 r p(r)
Figure 3.2: The probability density function of the user locations; r0 = 150 m.
consider a network with four (M = 4) MS user nodes that are random distributed within a 120-degree section of the 600-meter radius circle centered at the BS. The probability density function (pdf) of the location is given by [11]
P = r40 r5 exp · −5 4 ³r0 r ´4¸ . (3.17)
where r > 0 is the radius. The pdf with r0 = 150 m is plotted in Fig. 3.2 and Fig.
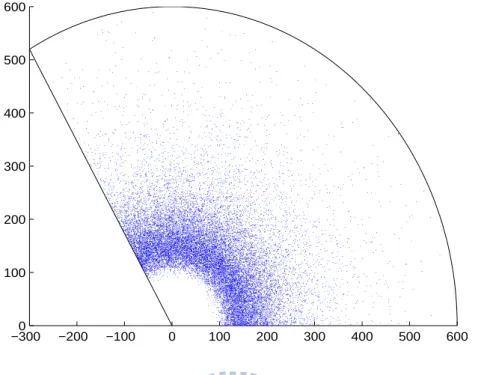
3.3. Each transmitted signal experiences attenuation with a path loss exponent value of 3.5 and, in any direct or relay link, each subcarrier suffers from independent Rayleigh fading. For the convenience of comparison, we normalized the link gain with respect to the worst-case gain corresponding to the longest link distance. We assume that
Ri = R = 128 ∀ i and each MS user is given 32 subcarriers so that N = 32 × 4 = 128.
−3000 −200 −100 0 100 200 300 400 500 600 100 200 300 400 500 600
Figure 3.3: The probability density function of the user locations; r0 = 150 m.
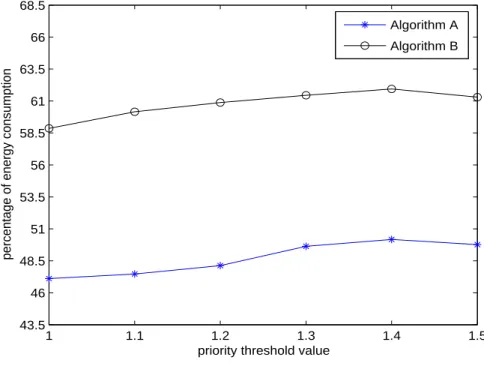
Define the energy reduction ratio as the ratio between the total energy required to transmit a fixed amount of bits with a cooperative relay and that without a relay. In Fig. 3.4 we examine the influence of the priority threshold γ on the energy reduction ratio performance of our algorithms when the designed BER is (10−3). As expected, Algorithm
B consistently outperforms Algorithm A for all thresholds. The reason is obvious: in Algorithm B, a source node is allowed to have multiple cooperative relay nodes, each is responsible for relaying data carried by certain subcarriers, and one can select the best link for every subcarrier. On the other hand, for Algorithm A, a source node can have at most one relay node which might have some good link quality in some subcarriers but not all of them. Hence Algorithm B enjoys a substantial performance gain at the cost of marginal complexity increase. For both algorithms, the optimal threshold γopt is about
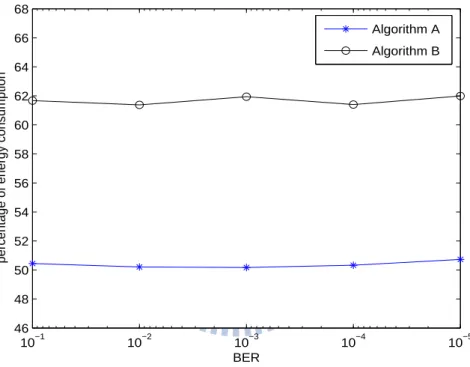
1.4. Hence we use this value for subsequent simulations. The average energy reduction ratio performance of the two proposed algorithms is shown in Fig. 3.5. Similar to the previous figure, Algorithm B yields much more energy reduction than Algorithm A does
1 1.1 1.2 1.3 1.4 1.5 43.5 46 48.5 51 53.5 56 58.5 61 63.5 66 68.5
priority threshold value
percentage of energy consumption
Algorithm A Algorithm B
Figure 3.4: Energy reduction ratio performance as a function of the priority threshold
γ with target BER = 10−3.
for all BER specification within the range [10−5, 10−1]. Furthermore, we find that the
10−5 10−4 10−3 10−2 10−1 46 48 50 52 54 56 58 60 62 64 66 68 BER
percentage of energy consumption
Algorithm A Algorithm B
Figure 3.5: Energy reduction ratio performance of the proposed cooperative transmission schemes.
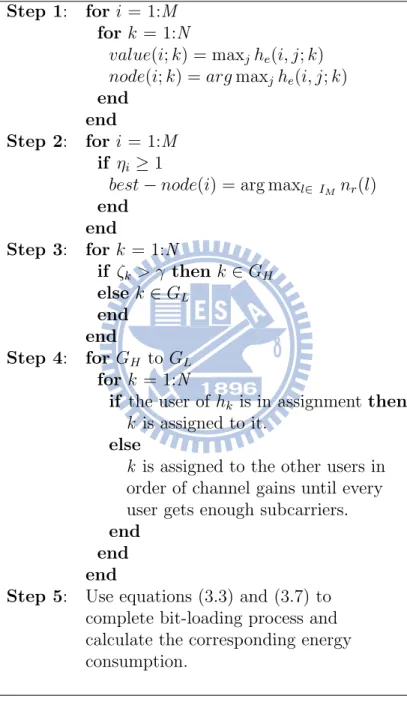
Table 3.1: Power Minimization Algorithm A (PMA). Step 1: for i = 1:M
for k = 1:N
value(i; k) = maxjhe(i, j; k)
node(i; k) = arg maxjhe(i, j; k)
end end
Step 2: for i = 1:M if ηi ≥ 1
best − node(i) = arg maxl∈ IM nr(l)
end end Step 3: for k = 1:N if ζk > γ then k ∈ GH else k ∈ GL end end Step 4: for GH to GL for k = 1:N
if the user of hk is in assignment then
k is assigned to it.
else
k is assigned to the other users in
order of channel gains until every user gets enough subcarriers. end
end end
Step 5: Use equations (3.3) and (3.7) to complete bit-loading process and calculate the corresponding energy consumption.
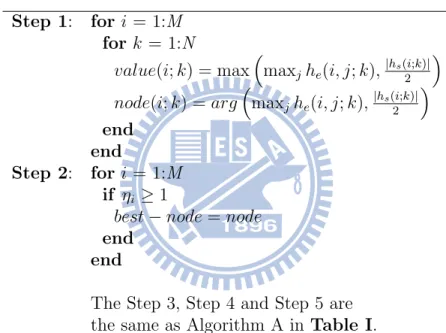
Table 3.2: Power Minimization Algorithm B (PMB). Step 1: for i = 1:M
for k = 1:N
value(i; k) = max³maxjhe(i, j; k),|hs(i;k)|2
´
node(i; k) = arg
³
maxjhe(i, j; k),|hs(i;k)|2
´ end
end
Step 2: for i = 1:M if ηi ≥ 1
best − node = node
end end
The Step 3, Step 4 and Step 5 are the same as Algorithm A in Table I.
Chapter 4
Power, Minimum Rate and QoS
Constrained Sum Rate and Fairness
Index Maximizing Resource
Allocation Schemes
In this chapter, we present resource (power, subcarriers and relays) allocation schemes that maximizes a fairness index and the sum rate with minimum rate and total power constraints for multiple-relay networks. By including cooperative nodes as part of the radio resources and taking into account the fairness issue, we propose two suboptimal algorithms that assign power, subcarriers and cooperative relay stations to a group of MS’s to meet their QoS and minimum rate requirements. It was shown that the sum rate of a multiuser OFDM system is maximized when each subcarrier is as-signed to the one which has the best channel condition. The total transmit power is then distributed over the subcarriers via a water-filling algorithm.
4.1
System Description and Basic Assumptions
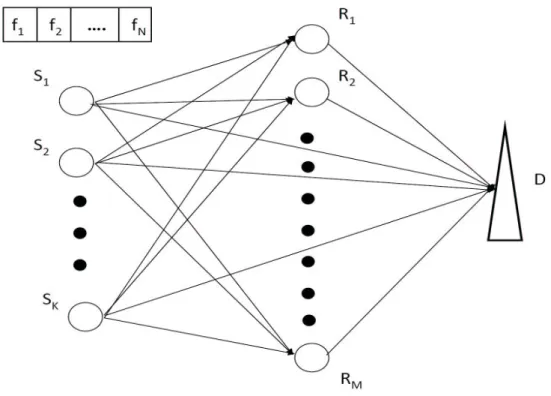
We consider an N-subcarrier OFDMA-based cooperative communication network as that depicted in Fig. 4.1 in which there are M fixed relay nodes, K MS’ randomly dis-tributed within a cell centered at a BS. Assume that uplink channel state information
Figure 4.1: A cooperative communication network with multiple source and relay nodes and a single destination node.
is perfectly known to the BS which also knows the minimum rate and QoS (bit error rate) requirements of each source MS. The BS, acts as a central control device, will carry out all resource allocation operations, including collecting link information, ap-propriating resources, and informing MS’ about their assigned resources. Similar to the conventional relay-based cooperative communication systems, we assume a two-phase (time-slot) transmission scheme with perfect timing synchronization among all network users. Each subcarrier suffers from slow Rayleigh fading so that there is no change of the channel state during a two-phase period. A data stream from a source user must be carried by the same subcarrier no matter it is transmitted by a source node or a relay node.
The transmission pattern is half-duplex such that an MS transmits while the relay and the BS listen (receive) in the first time slot. In the second phase, the relay stations transmit to the BS while the source MS’ send new data packets via direct links without
relaying. This transmission protocol was discussed in [8] and was shown to be more throughput-efficient than the conventional protocol with which a source MS remains idle in the second phase. Both the decode-and-forward (DF) and amplify-and forward cooperative relay scheme are considered and the maximum-ratio-combining detector is employed by the destination (BS) node, assuming perfect decoding at the relays.
4.2
Definitions, Signal Model and Relay Selection
Let us denote by hSD(n, k) the fading coefficient (gain) for the channel (link)
be-tween the kth source MS and the BS on the subcarrier n, by hRD(n, m), the fading
coefficient for the channel between the mth relay and the BS on the subcarrier n, and by hSRm(n, k), the fading gain for the channel between MS k and relay m on subcarrier
n. The corresponding transmit powers and received signals are denoted by PS(n, k),
PR(n, m), PSRm(n, k) and ySD(n, k), yRD(n, k), ySRm(n, k), respectively. During any
given phase we have for the source-to-destination (SD) link
ySD(n, k) = hSD(n, k)xk+ n(n, k) (4.1)
where xk represents the data sent by the kth MS and n(n, k) is the additive Gaussian
noise for the corresponding link. The associated achievable rate in bits/sec/Hz is given by RSD(n, k) = log2 · 1 + PS(n, k)|hSD(n, k)| 2 Γσ2 ¸ (4.2) where Γ ' − ln(5∗BER)/1.5 is the signal-to-noise ratio (SNR) gap related to the de-signed BER [9]. The inclusion of Γ in (4.2) (and other related rate-power equations appear in subsequent discourse) has implicitly imposed the user’s QoS requirement. Rearranging (4.2) yields PS(n, k) = ¡ 2RSD(n,k)− 1¢ Γσ 2 |hSD(n, k)|2 . (4.3)
Since we allow a source (MS) node to be active for both phases, a fair comparison on the achievable rate should be measured in a per time slot basis, or with respect to
the total consumed energy. For convenience, we shall normalize a time slot to one so that henceforth the consumed energy is equivalent to the consumed power. Because the channel states are assumed to remain the same during any two time-slot period, the power allocated to the direct link on each time slot should be the same. The power (consumed energy) for two OFDM symbols can thus be expressed as
PD(n, k) = 2
¡
2R(n,k)/2− 1¢ Γσ2
|hSD(n, k)|2
(4.4) where PD(n, k) is the power needed for the direct link, and R(n, k) is the rate achievable
by the system for a duration of two symbol intervals. Similarly, the signal carried by the nth subcarrier and received by the mth relay for the kth MS is given by
ySRm(n, k) = hSRm(n, k)xk+ n(n, k). (4.5)
In the first phase, the kth MS sends xk to the mth relay with a achievable rate of
RSRm(n, k) = log2 · 1 + PSRm(n, k)|hSRm(n, k)|2 Γσ2 ¸ (4.6) or equivalently, this source-to-relay (SR) link rate can only be achieved if the source power is greater than or equal to
PSRm(n, k) =
¡
2RSRm(n,k)− 1¢ Γσ2
|hSRm(n, k)|2
. (4.7)
Relay nodes transmit the data packet to destination in the second phase. The destination node receives two scaled packets containing the same data stream and combines them by the maximum-ratio-combining (MRC) scheme. The achievable MRC rate of the kth user on subcarrier n with the help of perfectly decoding relay m is
RRm(n, k) = log2 · 1 + PSRm(n, k)|hSD(n, k)|2+ PR(n, m)|hRD(n, m)|2 Γσ2 ¸ (4.8) The corresponding minimum required relay power is thus given by
PR(n, m) =
(2RRm(n,k)− 1)Γσ2− P
SRm(n, k)|hSD(n, k)|2
The total power PRm(n, k) def
= PSRm(n, k) + PR(n, m) for the composite
direct-plus-relay m link is PRm(n, k) = ¡ 2RRm(n,k)− 1¢Γσ2 · 1 |hSRm(n, k)|2 + 1 |hRD(n, m)|2 − |hSD(n, k)|2 |hSRm(n, k)|2|hRD(n, m)|2 ¸ (4.10) Define the link power gains, gD(n, k), gSR(n, k), gRD(n, k), and gRm(n, k), for the direct,
component and the composite links by
gD(n, k) = |hSD(n, k)|2 gSRm(n, k) = |hSRm(n, k)| 2 gRmD(n, k) = |hRD(n, k)| 2 (4.11) and gRm(n, k) = gSRm(n, k)gRmD(n, k) gRmD(n, k) + gSRm(n, k) − gD(n, k) (4.12) and the corresponding link gain-to-noise ratios (GNRs) by
αD(n, k) = gD(n, k) Γσ2 , αSRm(n, k) = gSRm(n, k) Γσ2 αRmD(n, k) = gRmD(n, k) Γσ2 , αRm(n, k) = gRm(n, k) Γσ2 (4.13)
for all n and k. Using the above notations, we can express the achievable rate for the relayed link as
R(n, k) = min {RSRm(n, k), RRm(n, k)} (4.14)
The optimal power allocation is such that RSRm(n, k) = RRm(n, k), which implies the
power ratio PR(n, m) PSRm(n, k) = gSRm(n, k) − gD(n, k) gRmD(n, k) (4.15) For the conventional DF scheme, cooperative relay is beneficial if it offers a higher achievable rate with the same power or, equivalently, the composite link should require
less power to obtain the same achievable rate. (4.2), (4.6) and (4.8) imply that this happens iff
gRmD(n, k) > gD(n, k)
max
m gSRm(n, k) > gD(n, k) (4.16)
The above conditions are necessary but not sufficient for the DF scheme under consid-eration, which gives another necessary condition
gRm(n, k) > gD(n, k) (4.17)
or, if multiple relay nodes are available max
m gRm(n, k) def
= gR(n, k) > gD(n, k) (4.18)
i.e., at least one of the candidate composite link should have a link gain greater than that of the direct (SD) link. Assuming the optimal power ratio (4.15), we can show that a necessary and sufficient condition for a single-relay system is
gSRm− gD gSRm+ gRmD− gD gRmD − gD g2 D = gRm− gD g2 D > γ (4.19)
where γ = P (n,k)4Γσ2 and the link gains’ dependence on the pair (n, k) is omitted for the
sake of brevity. For multiple-relay systems, (4.19) becomes max m gRm− gD g2 D def = max m Gm > γ (4.20)
It verifiable that the conditions (4.18) and (4.20) are equivalent if P (n, k)αD(n, k)/2 ¿ 1.
4.3
Problem Statement
Based on the above discussion, it is straightforward to show that the achievable sum rate of the system over a two-symbol interval for a subcarrier/power allocation is given
by R = K X k=1 ( X n∈SR ρnklog £ 1 + PRm(n,k)(n, k)αRm(n,k)(n, k) ¤ + X n∈SD 2ρnklog [1 + PD(n, k)αD(n, k)/2] ) (4.21) where SRand SD are the sets of relayed and un-relayed subcarriers, and m(n, k) denotes
the relay node used for the subcarrier (n, k). ρnk is the binary valued indicator function
which signifies if subcarrier n is allocated to MS k and is nonzero and equal to one only if the latter condition is valid. Following [10] we define the fairness index, F , as
F = ³PK k=1 Rk,minRk ´2 KPKk=1³ Rk Rk,min ´2 (4.22)
where Rk,min is the minimum required rate for MS k and Rk is the achievable rate
computed by (4.21) for a given subcarrier/power allocation. With the above definitions and derived relations, we formulate the resource allocation problem as the multi-criteria optimization problem maximize [R, F ]T (4.23) subject to X n∈SR ρn,klog [1 + PRm(n, k)αRm(n, k)] + X n∈SD 2ρn,k log [1 + PD(n, k)αD(n, k)/2] ≥ Rk,min, ∀ k (4.24) K X k=1 ρn,k = 1, ρn,k ∈ {0, 1} ∀ k, n (4.25) K X k=1 " X n∈SR PRm(n, k) + X n∈SD PD(n, k) # = PT PD(n, k) ≥ 0, PRm(n, k) ≥ 0, ∀ k, n (4.26)
Constraint (4.24) guarantees that all the minimum rate requirements Rk,min are met.
Constraint (4.25) implies that a subcarrier serves only one user such that there is no inter-subcarrier interference. The total transmit power of the BS and relay nodes is
limited by the constraint (4.26). The object of assigning subcarriers and relays to all MS users with a proper power distribution to maximize the sum rate and fairness index is a mixed integer programming problem. Instead of trying to find a polynomial-time optimal solution (which is very difficult if not impossible), we propose low-complexity suboptimal algorithms that offer near-optimal performance for the problem in hand.
4.4
Fairness Index Analysis
We analysis the variance of the fairness index when a new subcarrier is assigned. When the user j gets the new subcarrier, its rate can be represented as R0j = Rj+ ∆Rj,
and the other users’ rate remain the same. In other words, it means ∆Rk = 0, if k 6= j
∆Rk 6= 0, if k = j (4.27)
The procedure is showed below:
F0 = ³PK k=1 Rk,minRk ´2 + 2PKk=1 ³ Rk Rk,min ´ ³ ∆Rj Rj,min ´ + ³ ∆Rj Rj,min ´2 KPKk=1 ³ Rk Rk,min ´2 + 2K ³ Rj Rj,min ´ ³ ∆Rj Rj,min ´ + ³ ∆Rj Rj,min ´2 ≈ ³PK k=1Rk,minRk ´2 KPKk=1 ³ Rk Rk,min ´2 Ã 1 + 2 ∆Rj Rj,min PK k=1 Rk,minRk ! 1 − 2Rj∆Rj R2 j,min PK k=1 ³ Rk Rk,min ´2 ≈ F 1 + 2 ∆RjRj,min R2 j,min PK k=1 Rk,minRk − 2 Rj∆Rj R2 j,min PK k=1 ³ Rk Rk,min ´2 ≈ F 1 + 2υ∆RjRj,min R2 j,min − 2 Rj∆Rj R2 j,min PK k=1 ³ Rk Rk,min ´2 (4.28)
where υ = PK k=1 µ Rk Rk,min ¶2 PK k=1 µ Rk Rk,min
¶ . We rearrange (4.28) and can get the variance of the fairness
index (∆F ) ∆F = F × 2 R2 j,min PK k=1 ³ Rk Rk,min ´2 × [(υRj,min− Rj)∆Rj] = C × [(υRj,min− Rj)∆Rj] (4.29)
We can find that maximize the fairness index is equivalent to maximize the variance of the fairness index, and ∆F is related to ∆Rj, Rj,min and Rj. Maximizing ∆Rj means
that we have to choose the user with the highest channel gain. For the given partial subcarrier assignment, υ is a constant for all users and hence maximizing (υRj,min− Rj)
is equivalent to choosing the largest Rj,min and the smallest Rj. It represents that we
have to choose the user j with lowest surplus rate. Our proposed subcarrier assignment algorithms will base on the derived result.
4.5
Resource Allocation Schemes with Fairness
Con-sideration
Two suboptimal algorithms to solve the above resource allocation problem (18)-(21) are presented in this section. For convenience, we refer to these two algorithms as Algorithms A and B, respectively. Algorithm A consists of four steps while the other algorithm (Algorithm B) has three steps only. Steps 2 and 3 for both algorithms are the same. The difference between the two algorithms is the first step. The last step of Algorithm A is to fine-tune the relay allocation. Each source node can have multiple cooperative relay nodes which are determined in a per-subcarrier basis. However, each subcarrier is limited to have at most one relay node but the local optimal relay node (for a particular subcarrier) is always selected for cooperative DF transmission.
One first decides for each subcarrier and each user whether relaying is needed. If one decides that subcarrier n of MS k needs relaying one then find the corresponding optimal
relay node m. (4.20) indicates that this two decisions can and should be jointly made. It, however, also implies that to make such decisions we need to know the allocated power which unfortunately is still unavailable at this stage. Algorithm A solves this dilemma by using the small signal approximation (4.18), i.e., the selection or non-selection of relay node m for aiding MS n’s kth subcarrier is determined by
m = arg max
` gR`(n, k), if gRm(n, k) > gD(n, k)
m = 0, otherwise (4.30)
m = 0 means no relaying is needed for (n, k) and only the direct link is used. Algorithm
B, on the other hand, invokes the tentative equal power assumption P (n, k) = PT/N so
that the relay selection rule is given by
m = arg max
` G`(n, k), if Gm(n, k) >
PT
4NΓσ2
m = 0, otherwise (4.31)
After finishing the paring ((n, k), m), for all two-tuples (n, k), one computes the corre-sponding effective link (power) gain (ELG) gELG(n, k) if m > 0. To begin with, both
algorithms have to calculate gD(n, k) and gRm(n, k) via (4.11) and (4.12). For Algorithm
A, we compute gELG(n, k) for each (n, k) by
gELG(n, k) = max h gD(n, k), max m gRm(n, k) i (4.32) which compares the link gains of the direct link and all composite links and selects the largest one as the ELG. If the relay link is chosen, the corresponding m is also recorded and the partition {SD, SR} of the subcarriers becomes
SD = {n|gRm(n, k) ≤ gD(n, k) for all m and some k}
SR = {n|gRm(n, k) > gD(n, k) for some m and k} (4.33)
For Algorithm B, the relay selection rule of (4.31) implies that gELG(n, k) is to be
computed by
gELG(n, k) = arg max
· 2 log µ 1 + PTgD(n, k) 2NΓσ2 ¶ , max log µ 1 + PTgRm(n, k) NΓσ2 ¶¸ (4.34)
i.e., we calculate the rate associated with each subcarrier for both the direct link and all candidate composite links by assuming an equal power assignment, PT/N, among
all subcarriers and all links. The ELG is the link gain of the link with the largest rate (among the direct and all candidate composite links). The optimal relay node,
mopt(n, k), for each (n, k) is given by
mopt(n, k) = arg max m log · 1 + PTgRm(n, k) NΓσ2 ¸ = arg max m Gm(n, k) (4.35)
is recorded. The corresponding subcarriers partition {SD, SR} is
SD = {n|Gm(n, k) ≤ γ for all m and some k}
SR = {n|Gm(n, k) > γ for some m and k} (4.36)
We then proceed to assign subcarriers based on gELG(n, k). The assignment order
for subcarriers is determined by (in ascending order)
n0 = arg max
n (maxk gELG(n, k)) (4.37)
We use a constraint-relaxation approach that begins with a unstrained (fair) initial virtual allocation which gives all users the opportunity to access all subcarriers. The subcarrier allocation process consists of a series of deletion decisions that gradually reinstall the original constraints. Define the Rate Differential Index (RDI) ∆ as:
∆(n0, k) = Rn0,k,1− Rn0,k,2
Rn0,k,2− Rk,min (4.38)
where Rn0,k,1 represents the virtual rate associated with the case that subcarrier n0 is
indeed assigned to MS k while Rn0,k,2 is the virtual rate for the case when subcarrier
n0 is not assigned to MS k. The numerator of (4.38) represents the loss incurs when
the latter scenario occurs and can be used as an relevant index for maximizing the sum rate. The denominator of (4.38) is needed to maintain the fairness among all MSs as the MS whose surplus rate is low has a larger probability to secure services from more
subcarriers. Our subcarrier allocation strategy computes the virtual rates Rn0,k,1 and
Rn0,k,2 at each stage and assign subcarrier n0 to the MS with the maximum ∆(n0, k), i.e.,
arg max
k (∆(n
0, k)) (4.39)
The subcarriers are allocated one-by-one until all are assigned.
Given a subcarrier allocation, we conduct a water-filling procedure to compute the corresponding rate for each user. In case there are users whose rate requirements are not met, we proceed to the rate-balance step. Since at this stage most users have been given enough subcarriers that provide more than their rate requirements, we select the user with the highest surplus rate and reassign its least gain subcarrier to the needed user. This process continues until all the users’ rate constraints are satisfied. Algorithm A goes one step further. We observe that, for each (n, k, m), there is an Ro(n, k, m),
obtained by equating the right hand sides of (4.4) and (4.10), beyond which it is more beneficial not to use the relay link. Since the rate carried by each assigned subcarrier is known now, we check each relayed subcarrier by comparing the required direct and composite link powers for the same allocated rate and select the link whose ELG is given by gELG(n, k) = max · 2 (2R(n,k)/2+ 1)gR(n, k), gD(n, k) ¸ (4.40) where
gR(n, k) = gRm(n, k)|m=mopt, mopt = arg max
m gRm(n, k) (4.41)
After examining all relayed links and making necessary link switches, we compute the corresponding sum rate and fairness index. The resulting algorithms are summarized in Tables 4.1 and 4.2, respectively.
4.6
Numerical Results and Discussions
Numerical performance of the proposed algorithms is presented in this section. We consider a network with several MS nodes that are random distributed within a
120-degree section of the 600-meter radius circle centered at the BS. The relay stations are placed on a circle with a 200-meter radius with a equal angular spacing. The probability density function (pdf) of the MS locations is given by [11]
P = r 4 0 r5 exp · −5 4 ³r0 r ´4¸ . (4.42)
where r > 0 is the radius. The pdf with r0 = 150 m is plotted in Fig. 3.2 and Fig.
3.3. Each transmitted signal experiences attenuation with a path loss exponent value of 3.5 and, in any direct or relay link, each subcarrier suffers from independent Rayleigh fading. For the convenience of comparison, we normalized the link gain with respect to the worst-case gain corresponding to the longest link distance. We set σ2 = 1. 4 × 10⁵
simulation runs were carried out to estimate the performance. We compare the sum rate and fairness performance of our algorithms with that of the modified Awad-Shen (MAS) algorithm which is a modified version of the original AS algorithm given in [12]. Because the original AS algorithm considers amplify-and-forward cooperative relay and allow each source to use at most one relay node, we modify it so that the comparison with ours is as fair as possible. The MAS algorithm is listed in Table 4.3.
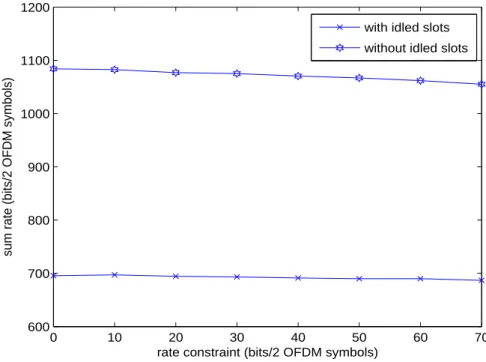
In Figs. 4.2–4.3, we compare the performance of Algorithm B when a source is allowed or forbidden to use the corresponding SD link in the second phase, i.e., whether a SD link’s second phase is idled or not. As expected, if the sources can send extra data packets via direct links (without relaying) in the second phase, the resulting sum rate performance is much improved. However, there exists minor loss of fairness if packets transmitted in the second phase can use the direct links only. In Fig. 4.4 and Fig. 4.5 we compare the performance of our algorithms with that of the algorithm which is designed to achieve the optimal sum rate without fairness consideration and the MAS algorithm. We consider the situation when the system has 2 MS users and 3 relay nodes with 8 subcarriers, 80 W total transmit power and a required BER of 10−3. We find
that our algorithms achieve about 94% of the optimal sum rate but the corresponding fairness indices are significant better than that offered by the optimal sum rate algorithm.
0 10 20 30 40 50 60 70 600 700 800 900 1000 1100 1200
rate constraint (bits/2 OFDM symbols)
sum rate (bits/2 OFDM symbols)
with idled slots without idled slots
Figure 4.2: The effect of SD link’s idled slots on Algorithm B’s sum rate performance; 4 MS users, 3 relay nodes, N = 128, PT = 128, BER = 0.001.
0 10 20 30 40 50 60 70 0.9 0.91 0.92 0.93 0.94 0.95 0.96 0.97 0.98 0.99 1
rate constraint (bits/2 OFDM symbols)
fairness index
with idled slots without idled slots
Figure 4.3: The effect of SD link’s idled slots on Algorithm B’s fairness performance; 4 MS users, 3 relay nodes, N = 128, PT = 128, BER = 0.001.
0 5 10 15 20 50 60 70 80 90 100 110 120 130
rate constraint (bits/2 OFDM symbols)
sum rate (bits/2 OFDM symbols)
optimal Algorithm A Algorithm B MAS Algorithm
Figure 4.4: Sum rate performance of the proposed and MAS algorithms; 2 MS users, 3 relay nodes, N = 8, PT = 80, BER = 0.001.
0 5 10 15 20 0.7 0.75 0.8 0.85 0.9 0.95 1
rate constraint (bits/2 OFDM symbols)
fairness index
optimal Algorithm A Algorithm B MAS Algorithm
Figure 4.5: Fairness performance of the proposed and MAS algorithms; 2 MS users, 3 relay nodes, N = 8, PT = 80, BER = 0.001.
0 5 10 15 20 90 91 92 93 94 95 96 97 98
rate constraint (bits/2 OFDM symbols) sum rate percentage % (normalize with optimal)
Algorithm A Algorithm B MAS Algorithm
Figure 4.6: Relative sum rate performance of the proposed and MAS algorithms; 2 MS users, 3 relay nodes, N = 8, PT = 80, BER = 0.001.
0 5 10 15 20 75 80 85 90 95 100
rate constraint (bits/2 OFDM symbols) fairness index percentage % (normalize with Algorithm B)
optimal Algorithm A MAS Algorithm
Figure 4.7: Relative fairness performance of the proposed and MAS algorithms; 2 MS users, 3 relay nodes, N = 8, PT = 80, BER = 0.001.