行政院國家科學委員會專題研究計畫 成果報告
以改良式基因演算法求解最小化的自動導引車系統週期時
間
研究成果報告(精簡版)
計 畫 類 別 : 個別型 計 畫 編 號 : NSC 97-2221-E-009-122- 執 行 期 間 : 97 年 08 月 01 日至 98 年 07 月 31 日 執 行 單 位 : 國立交通大學運輸科技與管理學系(所) 計 畫 主 持 人 : 黃寬丞 計畫參與人員: 碩士班研究生-兼任助理人員:謝智翔 碩士班研究生-兼任助理人員:鄭兆哲 碩士班研究生-兼任助理人員:吳景堯 碩士班研究生-兼任助理人員:梁郁英 碩士班研究生-兼任助理人員:許丞博 大專生-兼任助理人員:陳筱薇 大專生-兼任助理人員:林家誼 大專生-兼任助理人員:劉婉葶 報 告 附 件 : 出席國際會議研究心得報告及發表論文 處 理 方 式 : 本計畫可公開查詢中 華 民 國 98 年 11 月 02 日
行政院國家科學委員會補助專題研究計畫
■ 成 果 報 告
□期中進度報告
以改良式基因演算法求解最小化的自動導引車系統週期時間
計畫類別:■個別型計畫 □整合型計畫
計畫編號:NSC 97-2221-E-009-122-
執行期間:97 年 8 月 1 日至 98 年 7 月 31 日
計畫主持人:黃寬丞
共同主持人:
計畫參與人員:謝智翔、鄭兆哲、吳景堯、梁郁英、許丞博、陳筱薇、
林家誼、劉婉葶
成果報告類型(依經費核定清單規定繳交):■精簡報告 □完整報告
本成果報告包括以下應繳交之附件:
□赴國外出差或研習心得報告一份
□赴大陸地區出差或研習心得報告一份
■出席國際學術會議心得報告及發表之論文各一份
□國際合作研究計畫國外研究報告書一份
處理方式:除產學合作研究計畫、提升產業技術及人才培育研究計畫、
列管計畫及下列情形者外,得立即公開查詢
□涉及專利或其他智慧財產權,□一年□二年後可公開查詢
執行單位:
中 華 民 國 98 年 10 月 31 日
中文摘要
自 動 導 引 車(Automated Guided Vehicle, AGV) 是 當 今 彈 性 製 造 系 統 (Flexible Manufacturing System, FMS)和自動化倉儲系統中很重要的作業設施。在生產的流程中, 有效加工時間佔的比例通常不大,相對花費在運送、等待的時間則佔有相當大的比例。 因此,本研究針對生產系統中最常見的單迴圈(single loop)AGV 系統,在 AGV 車輛數為 1 台,加工機台為 2 台的條件下,以 ES (early start)為派遣法則(dispatching policy),發展 出一以最小化生產週期,也就是最大化其有效產出(throughput),的數學模式,並以基因 演算法(Genetic Algorithm, GA)來求解最小工件集合(Minimal Job Set, MJS)內之工件序列 (job sequence)。此外,並展出一混合整數規劃 (Mixed Integer Programming, MIP),藉以 找出問題的最佳解及目標值下限,來驗證所提出的基因演算法是否有效。數值測試的結
果發現求解品質誤差範圍均在1%內,而求解時間則在 1 分鐘內。
關鍵詞:自動導引車、工件序列、基因演算法
Abstract
AGV (Automated Guided Vehicle) plays an important role for today’s manufacturing and warehousing systems. In a manufacturing process, the time actually spent on the machines is sometimes not very long; on the other hand, a significant portion of the whole process time is consumed for transporting and waiting. Therefore, this study considers a common single-loop AGV system and develops a mathematical model aiming to minimize the production cycle time (i.e., to maximize the production throughput), given the predetermined ES (Early Start) AGV dispatching policy. This study designs a genetic algorithm to determine the sequence for the jobs in an MJS (Minimal Job Set) so as to reduce the AGV cycle time. This study also develops a mixed integer programming (MIP) model, which can find the optimal solution of small-size problems. In addition, its linear program (LP) relaxation is found to be a very tight lower bound. In order to verify the effectiveness of the developed solution algorithm, a series of test problems are designed, and the result show that the solution generated by the heuristic algorithm is very close to the optimal solution, normally within 1% in terms of the objective function value, and the computation time is less than one minute.
Keywords: Automated Guided Vehicle, Job Sequence, Genetic Algorithm
一、前言
在市場競爭愈形激烈的環境裡,企業皆致力於成本的降低、生產力的提高的方法; 而在諸多方法中,如何有效運用自動化生產設施便成為一門重要的課題。在自動化生產 系統上,是否能有效地把所需物料搬運至適當的地點存放或加工,對於系統之績效有很 大的影響。Han and McGinnis (1989)則指出工件完工所需的總時間,只有 5%花在製造 上,其它時間都浪費在工作的傳送或是存放於暫存區中。有鑒於此,如果能選擇一個適
當的工件搬運系統及適當的作業方式,將有助於降低在製品的存貨成本,並有效率地提 升企業的生產效率與整體競爭力。
二、研究目的
搬運系統的成效良好與否,與軌道設計(flow-patch design)、車輛數(fleet size)多寡、 車輛派送(vehicle dispatching)及工件排程(job scheduling)等因素皆有關。一般而言,有關 AGV 的研究,主要可分為兩種研究議題,設計議題(design issue)與作業議題(operational issue)。為了更有效地操作 AGV 系統的運作,Ganesharajah et. al (1998)更指出在設計 AGV 系統時一定考慮這些議題的相關性。而本研究主要目的即在針對生產系統中最常見的單 迴圈系統,利用基因演算法,快速地尋找較佳的工件序列(job sequence),以最小化產品 生產週期(cycle time)。
三、文獻回顧
Kise et al. (1991)指出,AGVS 中以 1 台 AGV,服務 2 台機台,且機台中無任何緩
衝,生產n 個工件,以 O(n3)的演算法可找出最佳的工件序列以最小化其完工時間。Agnetis
et al. (1996)以相同的生產條件但機台(包含輸入站及輸出站)具有轉換裝置(swapping devices),此裝置可使 AGV 在卸下待加工之工件後,可承載已加工完成的工件。在其研
究中,決策上要求將相同的工件併裝在一起,稱之為 Lot;此時 Lot 中的工件數量可稱
為Lot size。其研究發現當 Lot size 大於某一關鍵值時,此類排程的問題可於多項式時間
內求解之。Hall et al. (2001)以單一迴圈的軌道佈設中,考量 AGV1~4 台,機台 2~10 台,
探討常用派車策略有三種:分別為Early Start (ES)、Latest Start (LS)及 No Wait (NW),
其在數值測試中,派車策略採No wait,針對 MJS 大小為 n,n<=100 時,以一 GA 求解
工件序列來最小化工件的週期時間與拉氏鬆弛法所求得的解之間,誤差約在5%左右。
對於機台為具有一無限容量或無任何容量的緩衝裝置,可以演算法在合理時間內求
解之;然而,若機台為具有一有限容量的緩衝裝置,則其為一 NP-complete 問題
(Papadimitriou and Kanellakis, 1980)。限綜合上述,本研究的將研究問題定義為:在單一
迴圈的流線型工廠,機台數量 2 台,且機台具有一容量限製的緩衝裝置(輸入緩衝及輸 出緩衝)。而以 AGV 服務生產系統的數量假設為 1 台,且其派車的方式為 ES。在假設 的加工條件下,本研究欲藉由基因演算法,以最小化工件完工時間為目標,進而找出較 佳的工件序列及對應的週期時間。本研究引用Hall et al. (2001)之符號及模式如下。 • v:系統中的 AGV 數量。 • m:系統中的機台數量。 • M1, …, Mm:單迴圈式AGVS 內的機台編號。 • li:第i 台機台與第 i-1 台機台間的距離。(另外,l1、lm+1、lm+2則分別為輸入 站與第1 台機台間、第 m 台機台與輸出站間、輸出站與輸入站間的距離,而迴 圈的總長度l 則為所有 li的加總。) • r1, …, rk:最小工件集合中,各工件比例,其總和為n。 • pi,q:工件i 在機台 Mq 的加工時間。(若為二個機台之系統,則直接以 a 和 b 分別代表第一和第二機台之加工時間。) • γ:AGV 在系統中繞行一個迴圈的總時間(不含等待時間)。 決策變數 • σ:代表一個工件序列,而 σ(j)為其中第 j 個工件。 • Tσ(i)σ(i+1):在入口揀起工件序列σ 中的第 i 工件與第 i+1 個工件的間隔時間
• Tσ:為工件序列σ 所對應的最小工件集合週期時間,在穩定的循環狀態時,其 等於Tσ(1)σ(2)+Tσ(2)σ(3)+· · ·+Tσ(n)σ(1)。 • Wqi:AGV 在機台 Mq 等待卸載工件 i 的時間。
{
}
∑
= − + − = n i i i i σ a w b T 1 () 1 2 ) 1 ( , , max σ σγ
(1) 其中, max{
0, σ max{
σ 1, σ(),γ
}
}
2 ) 1 ( ) ( 2 i i i i i b a w b w − + − − = (2) ) 1 ( ) 1 ( σ σ a a n+ = (3) n w w0 2 2 = (4) (1)為完成 MJS 所需的生產週期。(2)為 AGV 在 M2 等待卸載工件i 的時間,公式中 有一個遞迴的關係,即需得知前一工件在M2 的等待時間,才可得知下一工件在 M2 的 等待時間。(3)為工件在 M1 的加工時間,經過一週期後,第一個工件與第n+1 個工件的 加工時間仍相同。(4)為 AGV 於 M2 欲卸下工件 n+j 時的等待時間,與第 j 個工件的等 待時間相同。四、研究方法
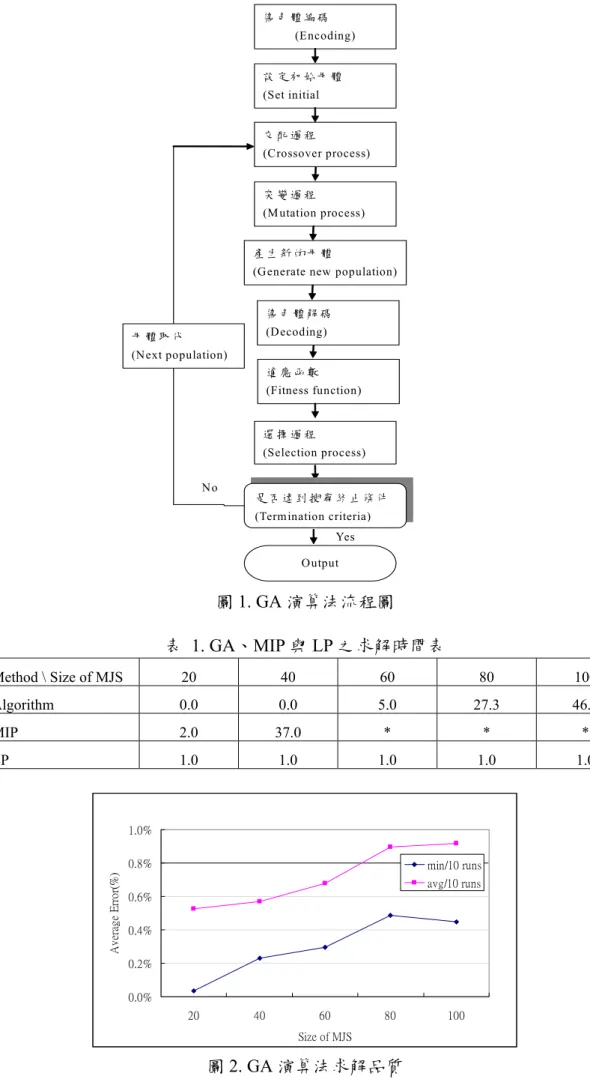
此本研究提出一混合整數規劃模式(Mixed integer programming, MIP),用於求解問題 的最佳解,之後再以基因演算法求解問題的近似解,比較演算法的求解品質與效率。所 使用的解題工具-Lingo8.0,用來驗證本研究演算法的求解品質是否良好,而程式的撰寫 則是使用Matlab7.0。 本研究係以基因演算法來求迅速搜尋的工件序列,並進而決定其工作週期。其中, 一個基因(gene) 代表一個工件,一條染色體代表一工件序列,而一條染色體則對應到一 個搜尋空間的解,也對應到一個目標值(AGV 週期時間)。本研究採用 Bean (1994)所 提出Random keys 的概念來代表各工作生產順序以進行編碼,另有關基因演算法的運算 流程則如圖一所示。
五、結果與討論
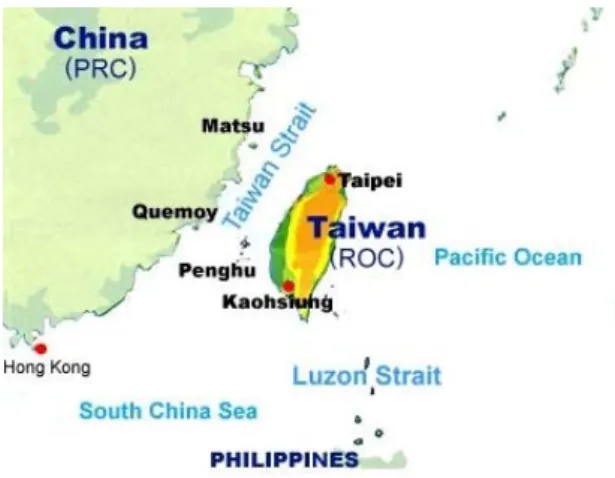
為進行相關的數值試驗,本研究所設計的測試問題,以排程的表示方法為:AGV1, lp2|k≧2,es| Ct,即 AGV1 台,加工機台 2 台,工件種類假設為 20 種;另外,n 設假介 於20~100。工件在各機台的加工時間為已知條件,藉由均勻分佈的方式隨機產生 20 組 工件的加工時間,分別介於30(min)~300(min)的數值。 有關運算時間,表一整理GA 演算法、MIP 及放鬆整數限制後的 LP 三者執行的結果。當n≦40 時,以 Lingo8.0 執行 MIP 模式、LP 及 GA,其求解時間均在 2 分鐘之內;
而當n>40 時,MIP 的求解時間在 24 小時內,無法求出結果,但 LP 仍可迅速求得結果,
而GA 則在 2 分鐘內。
有關誤差百分比,則就各測試問題執行 10 次運算中,分別計算最小值及平均值,
再計算20 個測試問題之平均值,發現各個問題規模的平均誤差百分比在各種 MJS 大小
選 擇 過 程 (Selection process) 設 定 初 始 母 體 (Set initial 交 配 過 程 (Crossover process) 染 色 體 編 碼 (Encoding) 產 生 新 的 母 體
(Generate new population)
是 否 達 到 搜 尋 終 止 條 件 (Termination criteria) No Output 適 應 函 數 (Fitness function) Yes 突 變 過 程 (M utation process) 母 體 取 代 (Next population) 染 色 體 解 碼 (Decoding) 圖1. GA 演算法流程圖 表 1. GA、MIP 與 LP 之求解時間表 Method \ Size of MJS 20 40 60 80 100 Algorithm 0.0 0.0 5.0 27.3 46.7 MIP 2.0 37.0 * * * LP 1.0 1.0 1.0 1.0 1.0 0.0% 0.2% 0.4% 0.6% 0.8% 1.0% 20 40 60 80 100 Size of MJS A v er ag e E rr or (% ) min/10 runs avg/10 runs 圖2. GA 演算法求解品質
六、結論與建議
本研究針對生產系統中最常見的單迴圈 AGV 系統,在 AGV 車輛數為 1 台,加工 機台為2 台的條件下,以 ES 為派車法則,發展出一以最小化生產週期,也就是最大化 其有效產出為目標的數學模式。實務上,最小工件集合的數目均大於50,因此本模式以 基因演算法來求解問題規模大小為MJS 大達 100 時,找出其較佳(最佳)的工件序列。 透過本研究的探討與分析,未來可以本研究為基礎,針對具有 AGV 服務之流線型 工廠,做更深入的探討與研究,其後續研究發展的部分,分別敘述如下: (1) 在相同的加工限制下,可將問題延伸至多台 AGV 及多台機台。 (2) 將加工限制由 ES,改成 LS 或 NW,以比較不同的派工策略所造成的影響,如 AGV 的旅行時間、機台的利用率等。 最後,本研究之主要成果亦為本系碩士班畢業生游展宗(民 97)之畢業論文,同時亦 已於國際會議The 4th Sino-Japanese Optimization Meeting (August 27 - 31, 2008, Tainan, Taiwan),以 Minimizing the Cycle Time of an AGV-served Flowshop Based on the Job Sequence Generated by a Generic Algorithm 為題發表。參考文獻
Agnetis, A. ,Pacciarelli, D. and Rossi, F., “Lot scheduling in a two-machine cell with swapping devices”, IIE Transactions 28, 911 – 917, 1996.
Bean, J.C.,“Genetics and random keys for sequencing and optimization,” ORSA Journal on Computing 6, 154-160, 1994.
Ganesharajah, T., Hall, N.G. and Sriskandarajah, C., “Design and operational issues in AGV-served manufacturing systems”, Annals of Operations Research 76, 109 – 154, 1998.
Hall, N.G., Sriskandarajah, C. and Ganesharajah, T., “Operational decisions in AGV-served flowshop loops: Scheduling”. Annals of Operations Research 107, 161–188, 2001.
Han, M.-H. and McGinnis, L.F, “Control of material handling transporter in automated manufacturing”, IIE Transactions 21, 184–190,1989.
Kise, H., Shioyama, T. and Ibaraki, T., “Automated two-machine flowshop scheduling: A solvable case”, IIE Transactions 23, 10 –16, 1991.
Papadimitriou, C. H. and Kanellakis, P. C., "Flowshop scheduling with limited temporary storage," Journal of Association for Computing Machinery 27, 553-549, 1980.
游展宗,民 97 年,「以基因演算法產生工件序列來最小化自動導引車(AGV)之週期時 間」,國立交通大學,碩士論文。
【計畫成果自評】
本研究之內容與原計畫相符,已達成預期目標。本研究案中個人所指導碩士班學生游展 宗,依據本研究案成果所完成的碩士論文,已於國際會議發表。此外,研究計畫經費補 助出國會議所發表之論文,根據會議所得修正意見,改寫後已發表於期刊,資料如下 「HUANG, K.* and CHEN, Y. (2009), Locating Manufacturer Distribution Centers by a Modified Fixed-Charge Model: A Case Study of Kinmen Kaoliang Liquor Inc.,附件一:出席國際會議研究心得報告
計畫編號:97-2221-E-009-122-
計畫名稱:以改良式基因演算法求解最小化的自動導引車系統週期時間
會議名稱:The 3rd World Conference on Production and Operations Management (POM Tokyo 2008) 會議概況:本世界性會議是由生產與作業管理(Production and Operations Management, POM)領域 的 三 個 區 域 國 際 組 織 合 辦 , 分 別 是 北 美 的 POMS (Production and Operations Management Society) 、 歐 洲 的 EurOMA (European Operations Management Association) 和 日 本 的 JOMSA (Japanese Operations Management and Strategy Association)。過去分別於西班牙的 Seville (2000)和 墨西哥的 Cancun (2004)舉辦過第一、二屆會議,本次則是在日本的 Tokyo 舉辦第三次會議,是 POM 領域重要的國際會議之一。本會議歷次舉辦均吸引相當多各國研究人員參與,是一個國際 參與(International Participation)極高的會議。本次有 44 國 414 位人員參與,亞洲的與會人員約有 150 位(包含主辦國日本 65 位)。 目的:參與會議的主要目的在希望藉由論文之發表,和與會者討論,能夠獲得回饋意見及改進 方向,使得本篇論文能更加完善,以利後續研究工作之延伸。同時,另外也希望經由與各國學 者的交流和討論,獲取不同運輸領域的新知識。此外,本次口頭發表之論文,除將收錄在會議 論文集外,也獲得評審的建議,於會後投稿國際期刊。目前有部份國際會議都會擇優將論文推 薦至相關國際期刊,以Special Issue的方式在審查後刊出,但前提都必須親自前往做口頭報告。 過程:於2008年8月4日撘乘中華航空公司CI 101班機由台灣桃園機場抵達日本東京成田機場,8 月5日赴學習院大學(Gakushuin University)會場參加研討會並口頭發表論文(包含會議Section Chair主持), 8月6日在參加研討會後,撘乘中華航空公司CI018班機由日本東京成田機場返回 台灣桃園機場。
會議心得與建議:個人所發表之論文 (Location Analysis of Distribution Centers: A Case Study of Kinmen Kaoliang Liquor Inc.)是以本國金酒公司為個案的物流中心區位分析研究,同一 Section 另有泰國 學者執行 該國國家 計畫所進 行之「泰國橡膠工 業出口中 國之物流 中心規劃 案」 (Determination of Distribution Center Locations for Thai Rubber in China)。兩篇個案研究論文同場 進行發表與研討,有許多相似與相異的觀點可以加以比較,同場參與者的討論相當熱烈,收穫 也相當豐碩。有關基於參與此次會議之心得所產生的建議包含以下幾項:
一、 由於各個管理領域的研究課題與研究工具相異,主辦單位對於會議各個主題與分節 (tracks and sections)的安排也必須煞費苦心。本次的會議,特別將數學模式(mathematical
modeling)相關的論文均安排於特定的 Sessions,並在 Conference Program 上特別以 m-(代 表 mathematical modeling)註記,讓對定量研究較有興趣的學者可以輕易地掌握相關論文 的時間與地點,是一項很好的會議安排。
二、 本次會議主辦單位安排多個日本知名企業的參觀,包含 JFE Steel Corporation、Honda Motor Co. Ltd.、Mori Seiki Co. Ltd.、NTT Information Sharing Laboratory Group of NTT Corporation、Yokogawa Electric Corporation。此次,受於時間的限制,無法報名參加, 日後有參與其他國際會議也可將此行程納入考量。 三、 個人認為國內之研究與許多國際間之研究,在水準上應無極大的差距,但與會者的簡報 技巧及溝通能力較為不足,尤其是英文能力普遍較無法應付國際會議的場合。解決之 道,可考慮先在國內透過課程或者 Workshop 來培養相關的能力。此外,多多參予國際 會議仍是提升能力的必要途徑。 四、 目前有部份國際會議都會擇優將論文推薦至相關國際期刊,以 Special Issue 的方式在審 查後刊出,但前提都必須親自前往做口頭報告。建議有類似安排的國際會議能儘量予以 補助,對於學術論文的發表應該很有助益。 (口頭發表之論文全文如下。)
LOCATION ANALYSIS OF DISTRIBUTION CENTERS: A CASE STUDY OF
KINMEN KAOLIANG LIQUOR INC.
Kuancheng Huang a and Ying-Hsuann Chen b
a
Department of Transportation Technology and Management, National Chiao Tung University 1001 Ta Hsuen Road, Hsinchu, 300, Taiwan
b
Epistar Corporation
5 Li Hsin 5th Rd., Science-based Industrial Park, Hsinchu, 300, Taiwan
ABSTRACT
Kinmen Kaoliang Liquor Inc. (KKL), once a non-profit government monopoly, was corporatized in 1998. Cost reduction and profit maximization became a crucial goal. Located on an island apart from the main island of Taiwan, KKL sells over 90% of its produced liquor domestically. In order to re-structure its distribution system, KKL is planning to establish the distribution centers (DCs) in the main island of Taiwan. This study aims to provide the decision support from a quantitative aspect for KKL’s strategic plan. The classical fixed charge model is modified to take into consideration the inbound and outbound transportation costs of the DCs as well as the variable and fixed components of the DC facility costs. This study collects and estimates the related parameters in the model. The results indicate that the total cost will be 110,786,400 TW dollars per year, and three DCs are to be established.
Keywords: distribution centers, location analysis, fixed charge model
INTRODUCTION
Kinmen Kaoliang Liquor Inc. (KKL), once a non-profit government monopoly, was corporatized in 1998. Cost reduction and profit maximization became a crucial goal after the reform. Located on an island apart from the main island of Taiwan, KKL sells over 90% of its produced liquor domestically. There exist two major distributing channels: branch companies and sales agents. KKL manages the logistics operations through outsourced logistics services for the liquor sold by its branch companies. For the other channel, the sales agents take care of the whole logistics operations from the factory in Kinmen. Sales agents help to simplify the operations, but at the same time KKL suffers from several drawbacks, such as the reduction in profit margin and the rise of potential competitors. KKL has been retrieving the amounts of sales from the agents and is planning to establish the distribution centers (DCs) in charge of the logistics operations and trade transactions in the main island of Taiwan. These DCs may be the forerunner of the marketing company that KKL plans to invest for the next stage.
Although operations research techniques have been widely applied by the enterprises to design or re-structure its supply chain system (e.g., Laval et al., 2005 and Ulstein et al., 2006), the decision for locating DCs in most local companies is made mainly from a qualitative aspect. Thus, this study aims to provide the decision support by a quantitative approach for KKL’s strategic plan to establish the DCs
the main island of Taiwan. Various quantitative methods have been used for locating DCs in the several case studies in different areas. For example, Ehrgott and Rau (1999) developed the general cost models for both cost and delivery time of a bi-criteria evaluation method to analyze the scenarios for improving the distribution network in Nordic countries of a chemical company. Nozick and Turnquist (2001) combined the fixed-charge model and the coverage model to consider transportation cost, inventory cost, and service level for locating the distribution centers of an auto manufacturing company in North America. Farahania and Asgari (2007) combined the MCDM (Multi Attribute Decision Making) model and the covering model to determine the DCs in the military logistics system.
Based on the unique features of KKL, this study modified the classical fixed charge model to take into consideration the inbound and outbound transportation costs associated with the DCs as well as the variable and fixed components of the DC facility costs. This study collected the data from KKL to estimate the values of the associated parameters in the model. The result of the case study indicates that the total cost will be 110,786,400 TW dollars per year, and three DCs are to be established in Keelung, Changhua, and Kaohsiung in northern, central, southern Taiwan respectively. According to the sensitivity analysis, the changes in fixed cost and demand level are the most influential factors for locating the DCs.
The remainder of this paper is organized as follows. Section 2 provides the background of the company in the case study. Section 3 introduces the mathematical formulation, a modified fixed charged model, as well as the approach and the result for estimating the parameters in the MIP model. Section 4 provides the numerical results from solving the MIP model. Section 5 presents the sensitivity analysis and the scenario evaluation. Finally, the findings of this study are summarized and conclusions are drawn in Section 6.
CASE BACKGROUND
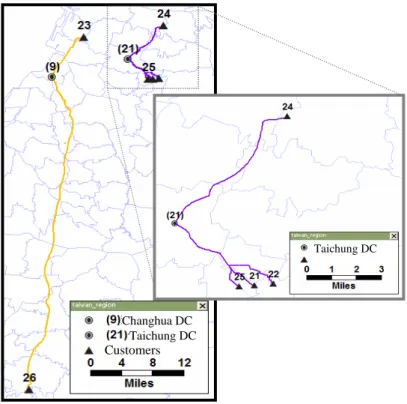
Kinmen (also known as Quemoy in early Spanish Romanization), a small archipelago of several islands, is administered by Kinmen County Government, a local government of Taiwan (ROC). The location of Kinmen is shown in Figure 1. Kinmen is geographically very near Xiamen, China (PRC) and is separated from the main island of Taiwan (also known as Formosa in Portuguese and later simply referred to as Taiwan) by the Taiwan Strait, which in average is about 200 kilometers wide. Due to its unique natural environment and outstanding manufacturing technique, Kinmen has been famous for the production of kaoliang jiu, a strong distilled liquor made from fermented sorghum.
Link 1 KKL’s Plant Liaolo Harbor Kaohsiung, Keelung, or Taichung Harbor Link 2 Potential DC Sites Link 3 Wholesalers Link 4
Kinmen Taiwan Taiwan Strait
The first distillery of KKL was established in 1952 and was re-named as Kinmen Distillery in 1956. Once a government monopoly, Kinmen Distillery was corporatized and became Kinmen Kaoliang Liquor Inc. in 1998. The sales of liquor of KKL have been growing steadily. The revenue exceeded the milestone of 10 billion TW dollars in 2006 and reached 11.2 billion TW dollars (about 368 million US dollars) in 2007. Over 90% of the revenue comes from the domestic sales in Taiwan, though KKL has begun to pay more attention to foreign markets such as China and some other countries.
Focusing on its core competence of liquor production, KKL traditionally has been relying on the sales agents to expand its market and simplify its operation, though it also maintains its own distribution channels and branch companies in Taiwan. However, a sales agent may become a competitor at the end of the agency contract if it turns o another liquor maker. Besides, the profit margin for the sales made though the agents tends to be low. Therefore, KKL has been retrieving the amounts of sales from the agents. As the nearly perfect quality of the kaoliang jiu produced by KKL heavily depends on the unique environment in Kinmen, it is unwise to move the production facility to any other place. KKL is thus planning to establish its own distribution centers in Taiwan to facilitate the distribution, to reduce the logistics cost, and to improve customer service.
Due to the geographical location, the delivery between the plant of KKL in Kinmen and the wholesales or distributors in Taiwan involves several transportation links with multiple modes. The transportation network after the establishment of the DCs is illustrated in Figure 2.
Figure 2 – Transportation links between KKL’s plant in Kinmen and demand nodes in Taiwan
The finished product is first transported from KKL’s plant in Kinmen to the Liaolo Harbor (Link 1), the only port with sea transportation service to Taiwan. KKL owns and operates a private fleet of trucks for carrying raw material as well as finished products. Thus, this transportation link is well-controlled, and the associated cost is relatively insignificant. As for the sea transportation between Kinmen and Taiwan (Link 2), several carriers are offering scheduled services between Liaolo to the three major sea ports in Taiwan, Kaohsiung, Keelung, or Taichung. Though with the shortest distance, the service to Taichung in central Taiwan is generally the least frequent and the most expensive. The space may be limited or even unavailable during the hot season, and the sea transportation service is by nature relatively unreliable due to weather conditions. These factors make this link the most troublesome in term of the whole logistics operation. At present, for the products distributed by KKL, the shipments are sent directly to the wholesalers from the ports by trucks. KKL currently has the outsourcing contract with several trucking companies in Taiwan. In the future, the products will be sent to the DCs (Link 3) first to replenish the inventory. Once a wholesaler places an order, the shipment is formed and delivered from the DC to the wholesaler (Link 4).
According to the arrangement of the transportation operations described above, the number and locations of the DC is critical in terms of the overall transportation cost. Nonetheless, facility cost
should be taken into account in order to minimize the overall logistics cost. The model introduced in the next section is used to provide the decision support to balance the trade-off between transportation cost and facility cost. As for inventory cost, KKL, a strong player with overwhelming market share, usually does not maintain a high level of safety inventory, and inventory cost is thus not considered in the model.
MATHEMATIC PROGRAMMING MODEL AND PARAMETER ESTIMATION
Location analysis models have been studied for a long period of time. According to Daskin (1995), there are four common types of problem formulations: coverage problems, median problems, P-center problems, and fixed charged facility location problems (later referred to as fixed charge models). For the models and the solution algorithms of location analysis, Mirchandani and Francis (1990) as well as Dresner (1995) also serve as an excellent source.
Based on the background described in the previous section, this study chose the fixed-charge problem to model the decision problem. In the first subsection, the mathematical programming model is presented. In particular, the definitions of the parameters have been modified so as to apply the classical model originally for two-staged problems to deal with the case with four transportation links as illustrated in Figure 2. In the second subsection, the approach and result for estimating the parameters in the mathematical programming model is described.
Mathematical programming model
The fixed-charge model is usually used to determine the number and location of the facilities by taking both transportation cost and facility cost into consideration. The transportation cost is assumed to linear, and there is no economy of scale. On the other hand, facility cost can be site-dependent, but is a fixed constant. The mixed integer programming model and the typical definitions of the parameters and variables are as follows:
Minimize
∑
∑∑
∈ ∈ ∈ + U i iU jV ij j ij i iX c hY f (1) Subject to V j Y U i ij = ∀ ∈∑
∈ 1 (2) , j V U i X Yij ≤ i ∀ ∈ ∈ (3) U i binary Xi: ∀ ∈ (4) V j U i Yij ≥0 ∀ ∈ , ∈ (5)• i: index for potential facility sites (U is set of all potential sites.) • j: index for customers (V is set of all customers.)
• fi: fixed cost of setting up a facility at potential site i
• hj: amount of demand at customer j
• cij: variable cost of serving customer j from a facility i
• Xi: binary decision variable representing that potential site i is selected
• Yij: variable representing the portion of demand at customer j served by a facility i
The objective function (1) is to minimize the total cost by adding the facility cost determined by the facility decision (Xj) and the transportation cost determined by the assignment decision (Yij). Constraint
Total Facility Cost Process Volume Fixed Facility Cost, fi Variable Facility Cost, gi Slope
site selection decision and the assignment decision is ensured by forcing the assignment variable to be zero if the associated facility is not open. In Constraint (4), the site selection variable is specified as a binary variable. Finally, Constraint (5) describes that the assignment variable is a non-negative real number.
For most cases, the facility cost is assumed to be a constant (fi), and is independent of the amount of
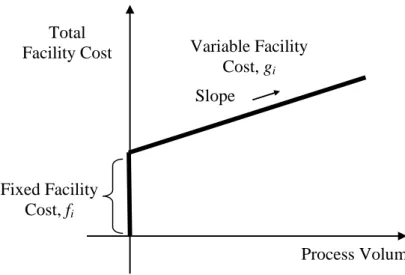
demand served, though the capacity limit can be imposed by adding one more constraint. However, for KKL, the produced liquor is usually stored by block stacking, and several cost components about the facility are in fact highly related to the process volume of a DC. In Figure 3, the possible relation between the total facility cost and the process volume of a DC for KKL is shown. It is assumed that there are two cost categories about setting and operating a DC. First, the administration cost of a DC (IT systems such as ERP, WMS, or TMS as well as the communication equipment and service) is basically independent of the process volume. A fixed cost is incurred as long as a DC is set up. Second, owing to the characteristics of KKL, the cost related to land purchase and construction expenditure as well as the direct operating cost (the machinery such as forklifts and air conditioners, the wage for the on-site workers, and the utility expenses for electricity and water etc.) can be proportional the process volume. As shown in Figure 3, the fixed component of the facility is the intercept of the vertical axis (fi), and the variable component of the facility cost is the slope of the straight line (gi). fi is simply the
fixed charge in the objective function (1). On the other hand, based on the technique provided in Ghiani
et al. (2004), gi can be incorporated into the variable cost, cij, in the objective function (1) as described
in the following paragraphs.
Figure 3 – Fixed and variable components of the facility cost at a DC
The variable cost in the objective function (1) is traditionally used (e.g., Daskin, 1995) to represent the transportation cost between the facility and the demand nodes, i.e., Link 4 in Figure 2. Therefore, the fixed-charge model is usually applicable only to the case of a two-echelon system. However, based on several assumptions, this study incorporated the transportation cost of all four links into the variable term in the objective function. For each potential facility site i, the inbound transportation cost (Link 3) can be merged with the outbound transportation cost (Link 4), if site i is always accessed through the sea port with the least inbound transportation cost. This arrangement is in fact the reality for the practice of KKL. Besides, it doest not affect the optimality of the overall MIP model if the freight rate is linear (i.e., no scale of economy) for the link between the sea port in Kinmen and the sea port in
Taiwan, and there is no capacity limit on the link. Similarly, once the pairing of the sea port in Taiwan and the potential facility site is pre-determined, the cost for the sea transportation (Link 2) is determined for each potential facility site i. Finally, the transportation cost between the plant of KKL and the Liaolo Harbor in Kinmen (Link 1) is actually a constant as a whole. This cost is thus can be attached to the assignment decision (Yij) and becomes part of the variable cost for a potential facility
site i.
The procedure of combining the transportation cost of all four links into the variable cost (cij) in the
objective function (1) can be summarized as the following. Especially, this study assumed that the transportation cost for all links are linear with respect to distance and the cost can be derived by multiplying the distance by the given per-kilometer freight rate. Suppose the plant of KKL is indexed by k, the Liaolo Harbor in Kinmen is indexed by l, and the three sea ports in Taiwan are indexed by m. The transportation costs of all four links originally should be computed as (6). However, since there is only one plant (k=1) and one seaport (l=1) in Kinmen, and the potential facility site i has been paired with the seaport in Taiwan m, the relation (6) is reduced to the relation (7). Therefore, the transportation cost can further be merged with the variable facility cost to generate the variable term (cij)
in the objective function (1) as shown in the relation (8). Then, cij should not be interpreted as the
variable (transportation) cost for the case of a two-echelon system in a classical way; instead, it refers to the variable cost related to the assignment (flow or process volume) decision (Yij) and can be thought
as the cost for shipping one unit of products from the plant in Kinmen via the DC i (though a specific sea port) to the customer j.
4 4 3 3 2 2 1 1 ij ij mi mi lm lm kl kld r d r d r d r + + + (6) where n pq
r is the per-km freight rate for link n from p to q, and dpqn is a similar definition for distance.
4 4 3 3 2 2 1 1 ij ij i i i i d r d r d r d r + + + (7) i ij ij i i i i ij r d r d r d r d g c =( 1 1+ 2 2+ 3 3+ 4 4)+ (8)
Model settings and parameter estimation
The estimation of the parameters in the model (1) to (8) as well as the set of the potential facility sites and the information about the customer set are determined based on several intensive meetings and communications with the staff of KKL. However, in order to protect the sensitive commercial data of KKL, the numbers in this subsection are intentionally adjusted to some extent. Nonetheless, the essence of this case study is still preserved, and the results presented in the next section are informative from the application point of view.
The set of the potential facility sites (U) consists of 25 industry parks around Taiwan. In general, one site is selected for each county or city (county-level or above), and one extra is included for those geographically large.
As for the set of the customers (V), 30 demand nodes are considered including the major wholesalers of KKL and its branch companies. In terms of the amount of demand for each demand node (hj), an
overall volume of 20 million liters per year are allocated to each demand node according to its historical sales data. In particular, some of the demand nodes are mega-wholesalers to KKL, whose allocated volume can be greater than 1 million liters.
There are two categories for the facility cost. For the fixed part (fi), it is assumed that setting up a
DC involves a cost of 3 million TW dollars per year. Regarding the variable facility cost (gi), it is
1. Land purchase: It is estimated that 0.0005m2 is required in average for handling one liter of liquor based on block stacking storage. In addition, the land price is based on the information provided by the Department of Land Administration, Minister of the Interior, Taiwan (DLA-MOI, 2007) for each of the industry park considered as a potential site.
2. Construction expenditure: It is estimated as 0.29 TW dollars per liter per year. This is in fact independent of the potential sites. Thus, it is not affected by the decisions and a constant in term of the total cost in the objective function (1).
3. Directing operating cost: It is estimated as 0.35 TW dollars per liter per year. It is also not affected by the decisions and a constant in term of the total cost in the objective function (1). There are four transportation links as shown in Figure 2. For land transportation, the delivery of all three links (Link 1, Link 3 and Link 4) is assumed to be done by trucks, either privately owned or outsourced. On the other hand, the sea transportation relies on the scheduled-service carriers.
1. Sea transportation: There are three routes between Liaolo Harbor in Kinmen and the sea ports near Keelung, Taichung, and Kaohsiung in Taiwan. The cost per liter(ri
2
di
2
) ranges from 2.0 to 2.5 TW dollars.
2. Land transportation: The base rate (ri3 and rij4) is set as 0.035 TW dollars per liter per km.
However, it is adjusted by a factor of a=10% to reflect the possible rate difference between DC inbound and outbound shipments. For the DC inbound transportation (Link 3), the contract trucking companies are likely to reduce the rate as the replenishment from the plant in Kinmen to an DC is usually scheduled in advance, and the shipment size is large. Thus, the value of
0.035(1-a) is used. On the other hand, for the DC outbound transportation (Link 4), the charge tends to be
higher, as the shipment initiated by a customer’s order is relatively uncertain, and the shipment size is small. Thus, the value of 0.035(1+a) is used.
RESULTS OF THE MIP MODEL
The MIP model (1) to (5) is solved by the optimization software package LINGO 8.0.The numerical results and their implications are summarized as the followings.
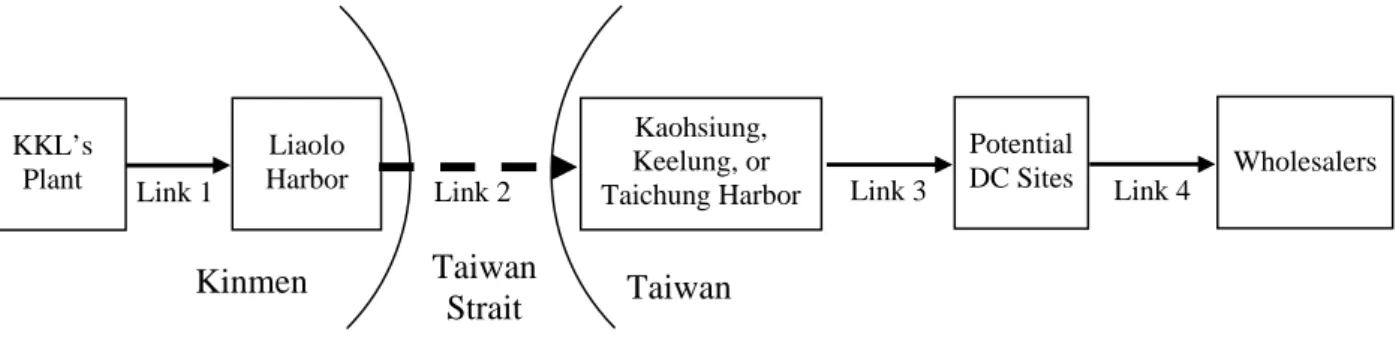
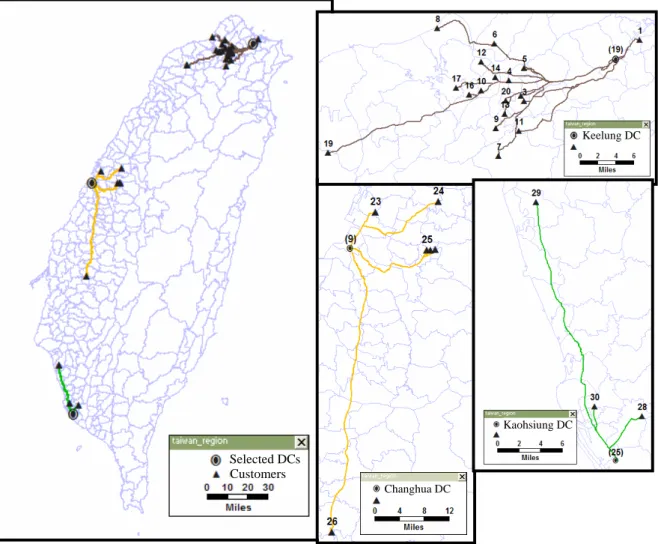
Regarding the site selection, the number of DCs to be set up is three. They are near Keelung, Changhua, and Kaohsiung in northern, central, southern Taiwan respectively. The locations of the three DCs as well as the assignment of the demand nodes to the DCs are shown in Figure 4.
It is noteworthy that one DC is set up to serve the demand nodes that appear to be clustered. However, the exact location of the DC is not at the center of gravity as most location models might suggest. In stead, it is relatively close to the sea port, as the DC inbound transportation cost is included in the model as in (8).
Based on the site selection for DCs and the assignment of the demand nodes to the DCs shown in Figure 4, the results and the cost analysis from various aspects are summarized as follows:
1. Total cost: The objective function value of (1) is 110,786,400 TW dollars.
2. Fixed cost vs. Variable cost: As three DCs are set up, the fixed-cost component in the objective function (1) is 9,000,000 TW dollars, and the variable cost component is then 101,786,400 TW dollars. However, the transportation cost from KKL’s plant to Liaolo Harbor in Kinmen (Link 1) is a constant, and two sub-categories of the variable facility cost (the construction expenditure and the direct operating cost) are site-independent and thus constants as well. The sum of these constant cost terms is 20,950,000 TW dollars. If they are removed from the MIP model, the ratio of the fixed cost component to the variable cost component in the objective function turns out to be 1:9, which is the true trade-off the MIP model tries to find the balance. It appears that both components are significant, and the relative importance is furthered examined in the sensitivity analysis in the next section.
Selected DCs
Keelung DC
Kaohsiung DC
Changhua DC
Customers
3. Transportation cost vs. Facility cost: The sum of the transportation cost for all four links is 84,395,530 TW dollars. The unit transportation cost is in average 4.2 TW dollars per liter, and the cost ratio of sea transportation to land transportation is about 5:6. As for the facility cost, the sum of all cost components is 26,390,870 TW dollars. The shares of transportation cost and facility cost with respect to the total cost are 76% and 24% respectively.
Figure 4 – Selection of DC sites and assignment between DCs and demand nodes
SENSITIVITY ANALYSIS AND SCENARIO EVALUATION
To ensure the reliability and robustness of the decisions suggested by the mathematical programming model, a sensitivity analysis is conducted with respect to the factors that are potentially influential to the results. In addition, in order to generate more managerial insights, the MIP model is applied to different scenarios.
Sensitivity analysis
Three factors are considered in the sensitivity analysis: the fixed facility cost, the overall demand level, and the cost difference between the DC inbound and outbound transportation cost.
Taichung DC
Taichung DC
Customers
Changhua DC
1. Fixed facility cost: The fixed facility cost, i.e., fi in the objective function (1), covers the cost
items involved in setting up a DC and is independent of the capacity. The most important item is the IT system and the communication equipment. The implication of varying the value of fi is to
adjust the class of these hardware and software systems. Meanwhile, it can also be viewed as raising the level of safety inventory (Nozick and Turnquist, 1998). It is found that if fi is reduced
from 3,000,000 to 1,000,000 TW dollars, the number of DCs is increased to four. In addition to the three DC previously set up in northern, central, and southern Taiwan (Keelung, Changhua, and Kaohsiung), one more is to be established in Taichung, also in central Taiwan. The split of the demand nodes in central Taiwan as well as the exact location of the fourth DC are illustrated in Figure 5. On the other hand, if fi is increased to 5,000,000 TW dollars, the decision for locating
DCs remains unchanged. However, if fi is further increased to 10,000,000 TW dollars, the DC in
southern Taiwan (Kaohsiung) is dropped, and the customers are assigned to the DC in central Taiwan (Changhua). Nonetheless, even though only two DCs are set up, the logistics cost per liter is only increased slightly. The total cost is increased to 127,819,600 TW dollars (a 15% increase when compared to the based case), and the ratio of the fixed cost to the variable cost becomes 2:8, a result due to the adjustment made by the model.
Figure 5 – The fourth DC due to the reduction of fixed cost or the increase of demand
2. Overall demand level: The demand parameter for each demand node (hj) is estimated by
assuming the overall annual demand of 20,000,000 liters. However, for the past several decades, the sales of KKL have been growing steadily. In order to understand how KKL should re-act to the possible demand increase, the overall demand level is increased gradually to test the MIP model. It is found that once the overall demand is higher than 30,000,000 liters, one more DC should be set up, and the location of the fourth DC is also at Taichung, as the one shown in Figure 5. The original DC at Changhua is close to the sea port in central Taiwan. However, the
DC at Taichung is adjacent to the heavily populated Taichung metropolitan. The increase of the demand makes it feasible to pay for the fixed cost for another DC by being compensated by the reduction of the DC outbound transportation cost.
3. Cost difference between DC inbound and outbound transportation: The base rate for the land transportation is assumed to be 0.035(1-a) and 0.035(1+a) NT dollars per km for DC inbound and outbound transportation links to reflect the natures of the shipments into and out of the DCs. The value of the parameter a is initially set as 10%. The value of a is adjusted from 0 to 30% to test its effect. It is found that the decision regarding the number and location of the DCs remains unchanged, though the total cost is changed slightly (within 2%).
Scenario evaluation
Before the study, KKL initially considered setting up only one DC in Taiwan so as to minimize the administrative complexity. The best location for this single DC can be determined by the MIP model (1) to (5) plus one extra constraint of limiting the sum of the binary decision variables (Xi’s) to be 1. It is
found the best location is Changhua in central Taiwan, and the total logistics is increased from 110,786,400 to 165,786,400 TW dollars, an almost 50% increase when compared to that of the optimal solution. Therefore, KKL’s initial thought may be preferable from the administration point of view, but the extremely high transportation cost incurred makes the idea not viable.
In general, the customers of KKL are quite stable over time, as most of the wholesalers have been in the business for a long period of time. However, it is possible that the wholesalers may relocate their warehouses. Besides, the possibility of more new comers for this business cannot be ruled out. As the liquor consumption is closely related to population, the set of demand nodes and the amount of the associated demand are adjusted. The annual demand of 20,000,000 liters is re-allocated to 17 hypothetical demand nodes, which are the location of the local governments. In addition, the amount of demand for each node is set to be proportional to the population in the area. The results shows there are still three DCs to be established (one in northern, central, and southern Taiwan respectively). However, the DC in central Taiwan is moved from Changhua to Taichung, where the population and then the demand are higher.
CONCLUSIONS
Located on an island apart from the main island of Taiwan, KKL sells over 90% of its produced liquor domestically. In 2007, KKL’s revenue has reached 11.2 billion TW dollars. In order to raise its profit margin and provide better service, KKL has been retrieving the amounts of sales from the agents and is planning to establish the distribution centers in Taiwan.
This study aims to provide the decision support, especially from a quantitative aspect, for KKL’s strategic plan for establishing the DCs in Taiwan. The classical fixed charge model is modified to take into consideration the inbound and outbound transportation costs associated with the DCs as well as the variable and fixed components of the DC facility costs. This study collects and estimates the values of the associated parameters in the model. The results indicate that the total cost is 110,786,400 TW dollars per year, and three DCs are to be established in Keelung, Changhua, and Kaohsiung in northern, central, southern Taiwan respectively. The sum of the transportation cost for all four links is 84,395,530 TW dollars, making the unit transportation cost to be 4.2 TW dollars per liter. The total facility cost is 26,390,870 TW dollars, and the ratio of transportation cost to facility cost is about 76% to 24%.
The sensitivity analysis is performed with respect to three factors. The result shows that the changes in fixed cost and demand level are the most influential factors for locating the DCs. If the fixed cost is reduced from 3,000,000 to 1,000,000 NT dollars, the number of the DCs is increased from three to four.
One more DC will be established at Taichung in central Taiwan. On the other hand, if the fixed cost is creased to 10,000,000 TW dollars, the DC in southern Taiwan (Kaohsiung) is dropped, and the customers are assigned to the DC in central Taiwan (Changhua).
In the scenario evaluation, it is found that KKL’s initial thought of setting up only one DC in Taiwan is not economically feasible, thought the administrative complexity can be significantly reduced. The total logistics is increased from 110,786,400 to 165,786,400 TW dollars, an almost 50% increase. In the second scenario, instead of being distributed according to the locations of the current wholesalers, the overall demand is re-allocated according to the population in the counties and cities. It is found the optimal decision for locating the DCs appears to be not very sensitive to the demand distribution, as the locations of the DCs are only slightly changed.
The number of binary variables in the MIP of (1) to (5) is not many, and the optimal solution can be solved easily. However, this formulation relies on several assumptions and simplifications, which leads to the direction of future research for this case study. First, transportation cost is assumed to be linear, and the freight transportation is independent of volume. However, it is common that transportation exhibits significant scale of economy. The decision for locating the DCs should be re-examined if the cost curves of the transportation links are concave. Second, at this moment, inventory cost is not considered in the model, as KKL does not maintain a high level of safety inventory due to its superior market power. However, the business environment changes rapidly, and KKL may need to raise its safety inventory and the customer service level in the future. The decisions for locating the DCs should also take inventory into consideration.
REFERENCES
Daskin, M.S. (1995), Network and Discrete Location: Models, Algorithms, and Applications, John Wiley and Sons, New York.
DLA-MOI (2007), the Department of Land Administration, Minister of the Interior, Taiwan, http://www.land.moi.gov.tw/enhtml/index.asp
Dresner, Z. (1995), Facility Location: A Survey of Applications and Methods, Springer, New York.
Ehrgott, M. and Rau, A. (1999), “Bicriteria cost versus service analysis of a distribution network - A case study,” Journal of
Multicriteria Decision Analysis, Vol. 8, pp. 256-267.
Farahania, R.Z. and Asgari, N. (2007) “Combination of MCDM and covering techniques in a hierarchical model for facility location - A case study,” European Journal of Operational Research, Vol. 176, pp. 1839-1858.
Ghiani, G., Laporte, G. and Musmanno, R. (2004), Introduction to Logistics Systems Planning and Control, John Wiley and Sons, West Sussex, England.
Laval, C., Feyhl, M., and Kakouros, S. (2005) “Hewlett-Packard combined OR and expert knowledge to design its supply chains,” Interfaces, Vol. 35, pp. 238-246.
Mirchandani, P.B. and Francis, R.L. (1990), Discrete Location Theory, John Wiley and Sons, New York.
Nozick, L.K. and Turnquist, M.A. (1998) “Integrating inventory impacts into a fixed-charge model for locating distribution centers,” Transportation Research, Part E, Vol. 34, pp. 173-186.
Nozick, L.K. and Turnquist, M.A. (2001) “Inventory, transportation, service quality and the location of distribution centers,” European Journal of Operational Research, Vol. 129, pp. 362-371.
Ulstein, N.L., Christiansen, M., and Gronhaug, R. (2006) “Elkem uses optimization in redesigning its supply chain,”
附件二:可供推廣之研發成果資料表
□可申請專利 ■可技術移轉 日期:96 年 10 月 31 日國科會補助計畫
計畫名稱:以改良式基因演算法求解最小化的自動導引車系統週期 時間 計畫主持人:黃寬丞 計畫編號:97-2221-E-009-122- 學門領域:交通運輸技術/創作名稱
單迴圈(single loop)AGV 生產系統之工件排序演算法發明人/創作人
黃寬丞 中文:自動導引車是當今彈性製造系統(Flexible Manufacturing System, FMS)和倉儲自動化系統中很重要的作業設施。在生產的流 程中,有效加工時間佔的比例通常不大,相對花費在運送、等待的 時間則佔有相當大的比例。因此,針對生產系統中最常見的單迴圈 (single loop)AGV 系統,在 ES (Early Start)為派遣法則(dispatching policy)下,發展出一以最小化生產週期,也就是最大化其有效產出 (throughput),的數學模式,並以基因演算法(Genetic Algorithm, GA) 來求解最小工件集合(Minimal Job Set, MJS)內之工件序列(job sequence)。技術說明
英文:AGVplays an important role for today’s manufacturing andwarehousing systems. In a manufacturing process, the time actually spent on the machines is sometimes not very long; on the other hand, a significant portion of the whole process time is consumed for transporting and waiting. Therefore, this study develops a mathematical model for a common single-loop AGV system to minimize the production cycle time (i.e., to maximize the production throughput), given the predetermined ES (Early Start) AGV dispatching policy. This study designs a genetic algorithm to determine the sequence for the jobs in an MJS (Minimal Job Set) so as to reduce the AGV cycle time.
可利用之產業
及
可開發之產品
使用 AGV 之彈性製造系統或者倉儲自動化系統。技術特點
可於短時間內產生極佳的工件排序結果,以利提升系統的生產效 率,且相較於模擬的演算法,有較可靠的求解品質依據。推廣及運用的價值
對於產量極大的工廠,若其工件種類繁多,本研究之演算法將可節 省可觀的工件排序時間,並縮短其生產週期時間。 ※ 1.每項研發成果請填寫一式二份,一份隨成果報告送繳本會,一份送 貴單位研 發成果推廣單位(如技術移轉中心)。 ※ 2.本項研發成果若尚未申請專利,請勿揭露可申請專利之主要內容。附件一:出席國際會議研究心得報告
計畫編號:97-2221-E-009-122-
計畫名稱:以改良式基因演算法求解最小化的自動導引車系統週期時間
會議名稱:The 3rd World Conference on Production and Operations Management (POM Tokyo 2008) 會議概況:本世界性會議是由生產與作業管理(Production and Operations Management, POM)領域 的 三 個 區 域 國 際 組 織 合 辦 , 分 別 是 北 美 的 POMS (Production and Operations Management Society) 、 歐 洲 的 EurOMA (European Operations Management Association) 和 日 本 的 JOMSA (Japanese Operations Management and Strategy Association)。過去分別於西班牙的 Seville (2000)和 墨西哥的 Cancun (2004)舉辦過第一、二屆會議,本次則是在日本的 Tokyo 舉辦第三次會議,是 POM 領域重要的國際會議之一。本會議歷次舉辦均吸引相當多各國研究人員參與,是一個國際 參與(International Participation)極高的會議。本次有 44 國 414 位人員參與,亞洲的與會人員約有 150 位(包含主辦國日本 65 位)。 目的:參與會議的主要目的在希望藉由論文之發表,和與會者討論,能夠獲得回饋意見及改進 方向,使得本篇論文能更加完善,以利後續研究工作之延伸。同時,另外也希望經由與各國學 者的交流和討論,獲取不同運輸領域的新知識。此外,本次口頭發表之論文,除將收錄在會議 論文集外,也獲得評審的建議,於會後投稿國際期刊。目前有部份國際會議都會擇優將論文推 薦至相關國際期刊,以Special Issue的方式在審查後刊出,但前提都必須親自前往做口頭報告。 過程:於2008年8月4日撘乘中華航空公司CI 101班機由台灣桃園機場抵達日本東京成田機場,8 月5日赴學習院大學(Gakushuin University)會場參加研討會並口頭發表論文(包含會議Section Chair主持), 8月6日在參加研討會後,撘乘中華航空公司CI018班機由日本東京成田機場返回 台灣桃園機場。
會議心得與建議:個人所發表之論文 (Location Analysis of Distribution Centers: A Case Study of Kinmen Kaoliang Liquor Inc.)是以本國金酒公司為個案的物流中心區位分析研究,同一 Section 另有泰國 學者執行 該國國家 計畫所進 行之「泰國橡膠工 業出口中 國之物流 中心規劃 案」 (Determination of Distribution Center Locations for Thai Rubber in China)。兩篇個案研究論文同場 進行發表與研討,有許多相似與相異的觀點可以加以比較,同場參與者的討論相當熱烈,收穫 也相當豐碩。有關基於參與此次會議之心得所產生的建議包含以下幾項:
一、 由於各個管理領域的研究課題與研究工具相異,主辦單位對於會議各個主題與分節 (tracks and sections)的安排也必須煞費苦心。本次的會議,特別將數學模式(mathematical
modeling)相關的論文均安排於特定的 Sessions,並在 Conference Program 上特別以 m-(代 表 mathematical modeling)註記,讓對定量研究較有興趣的學者可以輕易地掌握相關論文 的時間與地點,是一項很好的會議安排。
二、 本次會議主辦單位安排多個日本知名企業的參觀,包含 JFE Steel Corporation、Honda Motor Co. Ltd.、Mori Seiki Co. Ltd.、NTT Information Sharing Laboratory Group of NTT Corporation、Yokogawa Electric Corporation。此次,受於時間的限制,無法報名參加, 日後有參與其他國際會議也可將此行程納入考量。 三、 個人認為國內之研究與許多國際間之研究,在水準上應無極大的差距,但與會者的簡報 技巧及溝通能力較為不足,尤其是英文能力普遍較無法應付國際會議的場合。解決之 道,可考慮先在國內透過課程或者 Workshop 來培養相關的能力。此外,多多參予國際 會議仍是提升能力的必要途徑。 四、 目前有部份國際會議都會擇優將論文推薦至相關國際期刊,以 Special Issue 的方式在審 查後刊出,但前提都必須親自前往做口頭報告。建議有類似安排的國際會議能儘量予以 補助,對於學術論文的發表應該很有助益。 (口頭發表之論文全文如下。)
LOCATION ANALYSIS OF DISTRIBUTION CENTERS: A CASE STUDY OF
KINMEN KAOLIANG LIQUOR INC.
Kuancheng Huang a and Ying-Hsuann Chen b
a
Department of Transportation Technology and Management, National Chiao Tung University 1001 Ta Hsuen Road, Hsinchu, 300, Taiwan
b
Epistar Corporation
5 Li Hsin 5th Rd., Science-based Industrial Park, Hsinchu, 300, Taiwan
ABSTRACT
Kinmen Kaoliang Liquor Inc. (KKL), once a non-profit government monopoly, was corporatized in 1998. Cost reduction and profit maximization became a crucial goal. Located on an island apart from the main island of Taiwan, KKL sells over 90% of its produced liquor domestically. In order to re-structure its distribution system, KKL is planning to establish the distribution centers (DCs) in the main island of Taiwan. This study aims to provide the decision support from a quantitative aspect for KKL’s strategic plan. The classical fixed charge model is modified to take into consideration the inbound and outbound transportation costs of the DCs as well as the variable and fixed components of the DC facility costs. This study collects and estimates the related parameters in the model. The results indicate that the total cost will be 110,786,400 TW dollars per year, and three DCs are to be established.
Keywords: distribution centers, location analysis, fixed charge model
INTRODUCTION
Kinmen Kaoliang Liquor Inc. (KKL), once a non-profit government monopoly, was corporatized in 1998. Cost reduction and profit maximization became a crucial goal after the reform. Located on an island apart from the main island of Taiwan, KKL sells over 90% of its produced liquor domestically. There exist two major distributing channels: branch companies and sales agents. KKL manages the logistics operations through outsourced logistics services for the liquor sold by its branch companies. For the other channel, the sales agents take care of the whole logistics operations from the factory in Kinmen. Sales agents help to simplify the operations, but at the same time KKL suffers from several drawbacks, such as the reduction in profit margin and the rise of potential competitors. KKL has been retrieving the amounts of sales from the agents and is planning to establish the distribution centers (DCs) in charge of the logistics operations and trade transactions in the main island of Taiwan. These DCs may be the forerunner of the marketing company that KKL plans to invest for the next stage.
Although operations research techniques have been widely applied by the enterprises to design or re-structure its supply chain system (e.g., Laval et al., 2005 and Ulstein et al., 2006), the decision for locating DCs in most local companies is made mainly from a qualitative aspect. Thus, this study aims to provide the decision support by a quantitative approach for KKL’s strategic plan to establish the DCs
the main island of Taiwan. Various quantitative methods have been used for locating DCs in the several case studies in different areas. For example, Ehrgott and Rau (1999) developed the general cost models for both cost and delivery time of a bi-criteria evaluation method to analyze the scenarios for improving the distribution network in Nordic countries of a chemical company. Nozick and Turnquist (2001) combined the fixed-charge model and the coverage model to consider transportation cost, inventory cost, and service level for locating the distribution centers of an auto manufacturing company in North America. Farahania and Asgari (2007) combined the MCDM (Multi Attribute Decision Making) model and the covering model to determine the DCs in the military logistics system.
Based on the unique features of KKL, this study modified the classical fixed charge model to take into consideration the inbound and outbound transportation costs associated with the DCs as well as the variable and fixed components of the DC facility costs. This study collected the data from KKL to estimate the values of the associated parameters in the model. The result of the case study indicates that the total cost will be 110,786,400 TW dollars per year, and three DCs are to be established in Keelung, Changhua, and Kaohsiung in northern, central, southern Taiwan respectively. According to the sensitivity analysis, the changes in fixed cost and demand level are the most influential factors for locating the DCs.
The remainder of this paper is organized as follows. Section 2 provides the background of the company in the case study. Section 3 introduces the mathematical formulation, a modified fixed charged model, as well as the approach and the result for estimating the parameters in the MIP model. Section 4 provides the numerical results from solving the MIP model. Section 5 presents the sensitivity analysis and the scenario evaluation. Finally, the findings of this study are summarized and conclusions are drawn in Section 6.
CASE BACKGROUND
Kinmen (also known as Quemoy in early Spanish Romanization), a small archipelago of several islands, is administered by Kinmen County Government, a local government of Taiwan (ROC). The location of Kinmen is shown in Figure 1. Kinmen is geographically very near Xiamen, China (PRC) and is separated from the main island of Taiwan (also known as Formosa in Portuguese and later simply referred to as Taiwan) by the Taiwan Strait, which in average is about 200 kilometers wide. Due to its unique natural environment and outstanding manufacturing technique, Kinmen has been famous for the production of kaoliang jiu, a strong distilled liquor made from fermented sorghum.
Link 1 KKL’s Plant Liaolo Harbor Kaohsiung, Keelung, or Taichung Harbor Link 2 Potential DC Sites Link 3 Wholesalers Link 4
Kinmen Taiwan Taiwan Strait
The first distillery of KKL was established in 1952 and was re-named as Kinmen Distillery in 1956. Once a government monopoly, Kinmen Distillery was corporatized and became Kinmen Kaoliang Liquor Inc. in 1998. The sales of liquor of KKL have been growing steadily. The revenue exceeded the milestone of 10 billion TW dollars in 2006 and reached 11.2 billion TW dollars (about 368 million US dollars) in 2007. Over 90% of the revenue comes from the domestic sales in Taiwan, though KKL has begun to pay more attention to foreign markets such as China and some other countries.
Focusing on its core competence of liquor production, KKL traditionally has been relying on the sales agents to expand its market and simplify its operation, though it also maintains its own distribution channels and branch companies in Taiwan. However, a sales agent may become a competitor at the end of the agency contract if it turns o another liquor maker. Besides, the profit margin for the sales made though the agents tends to be low. Therefore, KKL has been retrieving the amounts of sales from the agents. As the nearly perfect quality of the kaoliang jiu produced by KKL heavily depends on the unique environment in Kinmen, it is unwise to move the production facility to any other place. KKL is thus planning to establish its own distribution centers in Taiwan to facilitate the distribution, to reduce the logistics cost, and to improve customer service.
Due to the geographical location, the delivery between the plant of KKL in Kinmen and the wholesales or distributors in Taiwan involves several transportation links with multiple modes. The transportation network after the establishment of the DCs is illustrated in Figure 2.
Figure 2 – Transportation links between KKL’s plant in Kinmen and demand nodes in Taiwan
The finished product is first transported from KKL’s plant in Kinmen to the Liaolo Harbor (Link 1), the only port with sea transportation service to Taiwan. KKL owns and operates a private fleet of trucks for carrying raw material as well as finished products. Thus, this transportation link is well-controlled, and the associated cost is relatively insignificant. As for the sea transportation between Kinmen and Taiwan (Link 2), several carriers are offering scheduled services between Liaolo to the three major sea ports in Taiwan, Kaohsiung, Keelung, or Taichung. Though with the shortest distance, the service to Taichung in central Taiwan is generally the least frequent and the most expensive. The space may be limited or even unavailable during the hot season, and the sea transportation service is by nature relatively unreliable due to weather conditions. These factors make this link the most troublesome in term of the whole logistics operation. At present, for the products distributed by KKL, the shipments are sent directly to the wholesalers from the ports by trucks. KKL currently has the outsourcing contract with several trucking companies in Taiwan. In the future, the products will be sent to the DCs (Link 3) first to replenish the inventory. Once a wholesaler places an order, the shipment is formed and delivered from the DC to the wholesaler (Link 4).
According to the arrangement of the transportation operations described above, the number and locations of the DC is critical in terms of the overall transportation cost. Nonetheless, facility cost