The associations of different measurements of obesity with cardiovascular risk factors in
Chinese
H.-S.Hsu1,5, C.-S.Liu1,3, F. X.Pi-Sunyer8, C.-H..Lin1,3, C.-I.Li2, C.-C.Lin1,3,4,7, T.-C.Li2,5,7,
W.-Y.Lin1,3,4,8
1
Department of Family Medicine and 2Medical Research, China Medical University Hospital,
Taichung, Taiwan; 3Department of Family Medicine, 4Graduate Institute of Clinical Medical
Science, 5Graduate Institute of Biostatistics, and 6Graduate Institute of Integrated Medicine,
China Medical University, Taichung, Taiwan; 7Institute of Health Care Administration, Asia
University, Taichung, Taiwan; 8Obesity Research Center, St. Luke’s-Roosevelt Hospital, Columbia University– College of Physicians and Surgeons, New York, United States
Short running title: obesity and cardiovascular disease in Chinese
Correspondence and reprint request to:
Wen-Yuan Lin, MD, PhD1,3,4,8
Department of Family Medicine, China Medical University Hospital,
2, Yuh-Der Road, Taichung, Taiwan 404
Tel: +886-4-22052121 ext 4507, Fax: +886-4-22361803,
E-Mail: [email protected]
Conflict of Interest and Funding Disclosure
(NSC93-2314-B-039-025, NSC 94-2314-B-039-024), from China Medical University
Hospital (DMR-96-118 and DMR-97-149), and from US National Institutes of Health (DK
026687).
ABSTRACT
Background: Obesity increases the risks of cardiovascular diseases (CVD). This study
examined the optimal cut-off values for overweight and obesity for CVD risks using
different anthropometric indices in middle-aged Taiwanese.
Materials and Methods: A total of 2359 subjects aged 40 years and over were recruited in
2004 in Taiwan. Body mass index (BMI) was divided into four groups using three different
definitions. Waist circumference (WC), waist-to-hip ratio (WC/HC), and waist-to-height ratio
(WC/H) were divided into quartiles. The receiver operating characteristic analysis was used to
compare their predictive validity and to find out their optimal cut-off values.
Results: Men were older and had greater height, weight, BMI, WC, WC/HC, WC/H, blood
pressure (BP), fasting glucose, uric acid, and triglycerides than women. In all BMI definitions,
subjects in higher BMI groups had higher BP, fasting glucose, triglycerides, uric acid, and
WC than subjects in lower BMI groups. Compared to quartile I of WC, WC/HC, and WC/H,
the odds ratios of having CVD risk factors increased in higher quartiles of WC, WC/HC, and
WC/H. The optimal cut-off values for overweight/obesity in middle-aged Taiwanese in men
and women were as follows: BMI of 23.7 and 22.4 kg/m2, WC of 82.5 and 72.5 cm, WC/HC
of 0.87 and 0.79, and WC/H of 0.50 and 0.46, respectively. WC/H is the best indicator for
predicting CVD risks.
related to CVD risk factors. WC/H is the best predictor of CVD risk factors in middle-aged
Taiwanese.
Keywords: Body mass index, waist circumference, waist-to-hip ratio, waist-to-height ratio,
Introduction
The prevalence of obesity is increasing globally [1]. The World Health Organization (WHO)
has reported that approximately 1.6 billion adults (age 15 years old and above) are overweight
and at least 400 million adults are obese [2]. WHO further projects that by 2015,
approximately 2.3 billion adults will be overweight and more than 700 million will be obese
[2]. This problem occurs in Taiwan, where the age-adjusted prevalence of obesity increased
from 10.5% to 15.9% for men from 1993-1996 to 2000-2001 [3]. Furthermore, Flegal et al.
has proposed that obesity is the secondary preventable cause of death [4]. Obesity has been
recognized as an important risk factor for many chronic diseases, such as diabetes,
hypertension, and cardiovascular disease (CVD) [5-7]. Obesity also increases CVD and
all-cause mortality [8-10].
Obesity consists of excessive fat deposits throughout in the body, whereas central obesity
means the body fat in the mid-body region, much of it in the intra-abdominal area. Several
methods have been proposed to estimate body fat, such as hydrodensitometry, bioelectrical
impendence, dual energy X-ray absorptiometry (DEXA), and anthropometric indices (such as
skinfold thickness measurements and body mass index (BMI)). For comparisons among areas,
WHO has proposed using BMI and waist circumference (WC) to estimate fatness. BMI is a
marker of overall (general) obesity. Compared with overall obesity, central obesity appears to
obesity, a number of anthropometric measurements, such as WC, waist-to-hip ratio (WC/HC),
and waist-to-height ratio (WC/H), are used in general practice [15-17]. However, which index
of obesity best predicts CVD risk factors is still controversial.
Increasing obesity has led to a global burden of chronic diseases. For example, Amos et al has
estimated that the incidence of diabetes will increase by 2- to 3-fold in Asia in 2010 due to the
increasing prevalence of obesity [18]. Many studies have reported that obesity, measured by
anthropometry, is strongly related to CVD risk factors. However, most of these studies
focused on Caucasians, not Chinese. The criteria for defining obesity and metabolic syndrome
need to consider the influence of ethnicity [19-21]. The increased risks associated with
obesity have been found to occur at a lower BMI in Asians than in Caucasians [22, 23]. For a
given weight, Asians have greater total body fat content and abdominal fat accumulation than
do Caucasians [24, 25]. For example, Chang et al comparing obese Caucasians (BMI ≥ 30
kg/m2) to Taiwanese with the same body fat level, reported that the equivalent BMI for
Taiwanese was 26.2 kg/m2 in men and 24.3 kg/m2 in women, showing that Taiwanese have
similar body fat to Caucasians at a much lower BMI level [24]. A similar phenomenon is also
found in Singapore Chinese [26].Therefore, WHO has proposed a lower BMI value for
overweight and obesity in the Asia-Pacific region than that suggested for Caucasians in 2000.
Different countries have made their own definitions on obesity. Therefore, we assessed the
using three different BMI definitions. Only limited studies addressed this issue [27]. We also
used the receiver operating characteristic (ROC) analysis to compare their predictive validity
and to find out the optimal cut-off values for predicting CVD risk factors in middle-aged
Materials and Methods
Study population and sampling method
The target population consisted of residents aged 40 and above in Taichung city, Taiwan in
2004. A total of 363,543 residents in this area during the time of study were identified, which
represented about 4.09 % of the national population of the same age. A two-stage sampling
design was used to identify residents, with a sampling rate proportional to size within each
stage [28-30]. 4280 individuals were selected. Then, household visits were done by trained
staff. The excluded criteria during household visit included death, hospitalization or
imprisonment, living abroad, moving out, living in their children’s house, mistake of the
sampling frame, and not being at home during 3 visits made by interviewers. Except these
reasons, all individuals were included in the study. During household visits, 750 individuals
were identified who were not eligible and therefore, they were excluded from the study
sample. Finally, 3530 individuals were invited to participate in this study. However, 1171
individuals refused to participate in this study. Hence, the study sample was 2359 individuals.
The overall response rate was 66.8 %, as previously reported [30-32].
Anthropometric indices and biochemical determinations
The detailed methods used in this study for anthropometric indices measurements and
calculated as WC (cm) divided by HC (cm). WC/H was calculated as WC (cm) divided by
height (cm). BMI was calculated as weight (kg) divided by height square (m2) and was
categorized into 4 groups according to three different definitions for obesity. First, BMI was
defined from WHO [1] as: (1) Underweight: BMI < 18.5 kg/m2; (2) Normoweight: 25 > BMI
≥ 18.5 kg/m2
; (3) Overweight: 30 > BMI ≥ 25 kg/m2; (4) Obese: BMI ≥ 30 kg/m2. Second, it
was defined from the Asia-Pacific region of WHO [33] as: (1) Underweight: BMI <18.5
kg/m2; (2) Normoweight: 23 > BMI ≥ 18.5 kg/m2; (3) Overweight: 25 > BMI ≥ 23 kg/m2; (4) Obese: BMI ≥ 25 kg/m2
. Third, BMI was defined from the Department of Health (DOH) of
Taiwan [34] as: (1) Underweight: BMI < 18.5 kg/m2; (2) Normoweight: 24 > BMI ≥ 18.5 kg/m2; (3) Overweight: 27 > BMI ≥ 24 kg/m2; (4) Obese: BMI ≥ 27 kg/m2. Body composition
was measured using bioelectrical impedance analysis (TBF-410, Tanita Co., Tokyo, Japan).
Blood was drawn in the morning after a 12-h overnight fast and was sent for analysis within
4-h of collection. Biochemical markers were analyzed with a biochemical autoanalyzer
(Beckman Cou, Fullerton, CA, USA) at the Clinical Laboratory Department (China Medical
University Hospital, Taichung, Taiwan).
Cardiovascular disease risk factors and metabolic syndrome
Hypertension was defined as systolic BP ≥140 mmHg, and/or diastolic BP ≥90 mmHg,
and/or hypertension history with anti-hypertensive drug treatment [35]. Diabetes was defined
insulin treatment [36]. Hyperglycemia was defined as fasting glucose ≥ 5.6 mmol/L and/or
diagnosed diabetes mellitus [36]. Dyslipidemia was defined as subjects with high triglycerides
(TG) level (fasting TG ≥ 1.7 mmol/L) and/or high total cholesterol (TCHOL) level (TCHOL ≥
5.17 mmol/L) and/or low high-density-lipoprotein cholesterol (HDL-C) level (HDL-C< 1.03
mmol/L in men or <1.29 mmol/L in women) [37]. Hyperuricemia was defined as serum uric acid ≥ 446.1 μmol/L in men or ≥ 386.6 μmol/L in women. Metabolic syndrome (MetS) was defined clinically, by the presence of 3 or more of the following American Heart
Association/National Heart, Lung, and Blood Institute criteria (AHA/NHLBI) MetS criteria
[37]: (1) central obesity (WC ≥ 90 cm in men, and ≥ 80 cm in women), (2) high TG level (≥
1.7 mmol/L or on drug treatment for elevated triglycerides), (3) low HDL-C level (<1.03
mmol/L in men and <1.29 mmol/L in women or on drug treatment for reduced HDL-C), (4)
high BP (systolic BP ≥ 130 mmHg or diastolic BP ≥ 85 mmHg or under anti-hypertensive
drug treatment in a patient with history of hypertension), and (5) high fasting plasma glucose concentration (≥ 5.6 mmol/L or on drug treatment for elevated glucose).
Statistical analysis:
The data are presented as means and SD(standard deviation) unless indicated otherwise. Student’s t test and analysis of variance (ANOVA) were used to test significant differences for continuous data on contrasting groups. Log transformation was used for variables with
before further analyses. The Chi-square (χ2) test was used to compare the differences in
categorical variables. Binary logistic regression analysis was used to estimate the odds ratios
(ORs) of CVD risk factors for different WC, WC/HC, and WC/H groups. The ROC analysis
was used to compare their predictive validity and to find out their optimal cut-off values. The
area under the ROC curve (AUC) is a measure of the diagnostic power of a test. A perfect test
will have an AUC of 1.0 and an AUC = 0.5 means the test performs no better than chance.
Sensitivity and specificity of the anthropometric measurements have been calculated at all
possible cut-off points to find the optimal cut-off values. The optimal sensitivity and
specificity were the values yielding maximum sums from the ROC curves. Mann-Whitney
test was used to compare the differences of AUCs for at least one CVD risk factor between
WC/H and other three measurements (BMI, WC, WC/HC). All statistical tests were 2-sided at
the 0.05 significance level. These statistical analyses were performed using the PC version of
SPSS statistical software (13th version, SPSS Inc., Chicago, IL, USA).
Reporting of the study conforms to STROBE along with references to STROBE and the
broader EQUATOR guidelines [38]. Ethics approval for patient recruitment and data analysis
was obtained from the Institutional Review Board of the China Medical University Hospital.
Results
Men were older and had greater height, weight, BMI, WC, WC/HC, WC/H, systolic BP,
diastolic BP, fasting glucose, uric acid, TG, and prevalence of hypertension, diabetes, MetS,
and hyperuricemia, and lower HC, fat %, TCHOL, HDL-C, and prevalence of dyslipidemia
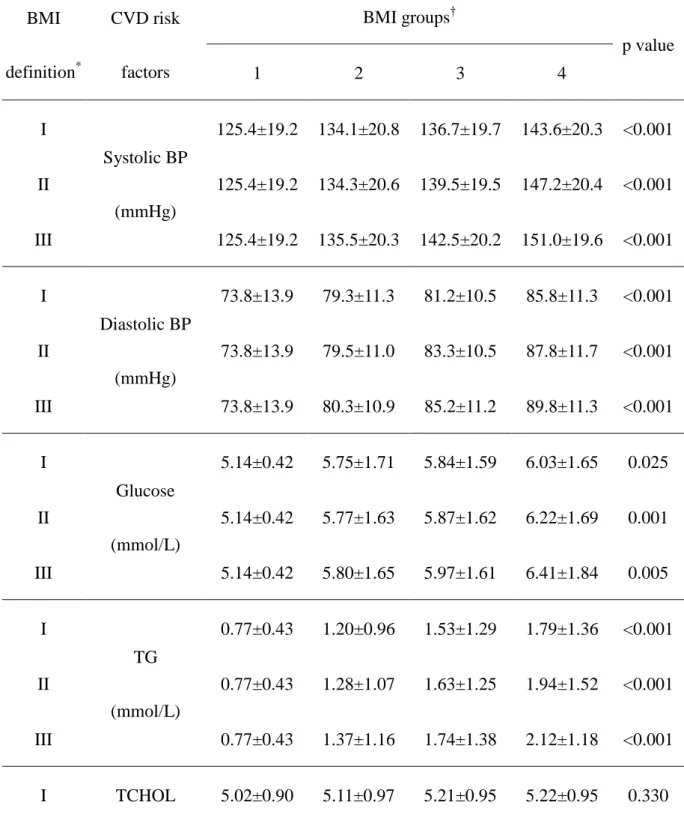
than women (Table 1). Table 2 shows the association between BMI groups and biochemical
markers for the three BMI definitions in men and women. Only the level of TCHOL did not
significantly increase with increasing BMI levels in men. Across different BMI definitions
and WC quartiles (data not shown), the prevalence of CVD risk factors (such as diabetes,
hypertension, MetS, and hyperuricemia) was found to be significantly increased for
increasing BMI levels using all three definitions or WC quartiles in both genders. Higher
quartiles of WC were associated with higher BP, fasting glucose, TG, uric acid, and BMI and
lower HDL-C than lower quartiles of WC (data not shown). Figure 1 shows the ORs of CVD
risk factors in different central obesity groups (WC, WC/HC, and WC/H). Compared to
lowest quartile of WC, WC/HC, and WC/H, the ORs of having CVD risk factors
(hyperglycemia, hypertension, dyslipidemia, hyperuricemia, MetS, and any CVD risk factors)
increased among quartile II, III, and IV in both genders. For comparison, we further divided
BMI into quartiles. The crude ORs for the fourth vs. first quartile of each obesity
measurement showed that WC/H had the strongest relationship with all CVD risk factors in
attenuated. The adjusted ORs for any CVD risk factors in men and women are 9.70(4.03-23.4)
and 6.42(3.09-13.3) in BMI, 10.2(4.28-24.2) and 6.16(2.86-13.3) in WC, 8.85(3.71-21.1) and
4.23(2.08-8.59) in WC/HC, and 13.0(4.58-36.6) and 8.44(3.53-20.2) in WC/H, respectively
(all p value <0.001). WC/H remains the strongest measurement associated with any CVD risk
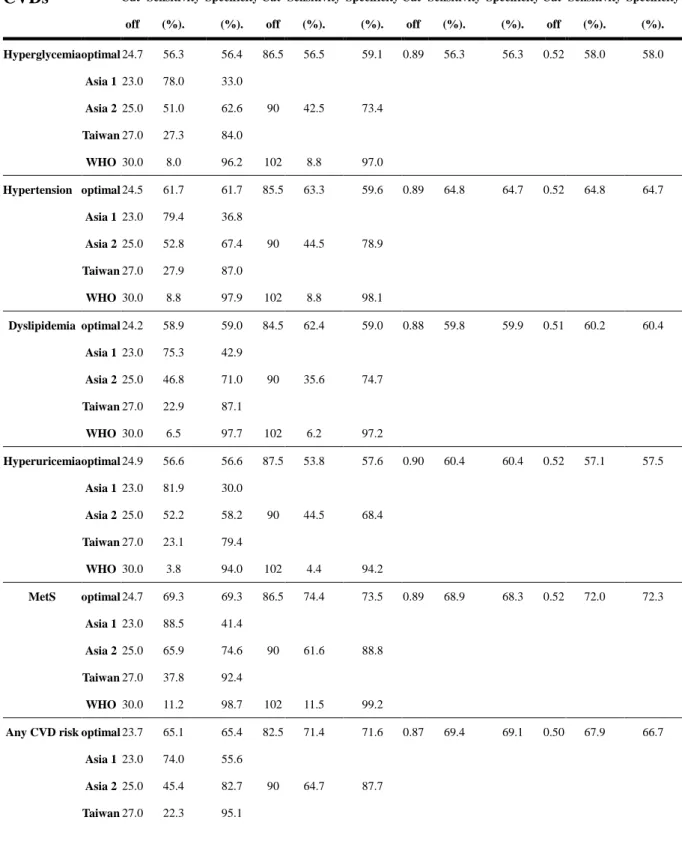
factors in both genders. The cut-off values of various anthropometric indices found optimally
to predict hyperglycemia, hypertension, dyslipidemia, hyperuricemia, MetS, or at least one
CVD risk factor using the ROC analysis in both sexes are summarized in Table 3. The
optimal cut-off values for BMI vary from 23.7 to 24.9 kg/m2 in men and 22.4 to 24.2 kg/m2 in
women. The optimal cut-off values for WC, WC/HC, and WC/H were from 82.5 to 87.5 cm,
0.87 to 0.90, and 0.50 to 0.52 in men and 72.5 to 77.3 cm, 0.79 to 0.81, and 0.46 to 0.50 in
women, respectively. The AUCs of various anthropometric indices and the groups with at
least one CVD risk factor were obtained for BMI (95 % confidence interval)-0.72(0.66-0.77)
in men, 0.72(0.67-0.76) in women; WC-0.75(0.70-0.81) in men, 0.74(0.70-0.79) in women;
WH/HC-0.75(0.69-0.80) in men, 0.70(0.65-0.75) in women; and WC/H-0.76(0.70-0.81) in
men, 0.76(0.72-0.80) in women, respectively. Using Mann-Whitney test, the AUC of WC/H
for at least one CVD risk factor is significantly higher than the AUCs of BMI, WC, or
WH/HC (all p values < 0.001). Again, WC/H is a better indicator for screening overweight- or
obesity-related CVD risk factors than the other three indices (BMI, WC and WC/HC) in both
Discussion
In this study, we have demonstrated that the prevalence of CVD risk factors such as
diabetes, hypertension, dyslipidemia, hyperuricemia, and MetS increased as BMI increased in
middle-aged adult Taiwanese, using three different BMI definitions. Subjects with higher
BMI, WC, WC/HC, and WC/H had higher BP, serum fasting glucose, TG, and uric acid than
those with lower BMI, WC, WC/HC, and WC/H in both genders. The optimal cut-off values
of these anthropometric indices for obesity are different from current suggestions. WC/H may
be a better indicator for screening obesity-related CVD risk factors than the other three
indices (BMI, WC and WC/HC) in middle-aged adult Taiwanese.
Increasing prevalence of obesity is found not only in Europe and the United states, but
also in Asia [1]. For example, in Korea, prevalence of obese (BMI ≥ 25 kg/m2) men and
women has increased from 25.1% and 28.1% in 1998 to 32.4% and 29.4% in 2001 [39]. In
this study, we used a well-designed sampling strategy in a metropolitan city in Taiwan, so that
this cohort could represent the urban people of Taiwan. The Nutrition and Health Survey of
Taiwan during 1993–1996, showed the prevalence of overweight and obesity to be 31.3% and
15.2% in middle-aged men and 28.3% and 24.4% in middle-aged women, using the criteria of
DOH of Taiwan [3]. In our study, also using these criteria, the prevalence of overweight and
obesity was 37.4% and 21.0 % in men and 26.7% and 16.7% in women. Thus in men, the
obesity was found in Japan. The prevalence of obesity (BMI ≥ 25kg/m2) increased from
15.3% in the time-period of 1976–80 to 22.5% during 1991–95 in men, but a slight decrease
occurred in women from 18.0% to 17.0% [40]. This merits further study. The prevalence of
obesity between genders differs among countries or races. In many countries, obesity is more
frequent in women than in men. For example, in the United States, the prevalence of obesity
(BMI ≥ 30 kg/m2) in adult in 1999–2002 was 27.6 % in men and 33.6 % in women [41].
However, in Taiwan, the prevalence of overweight (BMI ≥ 24 kg/m2) in adult males was
higher than in adult females in National Nutritional and Health Survey in Taiwan in
1993-1996 (22.9% vs. 20.3%) [3]. The National Health Research Institute survey in Taiwan
in 2000-2001 also showed similar findings (prevalence of overweight and obese: 28.9 % and
15.9 % in men vs. 18.7 % and 10.7 % in women) [3]. Similarly, in Canadian Heart Health
Surveys in Canada in 1986-1992, the prevalence of overweight (BMI ≥ 25 kg/m2) was 58.1 %
in men and 40.6 % in women [42]. From above findings, the prevalence of overweight or
obesity between genders was quite different among countries or races.
Our results also demonstrate that, using three different BMI definitions for obesity, each is
similarly significantly associated with CVD risk factors, especially for hypertension, high TG,
low HDL-C, and MetS. The same associations are also found using anthropometric indices for
central obesity, such as WC, WC/HC, and WC/H. This reflects that both general obesity
associated with CVD risk factors. This is the first time that obesity (measured by different
anthropometric indices and definitions) is strongly associated with CVD risk factors in
Chinese.
The optimal cut-off values for BMI (23.7 kg/m2 in men and 22.4 kg/m2 in women) and WC
(82.5 in men and 72.5 cm in women) in our study were lower than the definitions proposed by
WHO for Asia-Pacific region (for Asian) [33], the DOH of Taiwan (for Taiwanese) [34], and
WHO (for Caucasians) [1]. These cut-off values, however, were higher than our previous
study done among adult Chinese (aged 20 years and over, the optimal cut-off values for BMI
and WC were 23.6 and 22.1 kg/m2 and 80.5 and 71.5 cm in men and women, respectively)
[43]. The reason for these differences between these two studies may be due to age
differences (mean age: 54.6 years in this study vs. 37.1 years in previous study). Study also
reported that, for a given BMI, Asians have greater body fat accumulation than do Caucasians
[24]. Therefore, our study supports that the cut-off values using BMI and WC to define
overweight/obesity should be much lower in Taiwanese than in Caucasians.
BMI is an indicator of general obesity, reflecting neither abdominal fat nor body fat
distribution. WHO recommends that BMI and WC are simple and practical measures for
identifying overweight and obesity [1]. However, others have proposed that WC/HC or WC/H
are better indicators for predicting CVD. For example, Ho et al reported that the most useful
and WC for men among Hong Kong Chinese [44]. In another Hong Kong Chinese study, Ko
et al found WC/HC and WC/H are better predictors for diabetes, hypertension, and
albuminuria [45]. Similar findings have also been reported in Caucasians. For instance,
Rexrode and Lean found WC and WC/HC to be good predictors for CVD among a population
without previous CVD [46, 47]. Dalton et al also found that WC/HC has the strongest
association with type 2 diabetes, hypertension, and dyslipidemia [48]. WC/HC is found to be
a superior predictor of CVD risk because it includes a measurement of HC, which is less
dependent on body size than is WC [49]. Besides, WC/HC has been demonstrated be
inversely associated with hyperglycemia, hypertension, dyslipidemia and CVD [48, 50, 51].
Although there are some advantages of the WC/HC over other indices, when considering the
accuracy and feasibility of measurement, WC/HC may not be superior to WC, WC/H, or
BMI.
More recently, WC/H has been shown to be another main predictor of CVD risk [52]. Our
results indicate that, in middle-aged adult Taiwanese, the WC/H has the strongest association
with any CVD risk factors and had the largest AUCs in relation to any CVD risk factors in
both genders. This is similar to our previous report in adult Chinese which showed WC/H has
the largest AUCs in relation to at least one CVD risk factor [43]. Tseng et al also found that
WC/H is independently and better associated with urinary albumin excretion rate than WC or
easily measured in clinical settings, so the combination of BMI, WC, and WC/H should be
used for screening overweight- or obesity-related CVD risk factors.
Although we had demonstrated these strong associations between different measurements
of obesity and CVD risk factors in middle-aged adult Chinese, some limitations existed in the
study. First, the cross-sectional design makes an assessment of causality between different
measurements of obesity and CVD risk factors impossible to prove. Further prospective study
is necessary. Secondly, the population is from a metropolitan city in Taiwan, it may not
suitable to be applied in rural area in Taiwan as well as other countries. Third, since a wide
range of 95% confidence interval of ORs for WC/H was found, it limited the application to
claim this index the strongest measure associated with CVD risk.
Conclusion
We demonstrate that both general obesity (defined using different BMI definitions) and
central obesity (defined using WC, WC/HC, and WC/H) are closely related to CVD risk
factors in middle-aged adult Taiwanese. WC/H may be a better indicator for screening
overweight- or obesity-related CVD risk factors than the other three indices (BMI, WC and
WC/HC) in both genders in Taiwan. Regular use of these anthropometric indices should be
Acknowledgements
This study is supported by grants from National Science Council of Taiwan
(NSC93-2314-B-039-025, NSC 94-2314-B-039-024), from Taiwan Department of Health
Clinical Trial and Research Center of Excellence (DOH99-TD-B-111-004), from China
Medical University Hospital (DMR-96-118, DMR-97-149, DMR-98-090, and DMR-99-110),
and from US National Institutes of Health (DK 026687). We also thank all the staff and
subjects who participated in this study.
Disclosure statement
References
1. World Health Organization. Obesity: preventing and managing the global epidemic.
Report of a WHO consultation. WHO Tech Rep Ser 2000;894:1-253.
2. World Health Organization. Obesity and overweight. 2006; Fact sheet
311:http://www.who.int/mediacentre/factsheets/fs311/en/index.html. Accessed at September
07, 2010.
3. Chu NF. Prevalence of obesity in Taiwan. Obes Rev 2005;6:271-4.
4. Flegal KM, Williamson DF, Pamuk ER, Rosenberg HM. Estimating deaths attributable
to obesity in the United States. Am J Public Health 2004;94:1486-9.
5. Flegal KM, Carroll MD, Ogden CL, Johnson CL. Prevalence and trends in obesity
among US adults, 1999-2000. JAMA 2002;288:1723-7.
6. Clinical Guidelines on the Identification, Evaluation, and Treatment of Overweight and
Obesity in Adults--The Evidence Report. National Institutes of Health. Obes Res 1998;6
Suppl 2:51S-209S.
7. Pi-Sunyer FX. A review of long-term studies evaluating the efficacy of weight loss in
ameliorating disorders associated with obesity. Clin Ther 1996;18:1006-35; discussion 5.
8. Seidell JC, Verschuren WM, van Leer EM, Kromhout D. Overweight, underweight, and
mortality. A prospective study of 48,287 men and women. Arch Intern Med 1996;156:958-63.
in Korean men and women. N Engl J Med 2006;355:779-87.
10. Kannel WB, D'Agostino RB, Cobb JL. Effect of weight on cardiovascular disease. Am J
Clin Nutr 1996;63:419S-22S.
11. Wang Y, Rimm EB, Stampfer MJ, Willett WC, Hu FB. Comparison of abdominal
adiposity and overall obesity in predicting risk of type 2 diabetes among men. American
Journal of Clinical Nutrition 2005;81:555-63.
12. Després JP, Lemieux I. Abdominal obesity and metabolic syndrome. Nature
2006;444:881-7.
13. Donahue RP, Abbott RD, Bloom E, Reed DM, Yano K. Central obesity and coronary
heart disease in men. Lancet 1987;1:821-4.
14. Kannel WB, Cupples LA, Ramaswami R, Stokes J 3rd, Kreger BE, Higgins M. Regional
obesity and risk of cardiovascular disease; the Framingham Study. J Clin Epidemiol
1991;44:183-90.
15. Gallagher D, Visser M, Sepulveda D, Pierson RN, Harris T, Heymsfield SB. How useful
is body mass index for comparison of body fatness across age, sex, and ethnic groups? Am J
Epidemiol 1996;143:228-39.
16. Pouliot MC, Després JP, Lemieux S, Moorjani S, Bouchard C, Tremblay A, et al. Waist
circumference and abdominal sagittal diameter: best simple anthropometric indexes of
women. Am J Cardiol 1994;73:460-8.
17. Després JP, Prud'homme D, Pouliot MC, Tremblay A, Bouchard C. Estimation of deep
abdominal adipose-tissue accumulation from simple anthropometric measurements in men.
Am J Clin Nutr 1991;54:471-7.
18. Amos AF, McCarty DJ, Zimmet P. The rising global burden of diabetes and its
complications: estimates and projections to the year 2010. Diabet Med 1997;14 Suppl
5:S1-85.
19. Tan CE, Ma S, Wai D, Chew SK, Tai ES. Can we apply the National Cholesterol
Education Program Adult Treatment Panel definition of the metabolic syndrome to Asians?
Diabetes Care 2004;27:1182-6.
20. Lear SA, Chen MM, Frohlich JJ, Birmingham CL. The relationship between waist
circumference and metabolic risk factors: cohorts of European and Chinese descent.
Metabolism 2002;51:1427-32.
21. Thomas GN, Ho SY, Janus ED, Lam KS, Hedley AJ, Lam TH. The US National
Cholesterol Education Programme Adult Treatment Panel III (NCEP ATP III) prevalence of
the metabolic syndrome in a Chinese population. Diabetes Res Clin Pract 2005;67:251-7.
22. Deurenberg-Yap M, Yian TB, Kai CS, Deurenberg P, van Staveren WA, Yap M.
Manifestation of cardiovascular risk factors at low levels of body mass index and waist-to-hip
23. Hsieh SD, Yoshinaga H, Muto T, Sakurai Y, Kosaka K. Health risks among Japanese
men with moderate body mass index. Int J Obes Relat Metab Disord 2000;24:358-62.
24. Chang CJ, Wu CH, Chang CS, Yao WJ, Yang YC, Wu JS, et al. Low body mass index
but high percent body fat in Taiwanese subjects: implications of obesity cutoffs. Int J Obes
Relat Metab Disord 2003;27:253-9.
25. He M, Tan KC, Li ET, Kung AW. Body fat determination by dual energy X-ray
absorptiometry and its relation to body mass index and waist circumference in Hong Kong
Chinese. Int J Obes Relat Metab Disord 2001;25:748-52.
26. Deurenberg-Yap M, Schmidt G, van Staveren WA, Deurenberg P. The paradox of low
body mass index and high body fat percentage among Chinese, Malays and Indians in
Singapore. Int J Obes Relat Metab Disord 2000;24:1011-7.
27. Huang KC, Lin WY, Lee LT, Chen CY, Lo H, Hsia HH, et al. Four anthropometric
indices and cardiovascular risk factors in Taiwan. Int J Obes Relat Metab Disord
2002;26:1060-8.
28. Lin WY, Lai MM, Li CI, Lin CC, Li TC, Chen CC, et al. In addition to insulin resistance
and obesity, brachial-ankle pulse wave velocity is strongly associated with metabolic
syndrome in Chinese--a population-based study (Taichung Community Health Study, TCHS).
J Atheroscler Thromb 2009;16:105-12.
Taiwanese metropolitan adult population. BMC Public Health 2007;7:239-44.
30. Lin CC, Liu CS, Li TC, Chen CC, Li CI, Lin WY. Microalbuminuria and the metabolic
syndrome and its components in the Chinese population. Eur J Clin Invest 2007;37:783-90.
31. Lin WY, Liu CS, Li TC, Lin T, Chen W, Chen CC, et al. In addition to insulin resistance
and obesity, hyperuricemia is strongly associated with metabolic syndrome using different
definitions in Chinese populations: a population-based study (Taichung Community Health
Study). Ann Rheum Dis 2008;67:432-3.
32. Chang PC, Li TC, Wu MT, Liu CS, Li CI, Chen CC, et al. Association between
television viewing and the risk of metabolic syndrome in a community-based population.
BMC Public Health 2008;8:193-202.
33. World Health Organization. International Association for the study of Obesity,
International Obesity Task Force. The Asia-Pacific perspective: redefining obesity and its
treatment. Sydney: Health Communications, 2000; http://www.iotf.org/asiapacific/. Accessed
at September 07, 2010.
34. Department of Health of The Executive Yuan. Definition of Obesity and overweight.
Taipei, Taiwan:Taiwan Government 2002.
35. Chobanian AV, Bakris GL, Black HR, Cushman WC, Green LA, Izzo JL, Jr., et al. The
Seventh Report of the Joint National Committee on Prevention, Detection, Evaluation, and
36. Diagnosis and classification of diabetes mellitus. Diabetes Care 2006;29 Suppl 1:S43-8.
37. Grundy SM, Cleeman JI, Daniels SR, Donato KA, Eckel RH, Franklin BA, et al.
Diagnosis and Management of the Metabolic Syndrome: An American Heart
Association/National Heart, Lung, and Blood Institute Scientific Statement. Circulation
2005;112:2735-52.
38. Simera I, Moher D, Hoey J, Schulz KF, Altman DG. A catalogue of reporting guidelines
for health research. Eur J Clin Invest 2010;40:35-53.
39. Kim DM, Ahn CW, Nam SY. Prevalence of obesity in Korea. Obes Rev 2005;6:117-21.
40. Yoshiike N, Seino F, Tajima S, Arai Y, Kawano M, Furuhata T, et al. Twenty-year
changes in the prevalence of overweight in Japanese adults: the National Nutrition Survey
1976-95. Obes Rev 2002;3:183-90.
41. Baskin ML, Ard J, Franklin F, Allison DB. Prevalence of obesity in the United States.
Obes Rev 2005;6:5-7.
42. Canadian Institute for Health Information. Overweight and obesity in Canada - A
Population Health Perspective. 2004:www.cihi.ca. Accessed at September 07, 2010.
43. Lin WY, Lee LT, Chen CY, Lo H, Hsia HH, Liu IL, et al. Optimal cut-off values for
obesity: using simple anthropometric indices to predict cardiovascular risk factors in Taiwan.
Int J Obes Relat Metab Disord 2002;26:1232-8.
anthropometric indices and cardiovascular risk factors. Int J Obes Relat Metab Disord
2001;25:1689-97.
45. Ko GT, Chan JC, Cockram CS, Woo J. Prediction of hypertension, diabetes,
dyslipidaemia or albuminuria using simple anthropometric indexes in Hong Kong Chinese.
Int J Obes Relat Metab Disord 1999;23:1136-42.
46. Lean ME, Han TS, Morrison CE. Waist circumference as a measure for indicating need
for weight management. BMJ 1995;311:158-61.
47. Rexrode KM, Carey VJ, Hennekens CH, Walters EE, Colditz GA, Stampfer MJ, et al.
Abdominal adiposity and coronary heart disease in women. JAMA 1998;280:1843-8.
48. Dalton M, Cameron AJ, Zimmet PZ, Shaw JE, Jolley D, Dunstan DW, et al. Waist
circumference, waist-hip ratio and body mass index and their correlation with cardiovascular
disease risk factors in Australian adults. J Intern Med 2003;254:555-63.
49. Lapidus L, Bengtsson C, Larsson B, Pennert K, Rybo E, Sjöström L. Distribution of
adipose tissue and risk of cardiovascular disease and death: a 12 year follow up of participants
in the population study of women in Gothenburg, Sweden. Br Med J (Clin Res Ed)
1984;289:1257-61.
50. Seidell JC, Perusse L, Després JP, Bouchard C. Waist and hip circumferences have
independent and opposite effects on cardiovascular disease risk factors: the Quebec Family
51. Heitmann BL, Frederiksen P, Lissner L. Hip circumference and cardiovascular morbidity
and mortality in men and women. Obes Res 2004;12:482-7.
52. Ashwell M, Lejeune S, McPherson K. Ratio of waist circumference to height may be
better indicator of need for weight management. BMJ 1996;312:377.
53. Tseng CH. Waist-to-height ratio is independently and better associated with urinary
albumin excretion rate than waist circumference or waist-to-hip ratio in Chinese adult type 2
Table 1. Anthropometric indices and metabolic factors between genders
Men (n=1147) Women (n=1212) p value
Age (years)† 58.6 ±12.3(40-94) 55.2 ±10.6(40-92) <0.001 Height (cm)† 166.4 ±6.2(137-192) 155.3 ±5.4 (134-171) <0.001 Weight (kg)† 68.7 ±10.3(39.9-116) 57.6 ±8.6(27.6-100.8) <0.001 BMI (kg/m2)† 24.8 ±3.2(16.0-38.8) 23.9 ±2.4(12.4-41.4) <0.001 WC (cm)† 86.4 ±8.7(51-120) 76.7 ±8.9(35-115) <0.001 HC (cm)† 94.2 ±6.2(63-130.5) 94.7 ±5.6(73-130) <0.001 WC/HC† 0.89 ±0.57(0.61-1.29) 0.81 ±0.60(0.45-1.13) <0.001 WC/H* 0.52 ±0.05(0.31-0.71) 0.49 ±0.06(0.22-0.75) <0.001 Fat (%)† 26.0 ±5.6(9.7-50.6) 36.1 ±6.2(3.4-55.9) <0.001 BMI > 23kg/m2 (%)‡ 71.8 55.2 <0.001 BMI > 24kg/m2 (%)‡ 58.4 43.4 <0.001 BMI > 25kg/m2 (%)‡ 43.3 31.8 <0.001 BMI > 27kg/m2 (%)‡ 21.0 16.7 0.008 BMI > 30kg/m2 (%)‡ 5.7 5.3 0.717 Central obesity (%)‡,1 33.7 33.4 0.930 Systolic BP (mmHg)† 138.9 ±20.7(91-219) 132.7 ±22.7(89-231) <0.001 Diastolic BP (mmHg)† 82.6 ±11.5(54-135) 75.5 ±12.3(43-130) <0.001
Fasting glucose (mmol/L)† 5.89 ±1.64(3.77-21.6) 5.60 ±1.50(3.77-18.7) <0.001
Uric acid (μmol/L)† 379.7 ±127.0(107-3628 300.4 ±66.9(125-654) <0.001 TCHOL (mmol/L)† 5.19 ±0.95(2.25-9.52) 5.32 ±0.99(2.69-8.84) 0.001 TG (mmol/L)† 1.54 ±1.26(0.27-16.0) 1.21 ±0.80(0.24-11.1) <0.001 HDL-C (mmol/L)† 1.07 ±0.28(0.51-2.91) 1.30 ±0.33(0.53-2.72) <0.001 TCHOL/HDL-C† 5.06 ±1.30(1.8-13.1) 4.29 ±1.08(1.8-8.4) 0.420 Hypertension (%)‡,2 53.8 38.4 <0.001 Diabetes (%)‡,3 14.1 10.3 0.005 Dyslipidemia (%)‡,4 81.1 84.7 0.022 MetS (%)‡,5 44.6 35.2 <0.001 Hyperuricemia (%)‡,6 15.9 10.5 <0.001
Present with mean ± SD (range) in continuous variables and percentage in categorical
variables; presented in SI units
*
Student's t-test for unpaired data was used for the comparison of mean values between
groups
†
Statistics were tested using the log-transformed values
‡
Pearson Chi-Square test for categorical data
Abbreviation: BMI: body mass index, WC: waist circumference, HC: hip circumference,
total cholesterol, TG: triglycerides, HDL-C: high-density-lipoprotein cholesterol,
1 Central obesity is defined as waist circumference ≥ 90 cm in men, and/or ≥ 80 cm in women.
2Hypertension was defined as systolic BP ≥ 140 mmHg, and/or diastolic BP ≥ 90 mmHg,
and/or hypertension history and on anti-hypertensive drug treatment
3Diabetes was defined as fasting glucose ≥ 7mmol/L and/or diabetes history and on oral
hypoglycemic agents or insulin treatment
4Dyspilidemia defined as subjects with high TG (triglycerides ≥ 1.7 mmol/L) and/or high
TCHOL (total cholesterol ≥ 5.17 mmol/L) and/or low HDL-C (HDL-C< 1.03 mmol/L in men
or <1.29 mmol/L in women)
5MetS: metabolic syndrome was defined by the American Heart Association/National Heart,
Lung, and Blood Institute criteria
6Hyperuricemia was defined as serum uric acid ≥ 446.1 μmol/L in men or ≥ 386.6 μmol/L in
Table 2. The relationship between BMI groups and cardiovascular disease (CVD) risk factors
in different BMI definition in men (n=1147, Table 2a) and in women (n=1212, Table 2b).
(2a) in men BMI definition* CVD risk factors BMI groups† p value 1 2 3 4 I Systolic BP (mmHg) 125.4±19.2 134.1±20.8 136.7±19.7 143.6±20.3 <0.001 II 125.4±19.2 134.3±20.6 139.5±19.5 147.2±20.4 <0.001 III 125.4±19.2 135.5±20.3 142.5±20.2 151.0±19.6 <0.001 I Diastolic BP (mmHg) 73.8±13.9 79.3±11.3 81.2±10.5 85.8±11.3 <0.001 II 73.8±13.9 79.5±11.0 83.3±10.5 87.8±11.7 <0.001 III 73.8±13.9 80.3±10.9 85.2±11.2 89.8±11.3 <0.001 I Glucose (mmol/L) 5.14±0.42 5.75±1.71 5.84±1.59 6.03±1.65 0.025 II 5.14±0.42 5.77±1.63 5.87±1.62 6.22±1.69 0.001 III 5.14±0.42 5.80±1.65 5.97±1.61 6.41±1.84 0.005 I TG (mmol/L) 0.77±0.43 1.20±0.96 1.53±1.29 1.79±1.36 <0.001 II 0.77±0.43 1.28±1.07 1.63±1.25 1.94±1.52 <0.001 III 0.77±0.43 1.37±1.16 1.74±1.38 2.12±1.18 <0.001 I TCHOL 5.02±0.90 5.11±0.97 5.21±0.95 5.22±0.95 0.330
II (mmol/l) 5.02±0.90 5.14±0.97 5.24±0.91 5.18±0.99 0.369 III 5.02±0.90 5.16±0.96 5.21±0.96 5.30±0.89 0.567 I HDL-C (mmol/L) 1.50±0.37 1.18±0.33 1.05±0.24 1.01±0.24 <0.001 II 1.50±0.37 1.14±0.30 1.04±0.25 0.97±0.21 <0.001 III 1.50±0.37 1.11±0.29 1.02±0.25 0.95±0.21 <0.001 I Uric acid (mmol/L) 339.0±74.9 355.0±77.6 380.5±82.3 395.9±168.1 <0.001 II 339.0±74.9 361.0±78.4 396.4±178.0 388.6±84.0 <0.001 III 339.0±74.9 368.1±81.0 396.9±176.8 388.9±89.5 0.002 I Waist circumference (cm) 66.1±5.8 78.7±5.7 84.6±4.7 92.8±6.9 <0.001 II 66.1±5.8 80.4±5.9 87.8±5.1 96.5±6.9 <0.001 III 66.1±5.8 81.8±6.0 91.4±5.5 102.8±7.0 <0.001 (2b) in women BMI definition* CVD risk factors BMI groups† p value 1 2 3 4 I Systolic BP (mmHg) 130.0±29.1 124.3±19.7 133.8±22.0 143.2±22.2 <0.001 II 130.0±29.1 126.2±20.4 137.4±22.0 146.4±22.3 <0.001 III 130.0±29.1 127.7±21.0 140.5±20.8 157.1±23.6 <0.001 I Diastolic BP 69.3±13.8 71.6±11.2 75.6±11.9 81.1±11.8 <0.001
II (mmHg) 69.3±13.8 72.5±11.5 77.9±11.9 82.3±11.8 <0.001 III 69.3±13.8 73.0±11.6 80.0±11.3 86.5±13.1 <0.001 I Glucose (mmol/L) 5.24±0.76 5.31±1.09 5.81±1.74 5.86±1.73 <0.001 II 5.24±0.76 5.42±1.32 5.79±1.61 5.93±1.83 <0.001 III 5.24±0.76 5.49±1.38 5.82±1.74 6.07±1.69 <0.001 I TG (mmol/L) 0.88±0.51 1.00±0.62 1.30±0.94 1.44±0.82 <0.001 II 0.88±0.51 1.06±0.75 1.36±0.74 1.50±0.93 <0.001 III 0.88±0.51 1.11±0.77 1.41±0.82 1.60±0.83 <0.001 I TCHOL (mmol/L) 5.00±1.10 5.19±0.99 5.39±0.98 5.48±0.96 <0.001 II 5.00±1.10 5.23±0.99 5.50±1.01 5.39±0.89 <0.001 III 5.00±1.10 5.26±0.99 5.50±0.98 5.38±0.88 0.001 I HDL-C (mmol/L) 1.51±0.44 1.36±0.34 1.28±0.32 1.21±0.28 <0.001 II 1.51±0.44 1.35±0.34 1.26±0.31 1.18±0.26 <0.001 III 1.51±0.44 1.33±0.34 1.22±0.28 1.17±0.26 <0.001 I Uric acid (mmol/L) 270.7±58.5 282.2±60.7 305.3±65.2 323.3±69.0 <0.001 II 270.7±58.5 285.1±62.3 314.9±63.5 331.0±71.9 <0.001 III 270.7±58.5 290.4±63.3 319.1±67.3 344.3±74.0 <0.001 I Waist 63.6±8.0 70.9±5.1 76.8±5.0 85.3±7.7 <0.001
II circumference
(cm)
63.6±8.0 72.0±5.5 80.0±5.8 88.3±8.0 <0.001
III 63.6±8.0 73.0±5.8 83.3±6.0 95.0±8.0 <0.001
Present with mean ± SD
*
BMI was defined as follows: I: using WHO for Asia-Pacific region; II: using Taiwan criteria;
III: using WHO criteria;
†
BMI groups: Group 1: underweight; group 2: normoweight; group 3: overweight; group 4:
obesity, detailed description in the text;
Table 3. The optimal cut-off values, sensitivities and specificities for various anthropometric
indices predictive of CVD risk factors in both genders*. (a) in men; (b) in women.
(3a) in men CVDs BMI WC WC/HC WC/H Cut- off Sensitivity (%). Specificity (%). Cut- off Sensitivity (%). Specificity (%). Cut- off Sensitivity (%). Specificity (%). Cut- off Sensitivity (%). Specificity (%). Hyperglycemia optimal 24.7 56.3 56.4 86.5 56.5 59.1 0.89 56.3 56.3 0.52 58.0 58.0 Asia 1 23.0 78.0 33.0 Asia 2 25.0 51.0 62.6 90 42.5 73.4 Taiwan 27.0 27.3 84.0 WHO 30.0 8.0 96.2 102 8.8 97.0 Hypertension optimal 24.5 61.7 61.7 85.5 63.3 59.6 0.89 64.8 64.7 0.52 64.8 64.7 Asia 1 23.0 79.4 36.8 Asia 2 25.0 52.8 67.4 90 44.5 78.9 Taiwan 27.0 27.9 87.0 WHO 30.0 8.8 97.9 102 8.8 98.1 Dyslipidemia optimal 24.2 58.9 59.0 84.5 62.4 59.0 0.88 59.8 59.9 0.51 60.2 60.4 Asia 1 23.0 75.3 42.9 Asia 2 25.0 46.8 71.0 90 35.6 74.7 Taiwan 27.0 22.9 87.1 WHO 30.0 6.5 97.7 102 6.2 97.2 Hyperuricemia optimal 24.9 56.6 56.6 87.5 53.8 57.6 0.90 60.4 60.4 0.52 57.1 57.5 Asia 1 23.0 81.9 30.0 Asia 2 25.0 52.2 58.2 90 44.5 68.4 Taiwan 27.0 23.1 79.4 WHO 30.0 3.8 94.0 102 4.4 94.2 MetS optimal 24.7 69.3 69.3 86.5 74.4 73.5 0.89 68.9 68.3 0.52 72.0 72.3 Asia 1 23.0 88.5 41.4 Asia 2 25.0 65.9 74.6 90 61.6 88.8 Taiwan 27.0 37.8 92.4 WHO 30.0 11.2 98.7 102 11.5 99.2
Any CVD risk optimal 23.7 65.1 65.4 82.5 71.4 71.6 0.87 69.4 69.1 0.50 67.9 66.7
Asia 1 23.0 74.0 55.6
WHO 30.0 6.0 98.8 102 5.9 98.2 (3b) in women CVDs BMI WC WC/HC WC/H Cut- off Sensitivity (%). Specificity (%). Cut- off Sensitivity (%). Specificity (%). Cut- off Sensitivity (%). Specificity (%). Cut- off Sensitivity (%). Specificity (%). Hyperglycemia optimal 23.8 60.6 60.7 76.5 63.3 61.8 0.81 60.9 61.0 0.50 63.3 63.1 Asia 1 23.0 69.0 50.8 Asia 2 25.0 41.0 72.3 80 49.3 73.7 Taiwan 27.0 21.3 85.4 WHO 30.0 8.6 96.2 88 18.3 92.5 Hypertension optimal 23.8 66.2 66.2 76.5 68.0 67.8 0.81 63.4 63.4 0.49 68.0 68.1 Asia 1 23.0 73.8 56.3 Asia 2 25.0 48.8 78.8 80 52.3 78.4 Taiwan 27.0 28.4 90.6 WHO 30.0 10.8 98.1 88 20.9 95.4 Dyslipidemia optimal 22.8 61.6 61.8 73.5 63.8 64.5 0.79 59.4 59.7 0.47 63.0 62.9 Asia 1 23.0 59.0 65.6 Asia 2 25.0 34.3 82.3 80 35.8 80.1 Taiwan 27.0 18.0 90.3 WHO 30.0 5.6 96.2 88 11.3 91.9 Hyperuricemia optimal 24.2 60.6 60.8 77.3 59.1 60.1 0.81 60.6 60.7 0.50 60.6 60.6 Asia 1 23.0 73.2 46.9 Asia 2 25.0 48.0 70.1 80 51.2 68.7 Taiwan 27.0 28.3 84.7 WHO 30.0 11.0 95.4 88 25.2 90.9 MetS optimal 24.0 71.6 71.6 77.3 77.0 77.2 0.81 68.8 68.9 0.50 76.3 76.3 Asia 1 23.0 81.7 59.1 Asia 2 25.0 58.2 82.5 80 68.1 85.5 Taiwan 27.0 33.8 92.6 WHO 30.0 11.7 98.2 88 25.1 96.9
Any CVD risk optimal 22.4 65.8 65.8 72.5 68.2 72.6 0.79 65.3 65.0 0.46 71.2 71.8
Asia 1 23.0 58.8 77.8
Asia 2 25.0 34.1 89.7 80 35.7 88.9
Definition, abbreviations, and description as table 1, 2
*
: Asia 1: overweight using BMI definition from the WHO for Asia-Pacific region
*
: Asia 2: obesity using BMI definition from the WHO for Asia-Pacific region
*
: Taiwan: obesity using BMI definition from the Department of Health (DOH) of Taiwan
*
Legend to the figures:
Figure 1. Different waist circumference (WC), waist-to-hip ratio (WC/HC), and
waist-to-height ratio (WC/H) groups versus cardiovascular disease risk factors
(hyperglycemia, hypertension, dyslipidemia, hyperuricemia, metabolic syndrome, and any
cardiovascular disease (CVD) risk factor) among genders. WC groups are defined by quartile
(1: ≤ 80.5, 2: 81.0~86.5, 3: 87.0~91.5, 4: ≥ 92.0 cm for men and 1: ≤ 70.0, 2: 70.5~75.0, 3: 75.5~81.5, 4: ≥82.0 cm for women). WC/HC groups are defined by quartile (1: ≤ 0.86, 2: 0.86~0.89, 3: 0.89~0.93, 4: ≥ 0.93 for men and 1: ≤ 0.77, 2: 0.77~0.80, 3: 0.80~0.84, 4: ≥ 0.84 cm for women). WC/H groups are defined by quartile (1: ≤ 0.49, 2: 0.49~0.52, 3: 0.52~0.55, 4: ≥ 0.55 cm for men and 1: ≤ 0.45, 2: 0.45~0.49, 3: 0.49~0.53, 4: ≥0.53 for women). Any CVD risk factor is defined as subjects who met any of the follows:
hyperglycemia, hypertension, dyslipisemia, and hyperuricemia. Reference group is quartile I
Figure (1a)
Figure (1b)