Health Examination Utilization in the Visually Disabled Population in Taiwan, a Nationwide Population-based Study
Yueh-Han Hsu1,2,3, Wen-Chen Tsai1,#,Pei-Tseng Kung4,#,*
1 Department of Health Services Administration, China Medical University, Taichung 40402, Taiwan, R.O.C.
2 Department of Internal Medicine, Ditmanson Medical Foundation Chia-Yi Christian Hospital, Chia-Yi 60002, Taiwan, R.O.C.
3 Department of Nursing, Min-Hwei College of Health Care Management, Tainan, 73658, Taiwan, R.O.C.
4 Department of Healthcare Administration, Asia University, Taichung 41354, Taiwan, R.O.C.
Yueh-Han Hsu: [email protected] Wen-Chen Tsai: wtsai@ mail.cmu.edu.tw Pei-Tseng Kung: [email protected]
#Authors who contributed equally to this work.
*Corresponding author: Pei-Tseng Kung, ScD, Department of Healthcare Administration, Asia University, No. 500 Lioufeng Road, Wufeng, Taichung, Taiwan 41354, R.O.C.
Tel: + 886 4 22073070; Fax:+ 886 4 22028895
Abstract
worse inequity to preventive health examinations. To date, only a few nationwide studies have analyzed the utilization of preventive adult health examinations by the visually disabled population. The aim of this study was to investigate the utilization of health examinations by the visually disabled population, and analyze the factors associated with the utilization.
Methods: Visual disability was certified by ophthalmologists and authenticated by
the Ministry of the Interior (MOI), Taiwan. We linked data from three different nationwide datasets (from the MOI, Bureau of Health Promotion, and National Health Research Institutes) between 2006 and 2008 as the data sources. Independent
variables included demographic characteristics, income status, health status, and severity of disability; health examination utilization status was the dependent variable. The chi-squaretest was used to check statistical differences between variables, and a multivariate logistic regression model was used to examine the associated factors with health examination utilization.
Results: In total, 47,812 visually disabled subjects aged 40 years and over were
included in this study, only 16.6% of whom received a health examination. Lower utilization was more likely in male subjects, in those aged 65 years and above, insured dependents and those with a top-ranked premium-based salary, catastrophic
disabilities.
Conclusion: The overall health examination utilization in the visually disabled
population was very low. Lower utilization occurred mainly in males, the elderly, and those with severe disabilities.
Key Words: Disability; Visual impairment; Health examination utilization; Health
Background
People with disabilities have distinct healthcare needs, and they tend to experience chronic health problems earlier than the general population [1]. The prevalence of chronic disease is two to three times higher in people with disabilities [2], and the risk of co-morbidities such as cardiovascular disease and stroke is also increased [1, 3]. However, previous research has demonstrated that the health service needs of people with disabilities are not currently being met [4-6]. The visually disabled population, as with individuals with other disabilities, have less access to appropriate healthcare services [1, 7] and are less likely to receive screening examinations [8]. They face enormous barriers in accessing proper preventive healthcare, including informational barriers, lack of services, lack of transport, inadequate resources or financial
considerations, lack of social awareness, and lack of education and training of healthcare providers [9-11]. In terms of equity, we hypothesized that the visually disabled are being doubly marginalized.
Visual impairment is one of the major causes of disability in the United States and in Taiwan [12, 13]. It has been estimated that the prevalence of visual disabilities will increase markedly during the next several decades, with an estimated 70% increase in blindness and low vision by 2020 [14]. Vision loss contributes significantly to falls, fractures and restrictions in mobility [15], and to increased hospital length of stay and
post-discharge requirements for rehabilitative care [16]. Severe bilateral visual impairments are associated with an increased risk of all-cause mortality and cardiovascular disease-related mortality [17], and are regarded as an independent predictor of mortality [17, 18].
Preventive health examinations are an important health promotion strategy [19-22]. They can help to identify diseases at an early stage, postpone the development of subsequent adverse outcomes, and significantly save healthcare resources and lives [19]. Recent research from the United States suggests that greater use of clinical preventive services can save more than two million life-years annually [20]. In Japan, Hozawa et al. reported that mortality rates are at least 26% lower among those
undergoing health check-ups than those who do not [21]. In Taiwan, Deng et al. reported that for hypertension patients who attended a health examination program, over NT$34,570 in healthcare costs were saved, and life-spans were increased by 128 days [22].
Equity of access to health care is an important factor in priority setting of a health care system [23, 24]. Inequity in access to preventive health services has been shown to be closely related to differences in age, family income, gender, race/ethnicity, urban/rural residence, severity of disability, and education level [25-29].
in March 1995 to provide compulsory universal health care coverage including medical care services and preventive health services. To date, the NHI enrolls over 99.9% of the Taiwanese population [30] and has contracts with over 92% of all medical providers [31]. Since the launch of the NHI, investigations have reported there to be significant improvements in terms of equity of access to health care, greater financial risk protection, and the geographical distributions of physicians [32-35].
The overall utilization rate of adult health examinations in Taiwan has been reported to be 33.3% to 40.72% [36, 37] , and 46.8% in the elderly [19]. For the whole
disabled population, the utilization rate has been reported to be 15.8% [13]. Although the utilization rate in the disabled population is much lower, disabilities are usually not factored into most studies on equity. To reduce the barriers to preventive health services and encourage health checks for the visually disabled population, it is necessary to obtain evidence from large-scale investigations regarding the associated factors of utilization of the preventive health services. Accordingly, the aim of this study was to examine the factors related to the utilization of health examinations by the visually disabled population. Identifying the barriers that prevent visually disabled people from participating in health examinations may help the authorities to conceive feasible strategies for this marginalized population.
Methods
Preventive health services in Taiwan
To promote the health of all people in Taiwan, the government has provided free preventive health services since 1995. These services are provided free (only a registration fee is required) to: (1) those aged 40-64 years once every three years; (2) those aged 65 years and over once a year; and (3) those with poliomyelitis aged 35 and over once a year. A registration fee of up to US$3 may be required for people with no disabilities, although this is waived for people with disabilities. The health examination includes a physical examination, health education guidance, blood tests, and urinalysis.
Study population
This study focused on adults aged over 40 years with visual disabilities. Visual disability, like all other formally issued disabilities in Taiwan, was authenticated via a strict administrative process. Patients with poor vision were examined and certified at ophthalmology clinics, and then approved by the Ministry of the Interior (MOI), Taiwan.
Data sources
Three different nationwide datasets were used including the Disability Registration from the MOI 2008 (with access to demographic characteristics and severity of disabilities), the Health Insurance Medical Claims from the National Health Research
Institutes 2008 (with access to income status and health status), and the Health Prevention Services File from the Bureau of Health Promotion from 2006 to 2008 (with access to health examination utilization status). This study has been approved by the research ethics committee in China Medical University and Hospital (IRB No. CMU-REC-101-012).
Relevant variables
The demographic characteristics including gender, age, education level, marital status, aboriginal status (yes vs. no), and level of urbanization of residential area (district or township) were recorded. The definition of level of urbanization was designed by Liu et al. [38] and has been broadly utilized in relevant research. Urbanization was
classified into 8 levels for all residential townships in Taiwan, with level 1 being the most urbanized areas and level 8 being the least urbanized areas. The severity of disability was classified as mild, moderate, severe and very severe.
Income status included a low-income household status (yes vs. no) and levels of premium-based monthly salary (PBMS). The low-income household status was defined as a household per capita income of below the minimum cost of living for that residential area. The levels of PBMS were the monthly income levels reported to the Bureau of National Health Insurance as the basis for insurance premium collection and are often used as the index for personal income. Those who are members of a
family but without employment are enrolled as insured dependents in the National Health Insurance program.
Health status included catastrophic illness/injury (yes vs. no) and the presence of relevant chronic illnesses (including cancer, endocrine and metabolic diseases, mental disorders, diseases of the nervous system, diseases of the circulatory system, diseases of the respiratory system, diseases of the digestive system, diseases of the
genitourinary system, diseases of the musculoskeletal system and connective tissue, disorders of the eye and adnexa, infectious diseases, congenital anomalies, diseases of the skin and subcutaneous tissue, diseases of the blood and blood-forming organs, and diseases of the ear and mastoid process). Whether or not each subject had utilized a health examination was also recorded (yes vs. no).
Statistical analysis
The chi-squaretest was used for descriptive analysis of the variables, with a p value of less than 0.05 being considered statistically significant. Multivariate logistic
regression analysis was subsequently used to examine the influencing factors on the utilization of health examinations. The independent variables included demographic characteristics, income status, health status, and severity of disability, and the use of health examinations (yes vs. no) was the dependent variable.
All analyses were performed using SAS statistical software (version 9.1 for Windows; SAS Institute, Inc., Cary, NC, USA).
Results
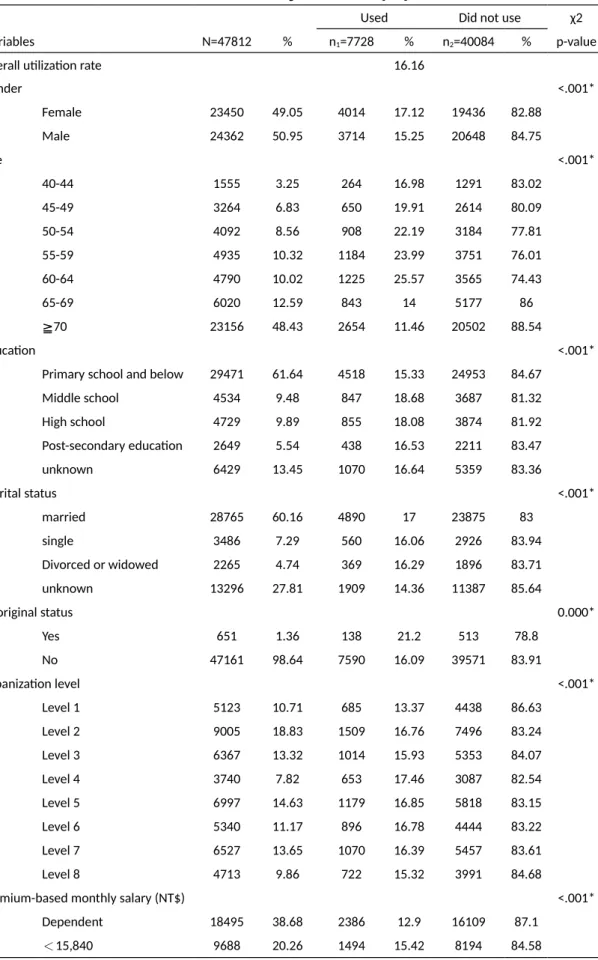
In total, 47,812 (23,450 female, 49.05%; 24,362 male, 50.95%) visually disabled people were enrolled. The overall health examination utilization rate was 16.16% (females 17.12% vs. males 15.25%, p < 0.001), while the benchmark data for the general population during the study period was 33.3% to 40.72% [36, 37]. In terms of age, over 70% of the cohort was over 60 years of age (Table 1). With regards to urbanization level, less visually disabled people lived in Level 4 and Level 8 areas (< 10%). Those who lived in Level 1 areas had a relatively lower utilization rate. In terms of PBMS, most subjects were in the insured dependent group (38.68%), followed by those with a PBMS of 16500-22800 (29.96%) and < 15840 (20.26%) New Taiwan dollars (NTD), respectively. These three subgroups constituted 88.9% of the whole population, showing that the majority of the cohort either had limited income or were unemployed. The insured dependent subgroup and the subgroup with the highest PBMS (PBMS NTD 48200-57800) reported lower utilization rates (around 13%) than the overall utilization rate (Table 1).
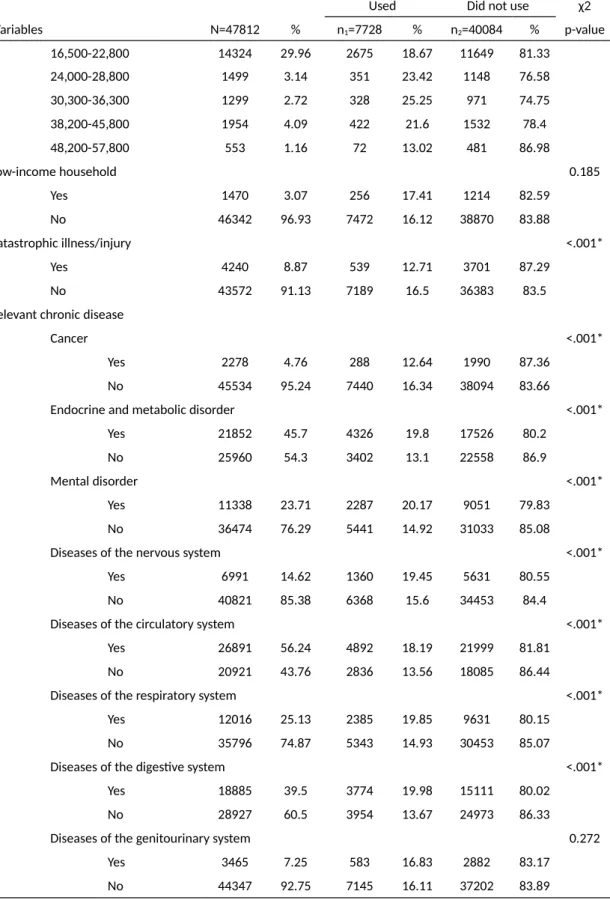
Around three percent (3.07%) of the population were classified as belonging to low-income households, however the health examination utilization rate in this subgroup was higher than for those who were not classified as being in low income households (17.41% versus 16.12%). With regards to aboriginal status, 1.36% of
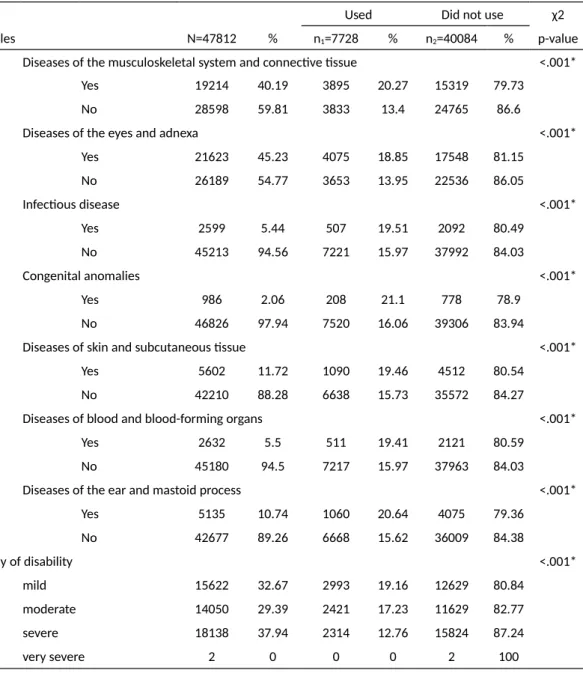
the population was classified as being aborigines, and this group had a higher utilization rate than non-aboriginal people. In terms of education level, 61.64% of the population had a level of primary school or below and they had a significantly lower utilization rate. In terms of marital status, most of the population was married (60.16%), and this subgroup had a higher utilization rate than the other subgroups. Those who had any catastrophic illness/injury (8.87%) had a significantly lower utilization rate (12.71%). Similarly, those who suffered from cancer also had a significantly lower utilization rate (12.64%). Those with chronic diseases had a higher utilization rate than those without chronic diseases (Table 1). In terms of disability severity, those with severe and very severe disabilities had significantly lower utilization rates.
Factors associated with the utilization of preventive health services
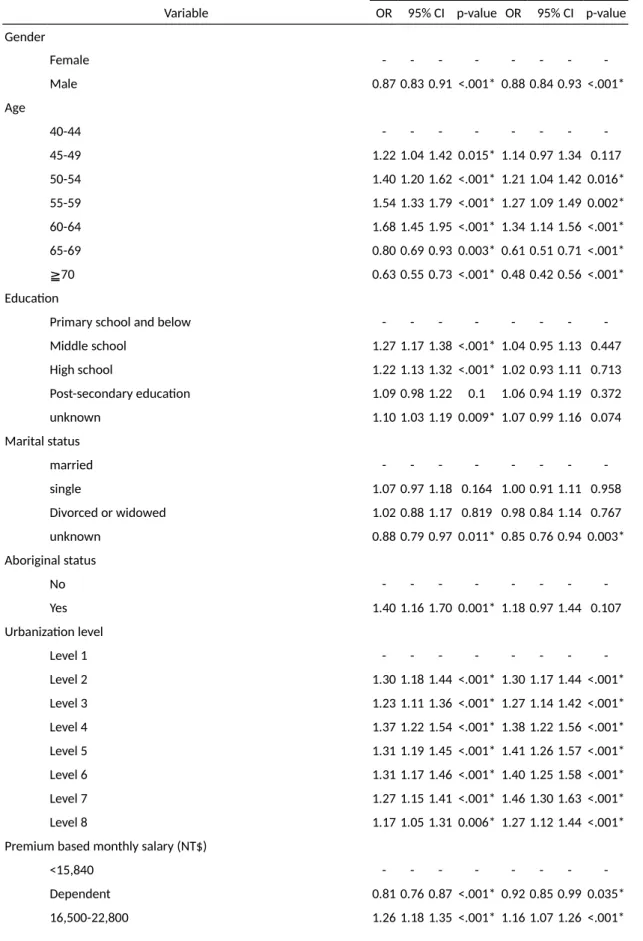
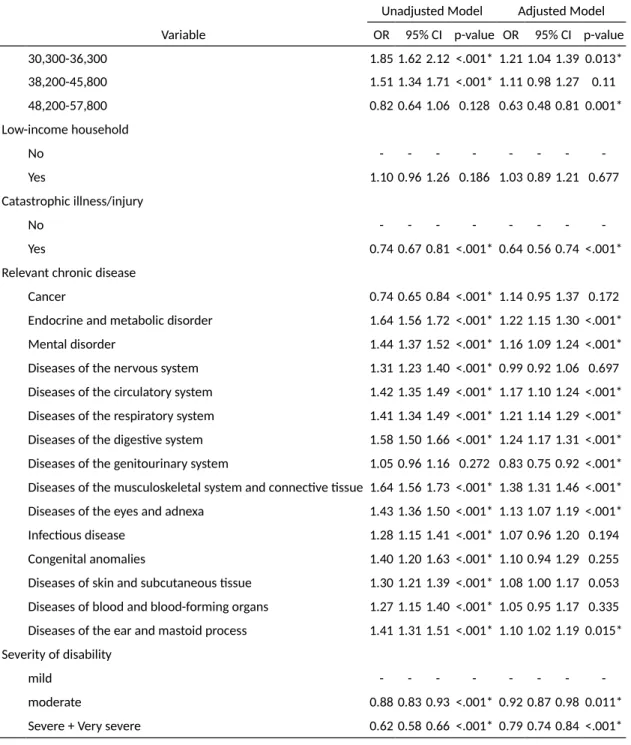
Multivariate logistic regression analysis revealed the likelihood of utilization to be significantly lower in males compared to females after controlling for other
variables (Table 2). Compared with the 40-44 years subgroup, the utilization probability in the 65-69 and ≥ 70 years subgroups were 39% and 52% lower, respectively (OR = 0.61 and 0.48, both p < 0.001). In comparison to Level 1 urbanization areas, the probabilities of utilization by residents in all other levels were significantly higher. In comparison to the PBMS NTD < 15840 subgroup, the
probability of utilization in the insured dependent subgroup was significantly lower (OR = 0.92, 95% CI: 0.85-0.99, p = 0.035), and that of the top level subgroup (NTD 48200-57800) was even lower (OR = 0.63, 95% CI: 0.48-0.81, p = 0.001). Those with catastrophic illness/injury had a much lower utilization probability (OR = 0.64, 95% CI: 0.56-0.74, p < 0.001). In terms of chronic diseases, after
controlling for other variables, only the subgroup with diseases of the genitourinary system had a significantly lower probability of utilization (OR = 0.83, 95% CI: 0.75-0.92, p < 0.001), whereas those with most other chronic diseases had either comparable or higher probabilities of utilization. In comparison to those with mild disabilities, the probability of utilization in those with moderate disabilities was 8% lower, and 21% lower in those with severe and very severe disabilities (OR = 0.79, 95% CI: 0.74-0.84, p < 0.001).
Further, those with a low-income household status, aboriginal status, and lower education level, which are traditionally regarded as being disadvantaged subgroups, were found to have no significant differences in the probabilities of utilizing health examinations.
Discussion
This is the first comprehensive nationwide study to report the preventive health examination usage status in the visually disabled population in Taiwan. The findings show that the rate of using preventive health examinations in this cohort is extremely low (16.16%) compared to the general population who were not visually impaired (33.3% to 40.72%) [36, 37]. In terms of age, over 60% of the cohort were aged 65 years or over. Chang et al. reported that the preventive health service utilization rate in the elderly in Taiwan is 46.8% [19], and another study reported that in aging Chinese Canadians, the rate is 76% [39]. These data suggest that most visually disabled people are elderly, and that the rate of using preventive health examinations in this population is very low. As indicated previously by evidence from different countries, an increased usage of preventive health examinations may improve health, reduce mortality and lower health care costs [20-22]. Therefore, it is imperative to enhance the utilization of preventive health examinations and improve the health status of this population.
Male gender, regardless of age, was significantly associated with a lower health examination usage, which is similar to previous reports [13, 21, 26]. In Taiwan, men still play the traditional role of familial financial support even if they have visual disabilities [40]. This could be ameliorated by advocating on-site health checks in
companies through proper planning. In addition, men tend to pay less attention to their own healthcare in Taiwan [41]. Further health education and encouraging couples to attend examinations may be helpful in this regard.
Of those who were found to have lower preventive health examination utilization, certain subgroups could be considered to be disadvantaged with regards to healthcare resources, possibly due to lower access. They included the insured dependent
subgroup, the elderly population, and those with a moderate or worse severity of disability. These subgroups share certain common characteristics. First, they are typical disadvantaged groups who are unemployed, with illnesses or senility, and need financial or transportation assistance. Second, they lack the personal ability to seek health services. Third, they may be reluctant to become a burden on their family. Several recommendations to enhance health examination utilization in these marginalized subgroups have been reported. For the disabled, transportation is an important barrier to access to health services in addition to financial constraints and communication difficulties [42, 43]. Free transportation is widely available in Taiwan [44], however it is used less frequently by people with disabilities. In addition,
patient-family support groups have been developed for patients with cancer or disabilities, and have been shown to be helpful in improving adjustment and self-reliance [45, 46]. To boost the utilization rate in this subgroup, healthcare authorities
may need to address these points by providing more resources and initiative services. People dwelling in the least urbanized regions such as the offshore islands and remote areas, aborigines, those with a low income, and those with lower education levels are traditionally considered to be disadvantaged groups and are expected to experience worse healthcare equity. However, the utilization rates in these groups were not lower in this study. Mobile health services and special programs initiated by the government to provide healthcare services to the remote and mountainous areas provide good healthcare access and may be the reason for the comparable utilization rates. In addition, the costs for the low-income households are covered by the Taiwan welfare system for co-payments per visit and National Health Insurance monthly premiums, and this may have played a role in enhancing preventive health service utilization in this disadvantaged group. Finally, those with a lower education level unexpectedly had a comparable utilization, which implies that, in Taiwan, other demographic factors such as age, income, or health status may be more closely associated with inequity.
Other subgroups that were found to have lower utilization rates were not considered to be disadvantaged groups, and may have had more health service alternatives. This includes the subgroup dwelling in the most urbanized region (Level 1), and the subgroup reporting the highest income (the subgroup with the top-ranked PBMS).
These results seem to be in contrast to other published reports; however they represent the subjects with a higher socio-economic status who may have more options for better self-paid preventive health services. In addition, these subjects might belong to health clubs which provide top-level health check programs, and therefore forego the free lower level preventive health checks provided by the National Health Insurance program.
Those with catastrophic illnesses and those with chronic systemic diseases of the genitourinary system were the two subgroups that had the lowest usage. However, these subjects would already have their preventive health service needs satisfied by scheduled regular check-ups at specialist clinics due to the underlying illness. All co-payments for such health services are exempt due to the status of having a
catastrophic illness, and thus these patients would most likely not require the free standard preventive health checks provided by the National Health Insurance program.
There are some limitations to this study. First, utilization of healthcare services is closely related to understanding the health service and social welfare systems, and this can be challenging for those who are unfamiliar with these systems. Second, this is a secondary dataset research based on three different data files. Factors such as health beliefs and family history of illnesses may influence the utilization of health
examinations, however these factors were are not included in the datasets. In addition, PBMS but not true income data was used for analysis, which may not represent the true income levels. Third, only those aged 40 or above were included in this study and extrapolation of the results to younger age groups would be inappropriate.
Conclusion
The overall preventive health examination utilization rate in the visually disabled population is very low in Taiwan. The subgroups with lower utilization included male gender, elderly subjects aged 65 years and above, subjects living in the most
urbanized regions, dependent subjects, subjects with a higher income level, subjects with catastrophic illnesses and genitourinary system diseases, and subjects with moderate or more severe disabilities. These findings have important implications for the healthcare policy makers who seek to reduce health disparity and enhance equity of healthcare for the visually disabled population. More resources should be allocated to address the issue of inequity in accessing healthcare in Taiwan.
List of abbreviations
MOI: the Ministry of the Interior PBMS: premium-based monthly salary
Competing interests
The authors declare that they have no competing interests.
Authors' contributions
WCT and PTK contributed to the conception and design of the study and to statistical analysis. YHH and WCT wrote the first draft of the manuscript. All authors
participated in the interpretation of data for important intellectual content, and revised and approved the final version of the manuscript.
Acknowledgements
This study was supported by a grant (CMU99-ASIA-19) from China Medical
University and Asia University. The health examination files were obtained from the Bureau of Health Promotion, Taiwan. We are also grateful for use of the National Health Insurance Research Database provided by the Department of Health, Taiwan, R.O.C. The interpretations and conclusions contained herein do not represent those of the Bureau of Health Promotion in Taiwan.
References
1. Dejong G, Palsbo SE, Beatty PW, Jones GC, Knoll T, Neri MT: The organization
and financing of health services for persons with disabilities. Milbank Q
2002, 80(2):261-301.
2. Kinne S, Patrick DL, Doyle DL: Prevalence of secondary conditions among
people with disabilities. Am J Public Health 2004, 94(3):443-445.
3. Havercamp SM, Scandlin D, Roth M: Health disparities among adults with
developmental disabilities, adults with other disabilities, and adults not reporting disability in North Carolina. Public Health Rep 2004,
119(4):418-426.
4. Howells G: Are the medical needs of mentally handicapped adults being
met? J R Coll Gen Pract 1986, 36(291):449-453.
5. Lennox NG, Kerr MP: Primary health care and people with an intellectual
disability: the evidence base. J Intellect Disabil Res 1997, 41 ( Pt 5):365-372.
6. Wilson DN, Haire A: Health care screening for people with mental handicap
living in the community. BMJ 1990, 301(6765):1379-1381.
7. Beatty PW, Hagglund KJ, Neri MT, Dhont KR, Clark MJ, Hilton SA: Access to
health care services among people with chronic or disabling conditions: patterns and predictors. Arch Phys Med Rehabil 2003, 84(10):1417-1425.
8. Park JH, Lee JS, Lee JY, Gwack J, Park JH, Kim YI, Kim Y: Disparities between
persons with and without disabilities in their participation rates in mass screening. European journal of public health 2009, 19(1):85-90.
9. Watson EK, Moles DR, Kumar N, Porter SR: The oral health status of adults
with a visual impairment, their dental care and oral health information needs. Br Dent J 2010, 208(8):E15.
10. Lebowitz EJ: An introduction to dentistry for the blind. Dent Clin North Am 1974, 18(3):651-669.
11. Edwards DM, Merry AJ: Disability part 2: access to dental services for
disabled people. A questionnaire survey of dental practices in Merseyside. Br Dent J 2002, 193(5):253-255.
12. Centers for Disease C, Prevention: Prevalence of disabilities and associated
health conditions among adults--United States, 1999. MMWR Morb Mortal Wkly Rep 2001, 50(7):120-125.
13. Kung PT, Tsai WC, Li YH: Determining factors for utilization of preventive
health services among adults with disabilities in Taiwan. Res Dev Disabil
2012, 33(1):205-213.
J, Taylor HR, Mitchell P, Eye Diseases Prevalence Research G: Causes and
prevalence of visual impairment among adults in the United States. Arch Ophthalmol 2004, 122(4):477-485.
15. Cacciatore F, Abete P, Maggi S, Luchetti G, Calabrese C, Viati L, Leosco D, Ferrara N, Vitale DF, Rengo F: Disability and 6-year mortality in elderly
population. Role of visual impairment. Aging Clin Exp Res 2004,
16(5):382-388.
16. Morse AR, Yatzkan E, Berberich B, Arons RR: Acute care hospital utilization by
patients with visual impairment. Arch Ophthalmol 1999, 117(7):943-949.
17. Lee DJ, Gomez-Marin O, Lam BL, Zheng DD: Visual acuity impairment and
mortality in US adults. Arch Ophthalmol 2002, 120(11):1544-1550.
18. McCarty CA, Nanjan MB, Taylor HR: Vision impairment predicts 5 year
mortality. The British journal of ophthalmology 2001, 85(3):322-326.
19. Chang WC, Lan TH, Ho WC, Lan TY: Factors affecting the use of health
examinations by the elderly in Taiwan. Archives of gerontology and geriatrics
2010, 50 Suppl 1:S11-16.
20. Maciosek MV, Coffield AB, Flottemesch TJ, Edwards NM, Solberg LI: Greater
use of preventive services in U.S. health care could save lives at little or no cost. Health affairs 2010, 29(9):1656-1660.
21. Hozawa A, Kuriyama S, Watanabe I, Kakizaki M, Ohmori-Matsuda K, Sone T, Nagai M, Sugawara Y, Nitta A, Li Q et al: Participation in health check-ups and
mortality using propensity score matched cohort analyses. Preventive medicine 2010, 51(5):397-402.
22. Deng BH, Liu HW, Pan PC, Mau LW, Chiu HC: Cost-effectiveness of elderly
health examination program: the example of hypertension screening. Kaohsiung J Med Sci 2007, 23(1):17-24.
23. Rudan I, Gibson J, Kapiriri L, Lansang MA, Hyder AA, Lawn J, Darmstadt GL, Cousens S, Bhutta ZA, Brown KH et al: Setting priorities in global child health
research investments: assessment of principles and practice. Croatian medical journal 2007, 48(5):595-604.
24. Kapiriri L, Norheim OF: Criteria for priority-setting in health care in Uganda:
exploration of stakeholders' values. Bulletin of the World Health Organization 2004, 82(3):172-179.
25. Smith RA, Cokkinides V, Eyre HJ: Cancer screening in the United States, 2007:
a review of current guidelines, practices, and prospects. CA: a cancer journal for clinicians 2007, 57(2):90-104.
2008, 14(3 Suppl):2-6.
27. Chan L, Doctor JN, MacLehose RF, Lawson H, Rosenblatt RA, Baldwin LM, Jha A: Do Medicare patients with disabilities receive preventive services? A
population-based study. Arch Phys Med Rehabil 1999, 80(6):642-646.
28. Makuc DM, Freid VM, Kleinman JC: National trends in the use of preventive
health care by women. Am J Public Health 1989, 79(1):21-26.
29. Utilization of preventive care services and their effect on cardiovascular outcomes in the United States. Risk Manag Healthc Policy 2011, 4:1-7.
(doi):10.2147/RMHP.S15777. Epub 12011 Jan 15719.
30. Bureau of National Health Insurance DoH, Executive Yuan: Universal Health
Coverage in Taiwan. In. Taipei, Taiwan: Bureau of National Health Insurance,
Department of Health, Executive Yuan; 2012: 2.
31. Bureau of National Health Insurance DoH, Executive Yuan: NHI 2012-2013
Annual Report In. Taipei, Taiwan: Bureau of National Health Insurance,
Department of Health, Executive Yuan; 2012: 76.
32. Does universal health insurance make health care unaffordable? Lessons from Taiwan. Health Aff (Millwood) 2003, 22(3):77-88.
33. Redistributive effects of the National Health Insurance on physicians in Taiwan: a natural experiment time series study. Int J Equity Health 2013, 12:13.(doi):10.1186/1475-9276-1112-1113.
34. Horizontal equity in health care utilization evidence from three high-income Asian economies. Soc Sci Med 2007, 64(1):199-212. Epub 2006 Oct 2002.
35. The distribution of net benefits under the National Health Insurance programme in Taiwan. Health Policy Plan 2007, 22(1):49-59. Epub 2006 Dec
2019.
36. Ministry of Health and Welfare T, ROC: The statistics of preventive health
services utilization. In. Taipei; 2012.
37. Tsai W-C, & Kung, P.-T.: Disabled people's utilization of prevention
examinations and associated factors. . In. China Medical University. (pp. 1–
241). 2010.
38. Liu CY HY, Chuang YL, Chen YJ, Weng WS, Liu JS, Liang KY: Incorporating
Development Stratification of Taiwan Townships into Sampling Design of Large Scale Health Interview Survey. Journal of Health Management 2006, 4(1):1-22.
39. Lai DW, Kalyniak S: Use of annual physical examinations by aging Chinese
Canadians. J Aging Health 2005, 17(5):573-591.
40. Wang C: Parenthood Beliefs and Work Values. Research in Applied
41. Chang LY YM, Jhao JY: [Latent Healthcare Utilization Classification and
Objective Health Measures]. Taiwanese Journal of Sociology 2011,
46:207-247.
42. British adults with chronic health conditions or impairments face significant barriers to accessing health services. Public Health 2012, 126(11):920-927.
doi: 910.1016/j.puhe.2012.1008.1003. Epub 2012 Sep 1015.
43. Primary care for adults with physical disabilities: perceptions from consumer and provider focus groups. Fam Med 2008, 40(9):645-651.
44. Cheng TM: Taiwan's new national health insurance program: genesis and
experience so far. Health affairs 2003, 22(3):61-76.
45. Lobato DJ, Kao BT: Integrated sibling-parent group intervention to improve
sibling knowledge and adjustment to chronic illness and disability. Journal of pediatric psychology 2002, 27(8):711-716.
46. Stewart R, Bhagwanjee A: Promoting group empowerment and self-reliance
through participatory research: a case study of people with physical disability. Disabil Rehabil 1999, 21(7):338-345.
Table 1 Characteristics and Chi-square analysis of the health examination utilization in the visually disabled population
Used Did not use χ2
Variables N=47812 % n1=7728 % n2=40084 % p-value
Overall utilization rate 16.16
Gender <.001* Female 23450 49.05 4014 17.12 19436 82.88 Male 24362 50.95 3714 15.25 20648 84.75 Age <.001* 40-44 1555 3.25 264 16.98 1291 83.02 45-49 3264 6.83 650 19.91 2614 80.09 50-54 4092 8.56 908 22.19 3184 77.81 55-59 4935 10.32 1184 23.99 3751 76.01 60-64 4790 10.02 1225 25.57 3565 74.43 65-69 6020 12.59 843 14 5177 86 ≧70 23156 48.43 2654 11.46 20502 88.54 Education <.001*
Primary school and below 29471 61.64 4518 15.33 24953 84.67
Middle school 4534 9.48 847 18.68 3687 81.32 High school 4729 9.89 855 18.08 3874 81.92 Post-secondary education 2649 5.54 438 16.53 2211 83.47 unknown 6429 13.45 1070 16.64 5359 83.36 Marital status <.001* married 28765 60.16 4890 17 23875 83 single 3486 7.29 560 16.06 2926 83.94 Divorced or widowed 2265 4.74 369 16.29 1896 83.71 unknown 13296 27.81 1909 14.36 11387 85.64 Aboriginal status 0.000* Yes 651 1.36 138 21.2 513 78.8 No 47161 98.64 7590 16.09 39571 83.91 Urbanization level <.001* Level 1 5123 10.71 685 13.37 4438 86.63 Level 2 9005 18.83 1509 16.76 7496 83.24 Level 3 6367 13.32 1014 15.93 5353 84.07 Level 4 3740 7.82 653 17.46 3087 82.54 Level 5 6997 14.63 1179 16.85 5818 83.15 Level 6 5340 11.17 896 16.78 4444 83.22 Level 7 6527 13.65 1070 16.39 5457 83.61 Level 8 4713 9.86 722 15.32 3991 84.68
Premium-based monthly salary (NT$) <.001*
Dependent 18495 38.68 2386 12.9 16109 87.1
Table 1 Characteristics and Chi-square analysis of the health examination utilization in the visually disabled population (cont).
Used Did not use χ2
Variables N=47812 % n1=7728 % n2=40084 % p-value 16,500-22,800 14324 29.96 2675 18.67 11649 81.33 24,000-28,800 1499 3.14 351 23.42 1148 76.58 30,300-36,300 1299 2.72 328 25.25 971 74.75 38,200-45,800 1954 4.09 422 21.6 1532 78.4 48,200-57,800 553 1.16 72 13.02 481 86.98 Low-income household 0.185 Yes 1470 3.07 256 17.41 1214 82.59 No 46342 96.93 7472 16.12 38870 83.88 Catastrophic illness/injury <.001* Yes 4240 8.87 539 12.71 3701 87.29 No 43572 91.13 7189 16.5 36383 83.5
Relevant chronic disease
Cancer <.001*
Yes 2278 4.76 288 12.64 1990 87.36
No 45534 95.24 7440 16.34 38094 83.66
Endocrine and metabolic disorder <.001*
Yes 21852 45.7 4326 19.8 17526 80.2
No 25960 54.3 3402 13.1 22558 86.9
Mental disorder <.001*
Yes 11338 23.71 2287 20.17 9051 79.83
No 36474 76.29 5441 14.92 31033 85.08
Diseases of the nervous system <.001*
Yes 6991 14.62 1360 19.45 5631 80.55
No 40821 85.38 6368 15.6 34453 84.4
Diseases of the circulatory system <.001*
Yes 26891 56.24 4892 18.19 21999 81.81
No 20921 43.76 2836 13.56 18085 86.44
Diseases of the respiratory system <.001*
Yes 12016 25.13 2385 19.85 9631 80.15
No 35796 74.87 5343 14.93 30453 85.07
Diseases of the digestive system <.001*
Yes 18885 39.5 3774 19.98 15111 80.02
No 28927 60.5 3954 13.67 24973 86.33
Diseases of the genitourinary system 0.272
Yes 3465 7.25 583 16.83 2882 83.17
Table 1 Characteristics and Chi-square analysis of the health examination utilization in the visually disabled population (cont).
Used Did not use χ2
Variables N=47812 % n1=7728 % n2=40084 % p-value
Diseases of the musculoskeletal system and connective tissue <.001*
Yes 19214 40.19 3895 20.27 15319 79.73
No 28598 59.81 3833 13.4 24765 86.6
Diseases of the eyes and adnexa <.001*
Yes 21623 45.23 4075 18.85 17548 81.15 No 26189 54.77 3653 13.95 22536 86.05 Infectious disease <.001* Yes 2599 5.44 507 19.51 2092 80.49 No 45213 94.56 7221 15.97 37992 84.03 Congenital anomalies <.001* Yes 986 2.06 208 21.1 778 78.9 No 46826 97.94 7520 16.06 39306 83.94
Diseases of skin and subcutaneous tissue <.001*
Yes 5602 11.72 1090 19.46 4512 80.54
No 42210 88.28 6638 15.73 35572 84.27
Diseases of blood and blood-forming organs <.001*
Yes 2632 5.5 511 19.41 2121 80.59
No 45180 94.5 7217 15.97 37963 84.03
Diseases of the ear and mastoid process <.001*
Yes 5135 10.74 1060 20.64 4075 79.36 No 42677 89.26 6668 15.62 36009 84.38 Severity of disability <.001* mild 15622 32.67 2993 19.16 12629 80.84 moderate 14050 29.39 2421 17.23 11629 82.77 severe 18138 37.94 2314 12.76 15824 87.24 very severe 2 0 0 0 2 100 *p<0.05
Table 2 Logistic regression analysis of the health examination utilization probability in the visually disabled population
Unadjusted Model Adjusted Model
Variable OR 95% CI p-value OR 95% CI p-value
Gender Female - - - -Male 0.87 0.83 0.91 <.001* 0.88 0.84 0.93 <.001* Age 40-44 - - - -45-49 1.22 1.04 1.42 0.015* 1.14 0.97 1.34 0.117 50-54 1.40 1.20 1.62 <.001* 1.21 1.04 1.42 0.016* 55-59 1.54 1.33 1.79 <.001* 1.27 1.09 1.49 0.002* 60-64 1.68 1.45 1.95 <.001* 1.34 1.14 1.56 <.001* 65-69 0.80 0.69 0.93 0.003* 0.61 0.51 0.71 <.001* ≧70 0.63 0.55 0.73 <.001* 0.48 0.42 0.56 <.001* Education
Primary school and below - - -
-Middle school 1.27 1.17 1.38 <.001* 1.04 0.95 1.13 0.447 High school 1.22 1.13 1.32 <.001* 1.02 0.93 1.11 0.713 Post-secondary education 1.09 0.98 1.22 0.1 1.06 0.94 1.19 0.372 unknown 1.10 1.03 1.19 0.009* 1.07 0.99 1.16 0.074 Marital status married - - - -single 1.07 0.97 1.18 0.164 1.00 0.91 1.11 0.958 Divorced or widowed 1.02 0.88 1.17 0.819 0.98 0.84 1.14 0.767 unknown 0.88 0.79 0.97 0.011* 0.85 0.76 0.94 0.003* Aboriginal status No - - - -Yes 1.40 1.16 1.70 0.001* 1.18 0.97 1.44 0.107 Urbanization level Level 1 - - - -Level 2 1.30 1.18 1.44 <.001* 1.30 1.17 1.44 <.001* Level 3 1.23 1.11 1.36 <.001* 1.27 1.14 1.42 <.001* Level 4 1.37 1.22 1.54 <.001* 1.38 1.22 1.56 <.001* Level 5 1.31 1.19 1.45 <.001* 1.41 1.26 1.57 <.001* Level 6 1.31 1.17 1.46 <.001* 1.40 1.25 1.58 <.001* Level 7 1.27 1.15 1.41 <.001* 1.46 1.30 1.63 <.001* Level 8 1.17 1.05 1.31 0.006* 1.27 1.12 1.44 <.001*
Premium based monthly salary (NT$)
<15,840 - - -
Table 2 Logistic regression analysis of the health examination utilization probability in the visually disabled population(cont).
Unadjusted Model Adjusted Model
Variable OR 95% CI p-value OR 95% CI p-value
30,300-36,300 1.85 1.62 2.12 <.001* 1.21 1.04 1.39 0.013* 38,200-45,800 1.51 1.34 1.71 <.001* 1.11 0.98 1.27 0.11 48,200-57,800 0.82 0.64 1.06 0.128 0.63 0.48 0.81 0.001* Low-income household No - - - -Yes 1.10 0.96 1.26 0.186 1.03 0.89 1.21 0.677 Catastrophic illness/injury No - - - -Yes 0.74 0.67 0.81 <.001* 0.64 0.56 0.74 <.001*
Relevant chronic disease
Cancer 0.74 0.65 0.84 <.001* 1.14 0.95 1.37 0.172
Endocrine and metabolic disorder 1.64 1.56 1.72 <.001* 1.22 1.15 1.30 <.001*
Mental disorder 1.44 1.37 1.52 <.001* 1.16 1.09 1.24 <.001*
Diseases of the nervous system 1.31 1.23 1.40 <.001* 0.99 0.92 1.06 0.697
Diseases of the circulatory system 1.42 1.35 1.49 <.001* 1.17 1.10 1.24 <.001*
Diseases of the respiratory system 1.41 1.34 1.49 <.001* 1.21 1.14 1.29 <.001*
Diseases of the digestive system 1.58 1.50 1.66 <.001* 1.24 1.17 1.31 <.001*
Diseases of the genitourinary system 1.05 0.96 1.16 0.272 0.83 0.75 0.92 <.001*
Diseases of the musculoskeletal system and connective tissue 1.64 1.56 1.73 <.001* 1.38 1.31 1.46 <.001*
Diseases of the eyes and adnexa 1.43 1.36 1.50 <.001* 1.13 1.07 1.19 <.001*
Infectious disease 1.28 1.15 1.41 <.001* 1.07 0.96 1.20 0.194
Congenital anomalies 1.40 1.20 1.63 <.001* 1.10 0.94 1.29 0.255
Diseases of skin and subcutaneous tissue 1.30 1.21 1.39 <.001* 1.08 1.00 1.17 0.053
Diseases of blood and blood-forming organs 1.27 1.15 1.40 <.001* 1.05 0.95 1.17 0.335
Diseases of the ear and mastoid process 1.41 1.31 1.51 <.001* 1.10 1.02 1.19 0.015*
Severity of disability
mild - - -
-moderate 0.88 0.83 0.93 <.001* 0.92 0.87 0.98 0.011*
Severe + Very severe 0.62 0.58 0.66 <.001* 0.79 0.74 0.84 <.001*