Image Descreening by GA-CNN-Based
Texture Classification
Yu-Wen Shou and Chin-Teng Lin, Senior Member, IEEE
Abstract—This paper proposes a new image-descreening tech-nique based on texture classification using a cellular neural network (CNN) with template trained by genetic algorithm (GA), called GA-CNN. Instead of using the fixed filters for image de-screening, we are equipped with a more pliable mechanism for classifications in screening patterns. Using CNN makes it possible to get an accurate texture classification result in a faster speed by its superiority of implementable hardware and the flexible choices of templates. The use of the GA here helps us to look for the most appropriate template for CNNs more adaptively and methodically. The evolved parameters in the template for CNNs can not only provide a quicker classification mechanism but also help us with a better texture classification for screening patterns. After the class of screening patterns in the querying images is determined by the trained GA-CNN-based texture classification system, the recommendatory filters are induced to solve the screening prob-lems. The induction of the classification in screening patterns has simplified the choice of filters and made it valueless to determine a new structured filter. Eventually, our comprehensive methodology is going to be topped off with more desirable results and the indication for the decrease in time complexity.
Index Terms—Cellular neural network (CNN), genetic algo-rithm (GA), image descreening, texture classification.
I. INTRODUCTION
S
UCH degradation in documental images, like morie pat-terns, [1], may be brought forth during the transformation from a scanned or halftoned image to electronic formats. Nu-merous inverse halftoning or descreening methods have been used to eliminate these artifacts regardless of the causes for gen-eration of screening noisy patterns [2]–[4]. In most studies, (in-verse) halftoning techniques can be generally classified into two categories: frequency- [5] and spatial- [6] domain approaches. As a matter of fact, frequency-domain approaches could keep more textured information in the screened images; whereas spa-tial domain approaches retain more properties for the spread of locations of screenings. That is also the reason that most papers tend to use such frequency-domain methods like fast Fourier transform (FFT), wavelet, or even Gabor filtering methods. Un-fortunately, their descreening results are still restricted even if complex filters are used through time consuming procedures. This mainly results from that no fixed filter could be success-fully employed in every kind of screened images. Thus, in this paper, we introduce a unique mechanism including two parts: Manuscript received April 22, 2003; revised April 7, 2004. This work was supported by the Brain Research Center, University System of Taiwan, under Grant 92B-711. This paper was recommended by Associate Editor P. Arena.The authors are with the Department of Electrical and Control Engi-neering, National Chiao Tung University, Hsinchu, Taiwan, R.O.C. (e-mail: [email protected], [email protected]).
Digital Object Identifier 10.1109/TCSI.2004.836861
the classification of screening textures and the descreening pro-cedure by the selected adaptive lowpass filter based on the clas-sified screening textures.
In the first stage, a texture classification engine for various screening patterns based on cellular neural networks (CNNs) is designed. Like neural networks [7]–[10], the CNN is a large-scale nonlinear analog circuit, which processes signals in real time. The CNN is made of a massive aggregate of regularly spaced circuit clones, called cells, which communicate each other directly only through its nearest neighbors [11]. This paper uses the genetic algorithm (GA) to determine the template ele-ments of CNNs. For the sake of the confined results in [12] and [13], the GA is preferred to overcome the problems of stability and adaptation in the CNN. The GA here takes a dual part in our decision of template elements for the CNN. One is to min-imize the objective function, called optimization; the other is to avoid the occurrence of oscillation and chaos while testing the pros and cons of working templates for CNN, called adap-tation. In addition, the design of template elements for CNN based on GA is not subject to the types of objective functions and minima, i.e., differentiability of the cost function and the ex-istence of local, global, separate, multiple minima, and so forth. Not only was the GA applied to a single-layer CNN, but also used for the parametric design of multilayer CNN. Like what is mentioned in [14], the template design of the multilayer CNN is necessary at times for complex problems that cannot be solved or realized in the easier manner of single-layer CNN particu-larly. Selecting CNN templates by GA, thus, has known to be widely used in every field of applications, regardless of single or multilayer CNN, and also has been shown to be powerful and robust in theory and practice [14]–[17]. Stochastic learning ap-proaches, GA in particular, have become a crucial alternative to deterministic ones, which take the stead of the classical methods by using the independent properties of initial conditions and the domain of applications combined with the implicit parallelism [15]. And the detailed descriptions about GA for choosing tem-plate elements of multilayer CNN have be given in literature as [18] when only the global responses to the input images of the system would be available. The multilayer CNN design is cer-tainly employed in the near future if the texture patterns were much more complicated than those we expected or no a prior information about the structure of the system had been given, or the separate operation of every layer had been in need. In [19], three different CNN templates trained by GA were pro-posed and carried out to give us a comparative index for per-formance of the system in different combinations of evolutional ways among generations, i.e., the average, inverse, and time-in-terpolated templates. Also, a modified assumption of parameters in GA like crossover or mutation rate in [19] made it practical 1057-7122/04$20.00 © 2004 IEEE
to push the responses out of the way giving rise to the diffi-culty of convergence. Besides the changes of fitness functions in the GA, the GA could be amended in other evaluation forms like the penalty functions mentioned in [15], [18] to give a pun-ishment assessment between layers of CNN if the structure of multilayer CNN is required. Now that the precise adjustment of parameters in our CNN template design based on GA is not nec-essary for our screening pattern classification in the descreening process, some slight changes about GA like the adaptation of fitness functions, how to set the parameters in the evolutional flows, etc. would be very useful and applicable to the issue of image descreening addressed in this paper.
This paper is organized in the following section orders: the entire architecture of our system, texture classification, the de-sign of working templates for CNN by GA, the selection of fil-ters according to the classified screening texture classes, deter-mination of the parameters in the chosen filter, experimental re-sults, and conclusion.
II. PROPOSEDSYSTEMARCHITECTURE
The proposed image-descreening system can be divided into three major processes. At first, we make use of GA to deter-mine the working template elements for the required operational function of CNN. After the working templates are determined, the required function of the CNN is determined at the same time. And then, in the execution of the CNN, the output can only be a binary image. For this reason, several useful indexes extracted from the output image of CNN are introduced to indicate the property of screening in the target image. By the information obtained from the output of CNN, the types of descreening fil-ters and the paramefil-ters in the filter are then obtained as desired. Finally, in the descreening stage, we apply the selected filter to the screened images to filter out the screenings.
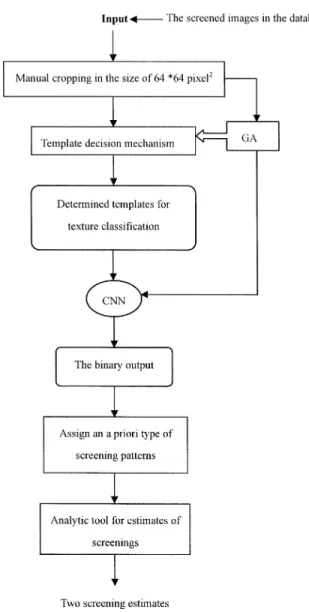
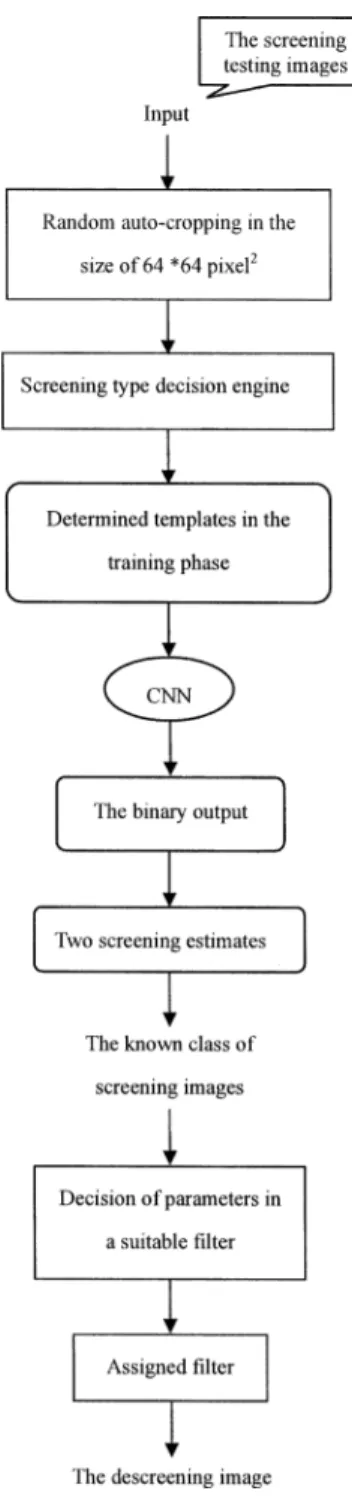
The proposed image-descreening technique consists of the training phase (Fig. 1) and descreening phases (Fig. 2). At the beginning, we have to prepare screened images on which the features of the screening patterns are extracted for training pur-pose. In the training phase, a block in the size of 64 64 pixel is extracted manually from the original screened images in our database. A block in the same size, of course, would be cropped automatically in the testing phase. Also, in the training phase, the proper template of the CNN is determined by GA to perform texture classification with the derived template. Two screening estimates calculated from the output of the CNN in the training phase can be utilized to be the matching indexes for that in the testing phase. The closer the calculated values in the testing im-ages to those in the training imim-ages are, the higher the level of tendency toward that screening pattern will be. These two screening estimates not only suggest the types of descreening filters, but also determine such arguments like width, radius, or size in the selected filter. Once the type of the screened image has been recognized according to the extracted screening pat-tern, this screened image will be convolved with the suggested filter to acquire the final descreened image.
III. SCREENINGTEXTURECLASSIFICATION
There are diverse screening patterns in the screened images; each can be best removed by a specific kind of filters, so the lack
Fig. 1. Flowchart of the training phase of the proposed GA-CNN-based texture classification scheme.
of the screening information in the screened images restrains the descreening results and complicates this kind of problems. Tex-tures can be viewed as complex visual patterns composed of en-tities, or sub-patterns, that have characteristic brightness, color, slope, size, etc., [20]. Generally speaking, four kinds of pop-ular approaches nearly dominate all the researches in the tex-ture analysis, i.e., structural, statistical, model-based, and trans-form methods. Structural approaches [20], [21] represent tex-ture by well-defined primitives (microtextex-ture) and a hierarchy of spatial arrangements (macrotexture) of those primitives. As to model-based texture analysis [22]–[28], it uses fractal and stochastic models, and attempts to interpret an image texture by using generative image model and stochastic model, respec-tively. Finally, transform methods for texture analysis, such as Fourier [27], Gabor [28], [29] and wavelet transforms [30]–[32] represent an image in a space whose coordinate system has a strong understanding that is closely connected with the charac-teristics of a texture, like scales or frequency.
The proposed texture analysis scheme combines the advan-tages of structural methods with those of statistical ones. The screening patterns can be referred to as primitives in structural
Fig. 2. Flowchart of the proposed image-descreening technique.
methods since the classification mechanism is a supervised one. In the descreening phase, smooth indexes are used to determine whether the screening patterns could stand for the screenings in the original images. If so, the screening pattern extracted from the original image will be fed into our classification engine, the GA-CNN. As soon as the type of screenings in the testing image is identified, the following processes will be much easier and the descreening performance will be better.
A. Screening-Texture Patterns
Screening patterns can be viewed as one kind of textures that represents the similarity grouping in an image. It may be diffi-cult to get this sort of similarity in the screened images accu-rately. It takes no effort, however, to observe the regularity of
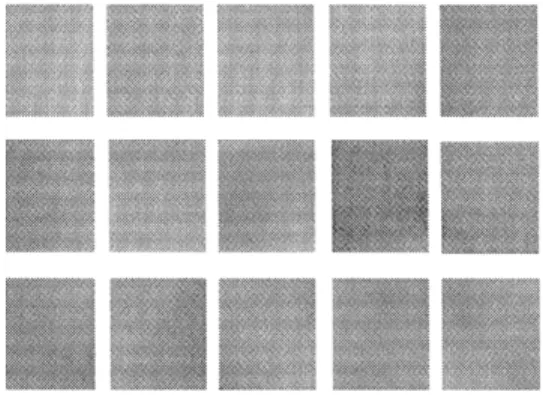
the same screened images by human perception. For example, Fig. 3(a)–(c) contains different types of screening patterns, each of which has its own regularity or uniformity, called texture of its own. Fig. 3(a) contains screenings with smaller granula-tions; while Fig. 3(b) has bigger or squared screenings. For the image corrupted by a specific screening pattern, a proper filter should be used for descreening. The total number of screening patterns for all the screened images can not be known before-hand. How to determine the number of screening patterns de-pends on the desired functional performance. In our experi-ments for the descreening purpose, only two classes of screening patterns are classified. Our experiments have showed that the descreening performance after two-class screening classifica-tion is very satisfactory and acceptable to human percepclassifica-tion. The two classes of screening patterns that are cropped manually from the screened images in our database are showed in Figs. 4 and 5, respectively. These patterns and manual classification re-sults will be used for the training of the proposed GA-CNN tex-ture classifier.
In the testing phase of the trained GA-CNN texture classifier, it is essential to identify the proper block(s) in the testing image for screening texture identification and classification. We shall propose a set of smooth indexes calculated from an image block for determining whether the extracted block is qualified to be one of the screening patterns in the testing images. Smooth in-dexes thus play a critical role in the screening classification. The derivation in more details for smooth indexes will be depicted in Section III-B.
B. Smooth Indices for Screening-Texture Block Detection
The standard deviations in statistical approaches were always used as the analytical tool for signal processing and image pro-cessing. The smooth index used in our approach can be also rep-resented in terms of the standard deviation; it is obtained from the proportion of difference in the standard deviations. The stan-dard deviation in an image represents the extent of difference in intensities of an image. Looking for an index which can best describe how smooth a block will be, we have made use of the proportion of difference in the standard deviations between our defined blocks, named the difference ratio of standard devia-tions.
The size of the screening pattern that we extracted from one of screened images is 64-by-64 pixels. We partition the extracted screening pattern into five parts (i.e., subscreening patterns). Fig. 6 illustrates this partition of the screening pattern. For each of them, a standard deviation value has to be calculated, and then the calculated value needs to be compared with that of the original screening pattern. With regard to all of these five sub-screening patterns, five difference ratios can be acquired for a screening pattern in a screened image. In the same way, four difference ratios can also be obtained about the central part from which is partitioned off the screening pattern. None of these nine numerical values being larger than ten percents to-tally makes sure of the smoothness of the extracted screening pattern. This smooth index can be tuned higher if the original document image is not that smooth and the components of edges may be more dominant. Although the smooth index is relevant to the screened images, it is ranged from 10% to 20% without
Fig. 3. Three example screened images. Images (a)–(c) contain different types of screening patterns.
Fig. 4. Class 1 of the training screening patterns.
Fig. 5. Class 2 of the training screening patterns.
respect to the complexity of the screened images. As Fig. 6 shows, each of the five blocks has half of the size of the orig-inal screening pattern, 32 by 32 pixels. The higher the smooth index is, the coarser the extracted screening pattern is. A smaller smooth index implies the uniformity and regularity of the ex-tracted screening pattern. The similarity among blocks can truly reveal the agreement to the screening pattern coming from the testing screened image.
IV. DESIGN OFCNN TEMPLATES FORSCREENINGTEXTURE CLASSIFICATION BYGA
The core technique in the proposed descreening method is to design a CNN-based screening texture classifier. The subject of template design or learning is the most important topic in CNN researches. The methods which have been investigated may be classified as local learning algorithms [33]–[35], global learning algorithms [36], [37], and analytical methods [38]–[41]. Local
Fig. 6. Partition in the screening pattern for calculating the smooth indexes. learning algorithms are derived from training methods devel-oped for other neural networks such as multilayer perceptrons, and their global counterparts mostly use stochastic optimization techniques such as GAs [36] or simulated annealing [37]. The analytical approaches are based upon a set of local rules char-acterizing the dynamics of a cell, depending on its neighboring cells. These rules are transformed into an affine set of inequal-ities that need be solved to get correctly operating templates. Actually, GAs inherit the properties of analytical methods and global methods. At the same time the local information can also be retained in the template training stage.
For texture analysis by using CNN based upon GAs, some rel-evant and representative studies as [19] and [42]–[47] have to be taken for further discussions. Like [19], a strategic approach was proposed to provide a simple but complete methodology for tex-ture classification and segmentation. Indeed, the featex-tures men-tioned in this reference, ratio of black pixels (ROB) and average gray levels, give a very helpful tool to classify up to 16 texture patterns after a series of processing units or analytic steps. But for some specific textures like screening patterns mentioned in this paper, the characteristics proposed earlier are not sufficient to classify and segment these screening texture patterns since there may be various causes for screenings such like different resolutions, sampling rates by documental scanning, printing processes, and so on. In [44], the hardware implementation for texture segmentation was developed, which sped up the research and discovery of texture analysis and other related applications, and meanwhile made texture-specific filtering and evaluation processes facilitated with parallel handling capability and con-secutive template training of CNNs. The uses of gray level his-tograms or other statistical methods in [19], [42]–[44] also mod-ulate the decision procedure after texture classification. In addi-tion to filtering textures in some orientaaddi-tion, having a process
of cross-correlation between the state and input, and using the halftone-like output of CNN as in [47], this paper turns the sta-tistical analysis of CNN and the classification of screening pat-terns in advance for descreening on a differently breaking view. Two useful estimates, therefore, have been deduced here to solve this kind of descreening problem exactly.
A. Cellular Neural Networks (CNNs)
A CNN is innovated with implementable circuits and the basic characteristics of structures of neural networks. For the image processing in CNN, the
dynamics of the network is governed by a system of
differential equations: where denotes the neighborhood of the cell , and are the feedback and the control tem-plate parameters, respectively, and are the height and width of an image, respectively, and is the disturbance term. CNN has presumed circumscribed by a virtual contour of cells with the constant input and output for the lack of a com-plete set of regular neighbors on the boundary cells. The corre-spondence subsumed under is the piecewise-linear sat-uration function
and is referred to as the output of . A template contains the combination of a triplet
for the template learning, where consists of all the arguments , and represents the values . In the structure of CNN, and both are 3 3 or 5 5 matrices. The size of matrices depends on the functions of CNN. The threshold is a one-dimensional scalar. In our system, we apply 3 3 matrices to both and in the consideration of functional performance for the texture classification. The constant input is chosen to be the original image; i.e., the extracted screening pattern in gray scales. The initial state in CNN for the texture classification can also be set as the original screening pattern due to the ability of convergence. The task now is to design proper templates such that the binary output of the corresponding CNN can indicate the class that the input screening pattern in gray scales belongs to.
B. Genetic Algorithms (GA)
A GA is a kind of methodology, which can accomplish the specific task or processing by a series of rigorously mathemat-ical operations and logmathemat-ical decisions. With the ability of selec-tion, crossover, mutaselec-tion, and reproduction in genes, the supe-rior offspring will survive while the infesupe-rior one being excluded through competition. The most important part in GAs lies in the “fitness” function, a kind of objective or cost function that covers all the information about the discussions, which is in turn yielded to evaluate the fitness value of all the possible solutions
and their performances. Trying to reach a higher fitness value by recombining chromosomes has then become an essential con-stituent in this parameter space.
When it comes to the operational theories in GAs, schema or template theorem should have been taken to explain how it works. In the followings, some basic definitions in schema would be simply illustrated. A binary number “1xxx01xx” pre-sented here could be viewed as one of the examples of schemas where the symbol “x” means “Don’t care.” The values located in “x” could be 0 or 1. Also, the binary number with or without “x” is a schema. For a binary number “101,” thus, all possible eight schemas are 101, x01, 1x1, 10x, xx1, x0x, 1xx, xxx . There may include schemas for an bit binary number.
The operational theories in GAs are based upon the building blocks hypothesis, where the building blocks are the schemas applied for schema theorem. A good contour could be conserved in case of selections. A better result could be shown up in case of crossover. GAs could only find the optimization by getting rid of the local traps in case of mutation. From the above, of all the schemas with the smaller order, the shorter defining length, and those beneficial to looking for the optimization would survive generation by generation.
C. GA for CNN Template Design
When the GA is used as the training tool for CNN templates, a few conditions that ought to be met need to be taken into consid-erations. To make sure of the stability in the CNN, the positive cell linking [48] and symmetry [49] of the “A” template have to be verified. Fortunately, any template optimized by GAs must be stable because the lower fitness values always result from unstable trajectories in CNN. It ensures the stability in the CNN if a higher fitness value could be reached, which is exactly what the GA goes for. The well-known evaluation function is defined as the following formula by the mean squared error:
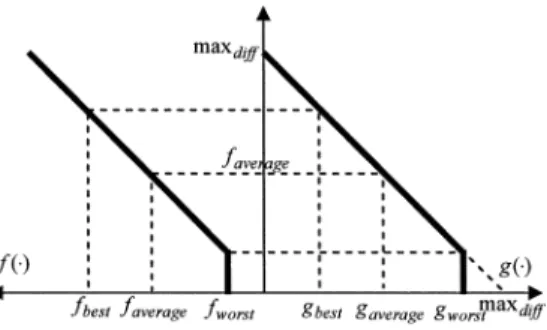
where is the training template including , , and , is the number of cells which depends on the size of templates, is the desired output for each pixel, and is the output in steady state. Obviously, only minimizing can make the training templates become our desired templates, which just goes against our purpose of getting higher fitness values. Therefore, a mod-ified mapping function is presented in Fig. 7 to transform the original cost function into the required fitness function
.
This mapping function mixes both advantages of windowing and linear scaling. Windowing is one sort of fitness functions that can assign a constant minimum fitness value to the chromo-some in the worst condition. The increased fitness value makes the chromosomes with lower fitness values have chance to com-pete with others in some exceptional conditions. A linear map-ping function with scaling is such a transforming function that the population with an average evaluation value can be mapped into the one with an average fitness value. The two properties amplify the difference between good populations and bad ones so that the survival chromosome could evolve more easily.
Fig. 7. Mapping function from the cost functiong(1) to the fitness function f(1).
Besides the transformation from the evaluation function to the fitness function, some other necessary elements in GAs have to be considered as well. To be more systemized, the steps in the GA used in search of CNNs templates are arranged below.
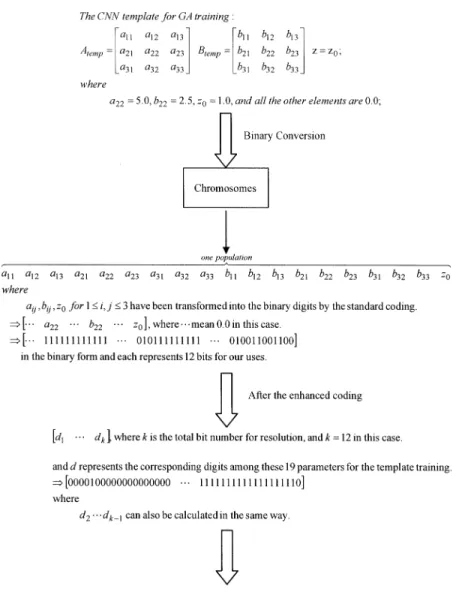
1) Encoding Process: For the facility of using crossover and
mutation, binary GA (BGA) is frequently utilized in GAs real-ization. Representing a floating decimal template in terms of a binary string is necessary. In fact, CNNs hardware implemen-tation would be the terminal goal in trying finding an appro-priate template, so the values of parameters in that template need to be ranged from 5 to 5. There exist a few popular coding methods like standard coding, enhanced coding, inverse reordering, etc. Enhanced standard coding has improved the cor-responding association in the standard coding methods. It is the right coding method to put the relevant digits corresponding to the same bit-location together for the effect that the familiarity in a binary string can be effortlessly found out without interfer-ences. This encoding process of chromosomes is illustrated in Fig. 8. For the sake of explanations, a simplified template with most entries filled by zero would be exhibited in our encoding process. The resolution used in our template optimization need not be too high since the redundant digits in CNN increase the computing loadings only. We take the binary strings in 12 bits for convenience to represent the decimal digits in CNNs tem-plates with the resolution less than 0.01; e.g., a binary string “111 111 111 111” represents a floating decimal 5.00 in the tem-plate. But for our optimization process in the experiments, 5–7 bits for each weight in one population would be quite adequate and efficient to realize the encoding progress, which is ought to be accompanied by optimizing 5–10 weights within each of it-erations in order to speed up the convergence in GA evolution. In this manner, CNN template decision could be well realized by the binary conversion in the first period of BGA.
2) Reproduction or Selection: In GAs, how to choose the
chromosomes with higher fitness values from the candidate population is quite a decisive problem, since it influences the survival or decay of a competitive population. At this time, we select the simplest and the most general selection method, Roulette wheel selection, to deal with this problem. At the point of adaptation functions, a higher fitness values will contribute to a bigger region area. A more contributed chromosome also would be liable to be picked out in the process of selection. The insufficient chromosomes will be generated by the recombina-tion of the chosen popularecombina-tions through reproducrecombina-tion, crossover, or mutation operations mentioned below.
3) Crossover and Mutation: Among various crossover
op-erators, a two-point crossover is adopted to alter the previous relationship between two crossing sites in the binary strings and its percentage value is chosen as 0.7 empirically. It signifies that all the bits between two different sites chosen randomly have to be exchanged. The two-point crossover ameliorates the draw-backs of one-point crossover with inability of linking certain schemas. Mutation, in the end, is just performed by flipping an arbitrary digit to increase the occurrence probability of the populations with low fitness values and varies from 5%–15% according to the present error in the fitness function. Besides, GA percentage (GAP) is also set to be 0.65 for keeping track of the optimized chromosomes and making the vibration in the GA training slighter. Through these operators, the CNN tem-plate learning can be carried out by the GA more successfully.
After the above GA optimization search, the designed CNN templates can be rearranged as a triplet and are listed in decimals in Fig. 9. On the GA training pass, we shall demon-strate the evolution processes by the curve of fitness functions [Fig. 10(a)] and the corresponding simulated results through GA-CNN [Fig. 10(c)]. In Fig. 10(a), the fitness values of the best, average, and poorest populations are indicated for each generation in an amount of five hundred generations. Likewise, five consistent results simulated through GA-CNN for every hundred generations are also displayed in Fig. 10(c). It can be observed apparently from the distribution of fitness functions [in Fig. 10(a)] that the fitness values incline toward a steady state after an appropriate number of evolved generations. Also, in Fig. 11, the convergence curve reveals the variation in the mean squared errors between the desired output and the output ac-quired by GA-CNN. The distribution of fitness values and con-vergence curve both show the expected generation which results in the satisfactory classification consequences in experiments.
V. SELECTION OFDESCREENINGFILTERS
Numerous filtering approaches for image descreening have been proposed previously since it was believed that there must be a way to find out a qualified filter for screenings removal. But unfortunately, the outcomes of this concept only provoked over-blurred images or low descreening effect. In spite of the complex procedures, the descreening results are still restricted even if sharpening after descreening has been employed. At the same time, most of the existing literature also gives defense to their proposed filters against the common descreening filters like Gaussian or median filters. As a matter of fact, these pop-ular filters still work quite well on condition that the suitable arguments are correctly decided. In this paper, we shall show that the median and Gaussian filters are capable of coping with nearly all the screened images if the screening patterns are clas-sified and the appropriate filter arguments are determined.
The Gaussian filter and median filter have complementary effects on image descreening. Although the Gaussian filter is often under the opinion that it has less effect on screenings re-moval, it can remove screenings without destroying the infor-mation of high frequencies in the original documental images if the screening degree would not be too high. Contrarily, the median filter has a stronger aptitude for screening removal yet
Fig. 8. Encoding process of chromosomes in the GA-CNN training phase.
Fig. 9. GA designed CNN templates for screening textures classification.
resulting in an over descreening phenomenon; i.e., over blurred-ness. When the screening degree is high enough, the median filter will have a great efficacy on image descreening. There-fore, the correct selection among these two filters according to different screening textures can solve almost all the image screening problems. Moreover, with the fittest filter arguments chosen in the filters adaptively, the descreening outcomes can be further improved. The adaptive argument decision mechanism will be described in Section VI.
According to the above discussion, as soon as the screening type in the screened image has been testified, either Gaussian or median filter will be used. The selection mechanism depends on the tendency strength of the screening type in the screened image. This selection does not indicate the exact screening pat-tern but an implication about which of the two filters can offer a better descreening consequence. The information of the binary
output from the CNN texture classifier is sufficient to determine which filter has to be selected. To extract such information, a determinative parameter is defined as follows:
where and both are the number of pixels with respect to the two screening types, respectively. The parameter is the selection ratio for recommending an agreeable filter for image descreening. The ratio is prone to approach zero or infinity in an ideal condition if some screening pattern is more dominant. In reality, the ratio is centered on the ranges by two boundary values, 10 and 0.1. It means that this parameter is ranged in two intervals, and . And, it can be observed that these two values are distinct enough to halve the defined screening patterns.
VI. ADAPTIVEDETERMINATION OFARGUMENTS INCHOSEN DESCREENINGFILTER
Even if a desirable filter for descreening has been selected correctly, an arbitrary decision of arguments in this filter might
Fig. 10. (a) Variation of the fitness values during the evolutions of GAs by 200, 400, and 500 generations, respectively. (from left to right). (b) Testing screening pattern for texture classification in gray scales and its binary desired output. (c) Simulated results after texture classification during the evolutions of GAs by 100, 200, 300, 400, and 500 generations, respectively. (From left to right).
Fig. 11. Convergence curve for mean squared errors of the fitness function. give rise to inferior descreening results. An advisable filter with the adaptive decision of arguments can just straighten out the problems in discussions. Two simple but applicable screening estimates are introduced here to provide the screened images with a well defined Gaussian or median filter. The two screening
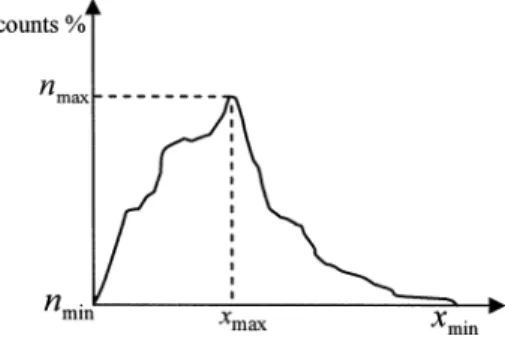
Fig. 12. Anx projection function of the screening pattern.
estimates are obtained by the CNN’s binary output as defined below. First, the CNN is performed to classify the screened image according to the extracted screening pattern and give a binary output for texture classification. Next, both and pro-jection functions can be sketched or analyzed with regard to the digits of the dominant screening type. Fig. 12 displays an pro-jection function of the binary output from the chosen screening pattern. The projection function of the same screening pattern can be plotted in the same way as Fig. 12. The two screening estimates can then be calculated as
The CNN’s binary output stands for the distribution of the two screening patterns and meanwhile reveals the screening degree in the original screened image. The above estimates point out the maximum variation in and directions, respectively; in other words, the distribution of screenings in that pattern could be also best described in two different directions. The inessential noises can be evitable since only the dominant screening type is consid-ered. Also, with the concern in image descreening, the range of arguments in the Gaussian or median filter should be determined in the first place. For the Gaussian filter, we only adjust the vari-ance in a Gaussian function from 1.5 to 9.0 with the precision up to 0.1. For the median filter, the size of the sliding block is the only argument value we have to determine in our scheme, which ranges from 3 to 15 in the width with the interval of one pixel. From any binary output obtained by the screening classi-fication, both of the two estimates can be calculated. Naturally, these two estimates have to be normalized into its proper range in accordance with the selected filter. This working interval was encircled by the maximum and minimum estimates computed from the screening patterns in the training phase. The maximal estimate is assigned to 9.0 as the minimal one is assigned to 1.5, and then the variance in Gaussian filter can be determined by in-terpolation. For the median filter, the width of sliding blocks can also be received in the same measure. Through the similar way in the training phase, we can inspect which direction is more de-cisive. In fact, we just emphasize the higher screening estimate in two directions now that the distribution of screenings in this direction will be evidently perceived.
VII. EXPERIMENTALRESULTS
The experimental results reported in this section will focus on the final results after descreening. In our approach, all the experiments can be separated into two parts: the training and testing phases. The training phase includes the collection of two different types of screening patterns, CNN template design, GA optimization, and the acquirement in the available informa-tion of two screening estimates. The testing phase comprises the classification of screening types, the texture classification based on CNNs, filter selection, and the adaptive decision of ar-guments in the chosen filter. The most time-consuming step in our method is GA optimization that determines CNN template for texture classification. In the testing phase, fortunately, we only use the fixed CNN templates, which have been optimized by GAs in the training phase. Actually, it takes almost no time in the stage of the screenings classification because only a small block (64 64 pixel ) in gray scales is extracted for further anal-ysis. As a whole, we spent about 3.3 or 0.8 s (by the computer, CPU: PIII, 800 MHz) dealing with a document image in the size of 862 pixels by 768 pixels if a median or Gaussian filter is selected as the descreening filter, respectively. The detailed experimental results in these two phases will be given in Sec-tions VII-A and B
A. Training Phase
The experimental results of using the GA for CNN template design can be exhibited in the form of screenings classification. Figs. 13–15 show variously assorted consequences by means of
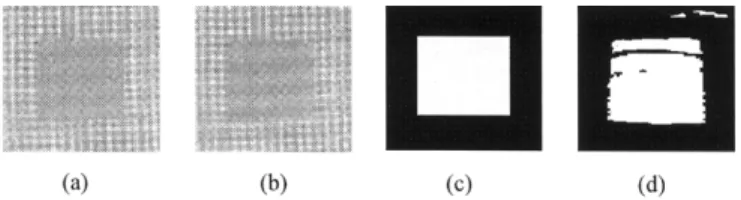
Fig. 13. One defined screening type. (a) Original screening pattern. (b) Screening pattern in gray scales. (c) Desired classification result. (d) Our experimental classification result.
Fig. 14. The other defined screening type. (a) Original screening pattern. (b) Screening pattern in gray scales. (c) Desired classification result. (d) Our experimental classification result.
Fig. 15. Mixed screening type. (a) Original screening pattern. (b) Screening pattern in gray scales. (c) Desired classification result. (d) Our experimental classification result.
Fig. 16. Illustrative image for the extraction of screening patterns by smooth indexes.
CNN texture classification based on GAs. The screening pat-terns in Figs. 13 and 14 are the ones from two defined distinct screenings. In Fig. 15, the screening is generated synthetically by mixing these predefined screening types. Fig. 16 presents the way to calculate the smooth indexes of the screening pattern by the manual cropping in the training phase. Table I lists the data of the smooth indexes with respect to two predefined screening types and a mixed screening pattern of those two screening types.
As Fig. 16 depicts, the screening pattern can be extracted accordingly. When the first screening is randomly selected, the corresponding smooth indexes can be calculated simultane-ously. If more than three indexes are larger than 20% in those nine indexes, the next screening pattern has to be randomly searched until that condition is satisfied. In this case, all the smooth indexes of the third chosen screening pattern will meet
TABLE I
COMPARISON OFSMOOTHINDEXESWITHRESPECT TOTHREESCREENINGPATTERNS INDISTINCTSMOOTHNESS, (A), (B),AND(C) ACCORDINGLY
TABLE II
COMPARISON OFCLASSIFICATIONERROR FORSCREENINGPATTERNS BYROB, TE (ORGRAYLEVELAVERAGE),AND OURINTRODUCEDPARAMETERS(ONE
DETERMINATIVEINDEX ANDTWOSCREENINGESTIMATES)INTERMS OFDIFFERENTOUTPUTFORMATS(BINARY/GRAYSCALE)
this requirement. Consequently, this searching procedure can be terminated and the selected screening pattern can be applied for the screenings classification in the screened images.
As Table I indicates, the screening patterns (a) and (b) both have smaller index values than the screening pattern (c). It is ob-vious that smaller index values will bring about smoother blocks of images, which is able to provide an index to distinguish the smoothness of an image block. In comparison with what the pre-vious works have been doing by using their features which were applied to texture classification and segmentation, the statistical arguments for screening pattern classification before image de-screening we proposed in this paper have shown a better classifi-cation performance and a lower misclassificlassifi-cation rate by Table II in 200 documental samples with various screenings. Table II describes the classification error by several different indexes, where one of them is the estimate that we made use of here, and the others are the common features like ROB and texture energy dealt with by half-toning or grayscale outputs. It is easy to ob-serve that the two estimates we proposed for image descreening indeed have more specific and distinguished characteristics to-ward the classification of screening patterns than what have been appeared in the past studies for aiming at the texture analysis only.
B. Testing (Descreening) Phase
In this subsection, we demonstrate some descreening out-comes of the proposed trained system on the screened images in the testing phase. The document images in Figs. 17 and 18 are processed by the Gaussian filter according to the screening clas-sification result. The document image in Fig. 19 is processed by the selected median filter obtained in the same way. The Gaussian filter applied to Figs. 17 and 18 is facilitated with its adaptive argument decision, so the variance in the Gaussian function is set to be 2.4 for both of these two cases by the two introduced
Fig. 17. Testing image for descreening using the Gaussian filter. (a) Original image. (b) Descreened image.
Fig. 18. Testing image for descreening using the Gaussian filter. (a) Original image. (b) Descreened image.
screening estimates. However, in Fig. 19, the screening type verifies the use of the median filter with the size of the sliding block by 6 pixels in width. No matter which filter is selected to do the image descreening, the document images after processing are undoubtedly superior to those in the related studies.
TABLE III
COMPARISON OFDESCREENINGPERFORMANCE ANDSCREENINGEXTENT INHUMAN’SOBSERVATION BYCREDITS ANDDISCREDITSHALVED INFIVE(NORMALLY WEHAVETHREEDIFFERENTRANGES: LOW FORDEGREE1–3, MEDIUM FORDEGREE4–7, HIGH FORDEGREE8–10)
Fig. 19. Testing image for descreening using the median filter. (a) Original image. (b) Descreened image.
Since there is no standard method for comparison in image quality after image-descreening processes, we devise an ex-perimental scheme in the aspect of psychology by compiling and integrating the opinions of around 100 persons to indicate the acceptable degrees of the descreened images for every screening extent in various respects like descreening results, smooth, or sharp degrees at the point of human perception. In Table III, the evaluation range is halved by five where the interval below five has a higher tendency toward discredits and the interval above five inclines a higher confidence by credits. In the same way, a finer division by three intervals shows such different levels as high, medium, and low. All data in Table III represent every tester’s point of view about the unprocessed and descreened images in an average scale. And Table III gives a kind of representative indexes, perceived from human eyes, which clearly demonstrates the higher descreening performance processed by our method than that handled by some previous approaches which were extensively used in image descreening. From the experimental data in the descreening results, our method is actually superior to any other one in every respect of image qualities including smoothness, fineness, and edge information after descreening processes.
It is also proved that a simple filter still can work as long as the screening type could be classified first and an appropriate lowpass filter is chosen. In spite of the variety in the screening types, the proposed filter selection scheme can settle most of the descreening problems.
VIII. CONCLUSION
This work was carried through with a creative idea in image descreening. An alternative way applied to the screening classification is the crucial part in making a correct choice of descreening filters for the removal of screenings. By the applications of CNN texture classification, the predefined screening patterns can be successfully separated. By the uses of GAs, the decisive template in the functions of CNNs can also be well optimized. The classification based on CNNs can be accomplished in such an easier manner that we make the descreening results more acceptable. Also, we introduced the smooth indexes to determine whether the screening pattern in the testing image was smooth enough to be extracted. The de-fined screening types can be verified for the later filter selection according to this screening pattern. CNNs in this paper played an influential part due to its stability and the association of neighboring cell linking. In particular, two suggested screening estimates in the training phase were taken to decide the range of the same ones in the testing phase, which helped to determine the arguments in the selected filter. In this adaptive way, an appropriate filter with the chosen arguments not only made the descreening processing easier but also rendered the processed images attractive ones to human perception.
Our experimental results indicated that the descreened doc-ument images by our schemes are more natural and acceptable to naked eyes, for both the high and low frequency part in a de-screened image demonstrating the smoothness and sharpness in concord. With the selection of a proper filter and the decision of its arguments, the screenings have been removed away effec-tively, but the high frequency part in document images would
still remain natural. It was shown that the descreening results were also pleasing or even better despite of the absence of sharp-ening processes in our approach. In the future, the binary output of CNNs will be extended to the output in gray values or even in color scales with more channels.
REFERENCES
[1] R. Ulichney, Digitial Halftoning. Cambridge, MA: MIT Press, 1987. [2] P. W. Wong, “Inverse halftoning and kernel estimation for error
diffu-sion,” IEEE Trans. Image Processing, vol. 4, pp. 486–498, Apr. 1995. [3] S. Hein and A. Zakhor, “Halftone to continuous-tone conversion of
error-diffusion coded images,” IEEE Trans. Image Processing, vol. 4, pp. 208–216, Feb. 1995.
[4] D. C. Youla and H. Webb, “Image restoration by the method of convex projections—Part I: Theory,” IEEE Trans. Med. Imaging, vol. MI-1, pp. 81–94, Oct. 1982.
[5] D. F. Dunn, T. P. Weldon, and W. E. Higgins, “Extracting halftones from printed documents using texture analysis,” Opt. Eng., vol. 36, no. 4, pp. 1044–1052, 1997.
[6] A. Jaimes, F. Mintzer, A. R. Rao, and G. Thompson, “Segmentaion and automatic descreening of scanned documents,” Proc. SPIE, vol. 3648, pp. 517–528, 1999.
[7] J. J. Hopfield, “Neural networks and physical systems with emergent computational abilities,” in Proc. Nat. Acad. Sci., vol. 79, 1982, pp. 2554–2558.
[8] J. J. Hopfield and D. W. Tank, “Neural computation of decisions in op-timization problems,” Bio. Cybern., vol. 52, pp. 141–152, 1985. [9] , “Computing with neural circuits: A model,” Science, vol. 233, no.
4764, pp. 625–633, 1986.
[10] D. W. Tank and J. J. Hopfield, “Simple ‘neuron’ optimization networks: An A/D converter, signal decision circuit, and a linear programming cir-cuit,” IEEE Tran. Circuits Syst., vol. CAS-33, pp. 533–541, 1986. [11] L. O. Chua and L. Yang, “Cellular neural networks: Applications,” IEEE
Trans. Circuits Syst., vol. 35, pp. 1273–1290, Oct. 1988.
[12] F. Zou, S. Schwarz, and J. A. Nossek, “Cellular neural network de-sign using a learning algorithm,” in Proc. IEEE Int. Workshop Cellular
Neural Networks Applications, 1990, pp. 73–81.
[13] S. Schwarz and W. Mathis, “A design algorithm for cellular neural net-works,” in Proc. 2nd Int. Conf. Microelectronics Neural Network, 1991, pp. 53–59.
[14] H. Harrer, “Multiple layer discrete time cellular neural networks using time variant templates,” IEEE Trans. Circuits Syst. II, vol. 40, pp. 191–199, Mar. 1993.
[15] P. Lopez, D. L. Vilarino, and D. Cabello, “Design of multilayer dis-crete time cellular neural networks for image processing tasks based on genetic algorithms,” in Proc. Int. Conf. Circuits Systems, 2000, pp. 133–136.
[16] P. Lopez, M. Balsi, D. L. Vilarino, and D. Cabello, “Design and training of multilayer discrete time cellular neural networks for antipersonnel mine detection using genetic algorithms,” in Proc. 6th IEEE Int.
Work-shop Cellular Neural Networks Applications, 2000, pp. 363–368.
[17] D. L. Vilarino, D. Cabello, M. Balsi, and V. M. Brea, “Image segmen-tation based on active contours using discrete time cellular neural net-works,” in Proc. 5th IEEE Int. Workshop Cellular Neural Networks
Ap-plications, 1998, pp. 331–336.
[18] P. Lopez, D. L. Vilarino, and D. Cabello, “Genetic algorithm based training for multilayer discrete time cellular neural networks,” in Proc.
Int, Work Conf. Artificial Natural Neural Networks, vol. 1607, 1999,
pp. 467–476.
[19] T. Sziranyi and M. Csapodi, “Texture classification and segmentation by cellular neural networks using genetic algorithms,” Comp. Vis. Image
Understand., vol. 71, no. 3, pp. 255–270, Sep. 1998.
[20] M. Levine, Vision in Man and Machine. New York: McGraw-Hill, 1985.
[21] R. Haralick, “Statistical and structural approaches to texture,” Proc.
IEEE, vol. 67, pp. 786–804, Aug. 1979.
[22] G. Cross and A. Jain, “Markov random field texture models,” IEEE
Trans. Pattern Anal. Machine Intell., vol. PAMI-5, pp. 25–39, Jan. 1983.
[23] A. Pentland, “Fractal-based description of natural scenes,” IEEE Trans.
Pattern Anal. Machine Intell., vol. PAMI-6, pp. 661–674, June 1984.
[24] R. Chellappa and S. Chatterjee, “Classification of textures using Gaussian Markov random fields,” IEEE Trans. Acoust., Speech, Signal
Processing, vol. ASSP-33, pp. 959–963, Apr. 1985.
[25] H. Derin and H. Elliot, “Modeling and segmentation of noisy and tex-tured images using Gibbs random fields,” IEEE Trans. Pattern Anal.
Ma-chine Intell., vol. PAMI-9, pp. 39–55, Jan. 1987.
[26] B. Manjunath and R. Chellappa, “Unsupervised texture segmentation using Markov random fields,” IEEE Trans. Pattern Anal. Machine Intell., vol. 13, pp. 478–482, May 1991.
[27] A. Rosenfeld and J. Weszka, “Picture Recognition,” in Digital
Pat-tern Recognition, K. Fu, Ed. New York: Springer-Verlag, 1980, pp. 135–166.
[28] J. Daugman, “Uncertainty relation for resolution in space, spatial fre-quency and orientation optimized by two-dimensional visual cortical fil-ters,” J. Opt. Soc. Amer., vol. 2, pp. 1160–1169, 1985.
[29] A. Bovik, M. Clark, and W. Giesler, “Multichannel texture analysis using localized spatial filters,” IEEE Trans. Pattern Anal. Machine
Intell., vol. 12, pp. 55–73, Jan. 1990.
[30] S. Mallat, “Multifrequency channel decomposition of images and wavelet models,” IEEE Trans. Acoust., Speech, Signal Processing, vol. 37, pp. 2091–2110, Dec. 1989.
[31] A. Laine and J. Fan, “Texture classification by wavelet packet sig-natures,” IEEE Trans. Pattern Anal. Machine Intell., vol. 15, pp. 1186–1191, Nov. 1993.
[32] C. Lu, P. Chung, and C. Chen, “Unsupervised texture segmentation via wavelet transform,” Pattern Recog., vol. 30, no. 5, pp. 729–742, 1997. [33] C. Guzelis and S. Karamahmut, “Recurrent perceptron learning
algo-rithm for completely stable cellular neural networks,” in Proc. IEEE
Int. Workshop Cellular Neural Networks Applications, Rome, Italy, Dec.
1994, pp. 177–182.
[34] J. A. Nossek, “Design and learning with cellular neural networks,” in Proc. IEEE Int. Workshop Cellular Neural Networks Applications, Rome, Italy, Dec. 1994, pp. 137–146.
[35] B. Mirzai, Z. Cheng, and G. S. Moschytz, “Learning algorithms for cel-lular neural networks,” in Proc. IEEE Int. Symp. Circuits Systems, vol. 3, Monterey, CA, June 1998, pp. 159–162.
[36] T. Kozek, T. Roska, and L. O. Chua, “Genetic algorithm for CNN tem-plate learning,” IEEE Trans. Circuits Syst. I, vol. 40, pp. 392–402, June 1993.
[37] B. Chandler, C. Rekeczky, Y. Nishio, and A. Ushida, “Using adaptive simulated annealing in CNN template learning-a powerful alternative to genetic algorithms,” in Proc. Eur. Conf. Circuit Theory Design, Bu-dapest, Hungary, Sept. 1997, pp. 655–660.
[38] B. Mirzai, D. Lym, and G. S. Moschytz, “On the robust design of uncou-pled CNN’s,” in Proc. Eur. Symp. Artificial Neural Networks, Bruges, Belgium, Apr. 1998, pp. 297–302.
[39] I. Fajfar and F. Bratkovi¢c, “Design of monotonic binary-valued cel-lular neural networks,” in Proc. IEEE Int. Workshop Celcel-lular Neural
Networks Applications, Sevilla, Spain, June 1996, pp. 321–326.
[40] L. O. Chua and P. Thiran, “An analytic method for designing simple cellular neural networks,” IEEE Trans. Circuits Syst. I, vol. 38, pp. 1332–1341, Nov. 1991.
[41] M. Hanggi and G. S. Moschytz, “An exact and direct analytical method for the design of optimally robust CNN templates,” IEEE Trans. Circuits
Syst. I, vol. 46, pp. 304–311, Feb. 1999.
[42] T. Sziranyi and A. Hanis, “Sub-pattern texture recognition using intelli-gent focal-plane imaging sensor of small window-size,” Pattern Recog.
Lett., pp. 1133–1139, 1999.
[43] T. Sziranyi and J. Zerubia, “Markov random field image segmentation using cellular neural network,” IEEE Circuits Syst. I, vol. 44, pp. 86–89, Jan. 1997.
[44] T. Sziranyi, “Texture segmentation by the 642 64 CNN chip,” in Proc.
IEEE Int. Workshop Cellular Neural Networks Applications, 2000, pp.
547–554.
[45] T. Sziranyi and J. Csicsvari, “High-speed character recognition using a dual cellular neural network architecture (CNND),” IEEE Circuits Syst.
II, vol. 40, pp. 223–231, Mar. 1993.
[46] J. P. Miller, T. Roska, T. Sziranyi, K. R. Crounse, L. O. Chua, and L. Nemes, “Deblurring of images by cellular neural networks with appli-cations to microscopy,” in Proc. 3rd IEEE Int. Workshop Cellular Neural
Networks Applications, 1994, pp. 237–242.
[47] T. Sziranyi, “Texture recognition using a superfast cellular neural net-work VLSI chip in a real experimental environment,” Pattern Recog.
Lett., pp. 1329–1334, 1997.
[48] L. O. Chua and T. Roska, “Stability of a class of nonreciprocal cellular neural networks,” IEEE Trans. Circuits Syst., vol. 37, pp. 1520–1527, Dec. 1990.
[49] L. O. Chua and L. Yang, “Cellular neural networks: Theory,” IEEE
Yu-Wen Shou received the B.S. degree in electrical
engineering, the B.S. degree in environmental en-gineering from the National Chen-Kung University, Tainan, Taiwan, R.O.C., in 1999 and the M.S. degree in electrical and control engineering in 2001, from National Chiao-Tung University, Hsinchu, Taiwan, R.O.C., where he is working toward the Ph.D. degree in electrical and control engineering.
His current research interests are in the areas of ar-tificial neural networks, fuzzy systems, pattern recog-nition, image documentation and cellular neural networks.
Chin-Teng Lin (S’88–M’91–SM’99) received the
B.S. degree in control engineering from the National Chiao-Tung University (NCTU), Hsinchu, Taiwan, R.O.C., in 1986 and the M.S.E.E. and Ph.D. degrees in electrical engineering from Purdue University, West Lafayette, IN, in 1989 and 1992, respectively.
Since August 1992, he has been with the College of Electrical Engineering and Computer Science, NCTU, where he is currently the Associate Dean of the Engineering College and a Chair Professor of The Electrical and Control Engineering Department. He has been the Director of Brain Research Center, NCTU Branch, University System of Taiwan, since September 2003, the Deputy Dean of the Research and Development Office of the NCTU from 1998 to 2000, and the Chairman of Electrical and Control Engineering Department from 2000 to 2003. His current research interests are neural networks, fuzzy systems, cellular neural networks (CNN), fuzzy neural networks (FNN), neural engineering, algorithms and VLSI design for pattern recognition, intelligent control, and multimedia (including image/video and speech/audio) signal processing, and intelligent transportation system (ITS). He is the coauthor of Neural Fuzzy System-A
Neuro-Fuzzy Synergism to Intelligent System (Englewood Cliffs, NJ: Prentice
Hall, 1996), and the author of Neural Fuzzy Control Systems with Structure
and Parameter Learning (Singapore: World Scientific, 1994). He has authored
about 80 journal papers in the areas of soft computing, neural networks, and fuzzy systems, including about 57 IEEE journal papers.
Dr. Lin has won the Outstanding Research Award granted by National Sci-ence Council (NSC), Taiwan, R.O.C., since 1997 to present, the Outstanding Electrical Engineering Professor Award granted by the Chinese Institute of Electrical Engineering (CIEE) in 1997, the Outstanding Engineering Professor Award granted by the Chinese Institute of Engineering (CIE) in 2000, and the 2002 Taiwan Outstanding Information-Technology Expert Award. He was also elected to be one of the 38th Ten Outstanding Rising Stars in Taiwan, R.O.C., (2000). He is a member of the IEEE Circuits and Systems Society (CASS), the IEEE Neural Network Society, the IEEE Computer Society, the IEEE Robotics and Automation Society, and the IEEE Systems, Man, and Cybernetics Society. He is also the member and Secretary of Neural Systems and Applications Technical Committee (NSATC) of IEEE CASS, and members of the Cellular Neural Networks and Array Computing (CNNAC) Technical Committee. He is the Distinguished Lecturer representing the NSATC of IEEE CASS from 2003 to 2005. He has been very active in IEEE International Symposium on Circuits and Systems (ISCAS) by serving as the Review Committee member of ISCAS 2003 in Thailand, the Technical Program Committee (TPC) member as the special-session organizer for Nano-Giga Technical Committee of ISCAS 2004 in Canada, the Organizing Committee member as the International Liaison of ISCAS 2005 in Japan, and the Organizing Committee member as the Special Session Co-Chair of ISCAS 2006 in Greece. He was also the Technical Program Vice Co-Chair of International Workshop on Nanoelectronic Circuits and Systems (IWNCAS 2003), IEEE CASS, Taiwan, 2003. He was also appointed to serve as Technical Program Co-Chair of the 9th Cellular Neural Networks and Applications (CNNA) International Workshop, IEEE CASS, to be held in Taiwan in 2005 (for the first time to be outside Europe). He has been the Council member of the International Fuzzy System Association (IFSA) since 2000, the member of Board of Government (BoG) of Asia Pacific Neural Network Assembly (APNNA) since 2000, and the Executive Council member (Supervisor) of Chinese Automation Association since 1998. He was the Executive Council member of the Chinese Fuzzy System Association Taiwan (CFSAT), from 1994 to 2001. He is the Society President of CFSAT since 2002. He was the Chairman of IEEE Robotics and Automation Society, Taipei Chapter from 2000 to 2001. He currently serves as the Associate Editor of IEEE TRANSACTIONS ONCIRCUITS AND SYSTEMS—I: REGULARPAPERS
and IEEE TRANSACTIONS ONCIRCUITS ANDSYSTEMS—II: EXPRESSLETTERS,
International Journal of Speech Technology, and the Journal of Automatica,
and was the Associate Editor of IEEE TRANSACTIONS ONSYSTEMS, MAN,AND
CYBERNETICS—B until June 31, 2004. He is a member of Tau Beta Pi and Eta Kappa Nu.