Galvanostatic Pulse Plating of PtRu Nanoparticles for Direct Methanol Fuel Cells
Yu-Chi Hsieh, Yung-Jean Lu, Pu-Wei Wu, Yun-Min Chang, and Yu-Fan Chiu Department of Materials Science and Engineering, National Chiao Tung University,
Hsin-Chu 300, Taiwan, ROC
A galvanostatic pulse electrodeposition technique of preparing nanoparticulate PtRu electrocatalyst for direct methanol fuel cells has been demonstrated. After extensive cyclic voltammetric analysis, we determined the optimized parameters for the methanol oxidation to be current on-time on 50 ms, current off-time of 400 ms, current density of 50 mA/cm2, and total charge of 8.0 C/cm2.
In addition, the catalyst loading was measured at 68 µg/cm2,
resulting in a mass activity of 213 mA/Pt.mg. The composition for the nanoparticles was confirmed as Pt65Ru35. High-magnification
images on the specimen indicated fine particles in 4-20 nm with uniform distributions.
PtRu has attracted considerable attention as an anode electrocatalyst for direct methanol fuel cells [1]. Recently, the research objective for the PtRu has concentrated on the synthesis in nanoparticulate form with desirable atomic distributions in both bulk and surface states. Conventional synthetic route involves chemical reduction techniques which unfortunately require post-treatments to remove surfactants and reaction products. This engenders results in some difficulties in precise composition control [2,3]. In contrast, electrodeposition is recognized to produce PtRu directly, albeit with a reduced coulombic efficiency [3-6]. In this work, we adopt a pulse galvanostatic deposition technique to fabricate the PtRu nanoparticles on carbon clothes and evaluate their methanol oxidation abilities. In addition, morphologies, compositions, and phase analysis of the as-prepared PtRu particles were conducted using Transmission Electron Microscope (TEM), Inductively Coupled Plasma Mass Spectrometry (ICP-MS), and X-ray Diffraction (XRD).
A carbon cloth was used as the starting substrate in this study. Prior to the electrodeposition, the carbon cloth was coated with an ink dispersion which was prepared
by mixing 5.0 mg Nafion solution (5.0 wt%) and 8.0 mg commercial carbon powders (Vulcan XC-72R) in 5.0 ml 99.5 wt% ethanol for 30 min. The ink dispersion was deposited carefully on a 2×2 cm2 carbon cloth which was kept at 80˚C atop a hotplate to evaporate the residual ethanol. The coating of the ink dispersion effectively reduced the surface area, porosity, and capacitance of the carbon cloth. Afterwards, an electrochemical treatment was adopted by imposing multiple voltammetric cyclings on the carbon cloth at potential between -0.2 and +1.1 V (vs. Ag/AgCl) at a scan rate of 50 mV/s in an electrolyte of 0.5 M sulfuric acid. The purpose for this step was to homogenize the pretreated carbon cloth and expose a larger surface area. For subsequent pulse electrodeposition, the electrolyte was prepared by mixing proper amounts of RuCl3 and NaNO2 (1:10 molar ratio) in aqueous solution at 100 ℃for 1 hour, followed by
addition of H2PtCl6 and cooled to room temperature. Then, the H2SO4 was added to
increase the conductivity of the plating bath. The resulting concentrations for the Pt, Ru,
and H2SO4 are 5.0 mM, 5.0 mM, and 0.25M, respectively. Figure 1 provides the
illustration for the pulse parameters including Ton=50 ms, Toff=200~500 ms, JA=50
mA/cm2, and total coulomb charge of 8.0 C/cm2.
Electrochemical measurements were conducted at room temperature in a three-electrode arrangement using an EG&G 263A. Cyclic voltammetric analysis (CV) was taken in a potential range of −0.2 and 0.9 V at a scan rate of 20 mV/s in solutions of
0.5 M H2SO4 (for hydrogen absorption/desorption), as well as 0.5 M H2SO4 and 1 M
CH3OH (for methanol oxidation).
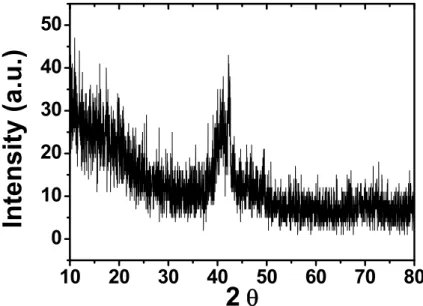
Figure 2 exhibits the XRD pattern for the as-deposited PtRu where a single diffraction peak at 41˚ was present. From the JCPDS data, the Pt exists in a fcc phase with the (111) peak at 39.8˚. Since the atomic size of Ru is smaller than that of Pt, alloying of Ru into the Pt lattice is expected to reduce the latter’s lattice parameter. This explains the observed slight shift of the diffraction peak (111) into higher angles. The XRD result suggested alloying of Pt and Ru was achieved successfully.
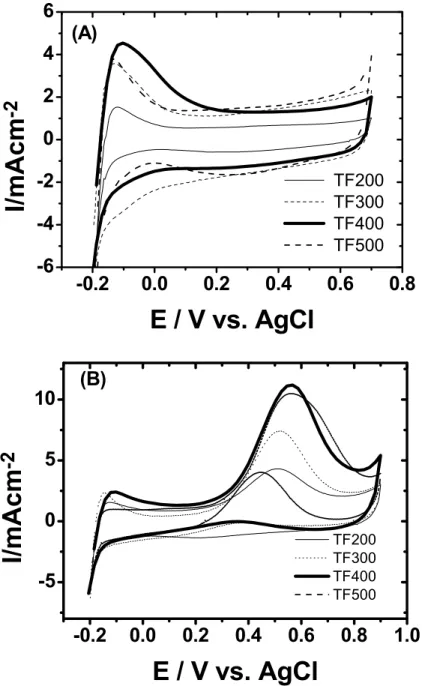
Figure 3(A) provides the CV scans for the as-prepared PtRu nanoparticles in 0.5 M H2SO4 electrolyte at Toff of 200, 300, 400, and 500 ms, respectively. Earlier, it was
established that the characteristic peak for the hydrogen adsorption and desorption at Pt surface appeared in the potential range of -0.12-0.02 V [7-10]. However, in the case of
PtRu, the oxidation of Ru into RuOxHy was taking place concurrently and thus the CV
responses became rather broad. As expected, we observed broad CV profiles from all samples. In particular, the curve from Toff of 400 ms exhibited the largest current value.
Since the area underneath the CV scans also reflects the effective electrochemical surface area, we surmised Toff of 400 ms to be of great interest among all our samples.
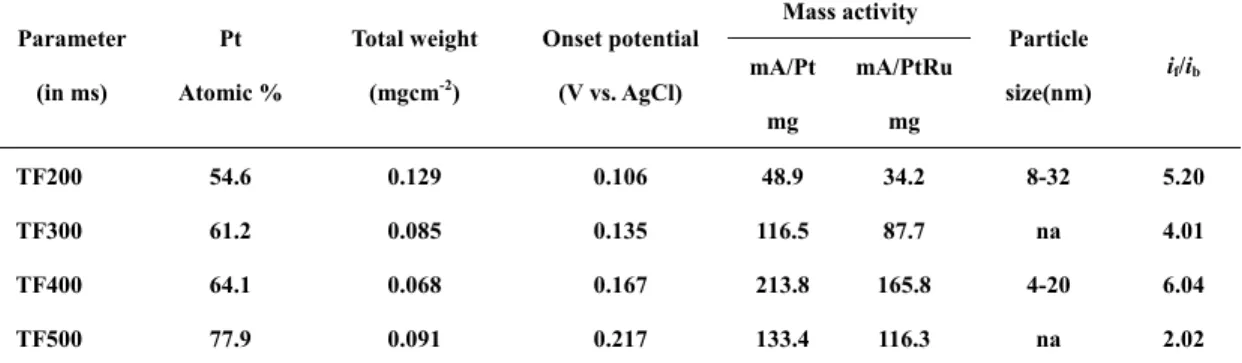
Figure 3(B) demonstrates the CV curves in 0.5 M H2SO4 and 1 M CH3OH. These
CV profiles provide critical information including the onset potentials, forward/backward peak current (if), and the ratio of forward peak current to backward peak current (if/ib).
These values are listed in Table I along with the information on particle sizes (from TEM) and Pt ratios (from ICP-MS). In methanol oxidation, these recorded CV curves demonstrated typical characteristics of PtRu, i.e., they were consistent with what have been reported in literature [11-13]. Interestingly, the sample for Toff of 400 ms revealed
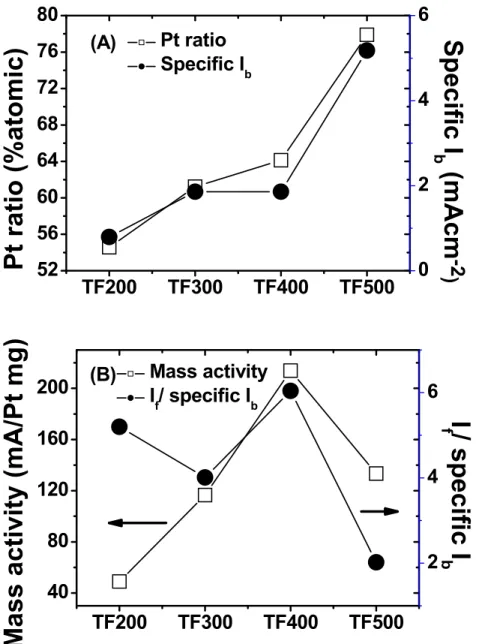
the highest ability for the methanol oxidation. For the onset potentials, samples with higher Ru ratios exhibited lower values. This behavior is understandable because the Ru atom not only is prone to oxidation in the electrolyte itself but also promotes oxidation of CO at Pt surface. Thus excess presence of Ru produces lower onset potentials for oxidation signals. Figure 4(a) exhibits the effect of Toff over the resulting Pt amount and
specific ib (defined as the absolute value of the cathodic peak current) in the PtRu
nanoparticles. It can be seen that the amount of Pt and specific ib increased with larger
Toff. The values for mass activity and if/ib are also provided in Fig. 5(b). In literature, the
mass activity reflects the intrinsic catalytic ability of an electrocatalyst while the ratio of if/ib indicates the tendency of efficient removal of adsorbed CO at the Pt sites [12,13].
Once again, we observed the highest values for samples with Toff of 400 ms, indicating
the highest catalytic ability for the methanol oxidation. Our results were consistent and reliable confirming the superiority of samples with Toff of 400 ms.
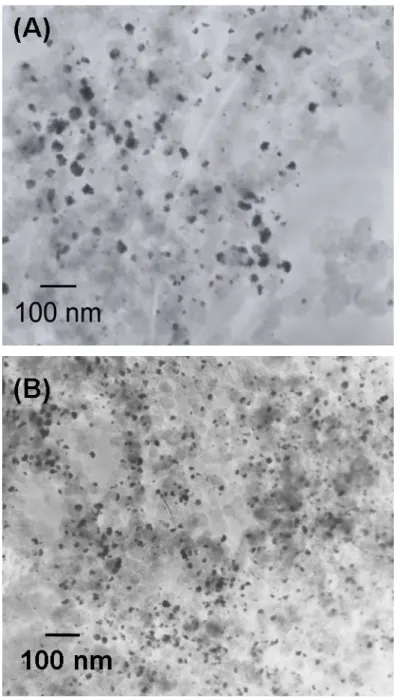
The images from samples with Toff of 200 and 400 ms are shown in Fig. 5.
Apparently, the sample with Toff of 400 ms demonstrated better distributions of fine PtRu
particles. In contrast, there was moderate aggregation occurring for sample with Toff of
200 ms. The difference in the PtRu sizes and distribution might explain the observed superiority in samples with Toff of 400 ms.
In summary, we successfully demonstrated the growth of PtRu nanoparticles on carbon clothes by a pulse electrodeposition technique. By varying the durations for Toff,
we were able to produce PtRu in various compositions and particle sizes. We determined
that a Toff of 400 ms produced nanoparticles with the highest catalytic ability for the
methanol oxidation. The sizes for the PtRu was in 4-20 nm range while its composition was Pt64Ru36. In addition, the measured mass activity was approximately 213 mA/mg. We
also observed that a shorter Toff resulted in lower catalytic abilities.
Financial support from the National Science Council of Taiwan is highly appreciated (NSC-96-2221-E-009-110). Equipment loans from Professor George Tu of National Chiao Tung University is noted.
REFERENCES
1. H. Liu, C. Song, L. Zhang, J. Zhang, H. Wang, and D. P. Wilkson, J. Power
Sources, 155, 95 (2006).
2. T. J. Schmidt, M. Noeske, H. A. Gasteiger, R. J. Behm, P. Britz, and H. Bönnemann, J. Electrochem. Soc., 145, 925 (1998).
3. T. J. Schmidt, M. Noeske, H. A. Gasteiger, R. J. Behm, P. Britz, W. Brijoux, and H. Bönnemann, Langmuir, 13, 2591 (1997).
4. C. Coutanceau, A. F. Rakotondrainibe, A. Lima, E. Garnier, S. Pronier, J-M. Léger, and C. Lamy, J. Appl. Electrochem., 34, 61 (2004).
5. F. Alcaide, Ŏ. Miguel, and H-J. Grande, Catal. Today, 116, 408 (2006).
6. Z. D. Wei, S. G. Chen, Y. Liu, C. X. Sun, Z. G. Shao, and P. K. Shen, J. Phys.
Chem. C, 111, 15456 (2007).
7. E. Antolini and F. Cardellini, J. Alloy Compd., 315, 118 (2001).
8. A. Wieckowski, E. R. Savinova, and C. G. Vayenas, Catalysis and
Electrocatalysis at Nanoparticle Surfaces (2003).
9. E. A. Ticcianelli, J. G. Beery, M. T. Paffet, and S. Gottesfeld,J. Electroanal. Chem., 258, 61 (1989).
10. F. Richarz, B. Wohlmann, U. Vogel, H. Hoffschulz, and K.Wandelt,Surf. Sci.,
335, 361 (1995).
11. M. T. Tsai, T. K. Yeh, and C. H. Tsai, Electrochem. Comm., 8, 1445 (2006). 12. R. Manohara and J. B. Goodenough, J. Mater. Chem., 2, 875 (1992).
Time (ms)
J
AT
offT
onI (m
A
/c
m
2)
Time (ms)
J
AT
offT
onI (m
A
/c
m
2)
Figure 1: Illustration of parameters used in the pulse galvanostatic electrodeposition.
10 20 30 40 50 60 70 80 0 10 20 30 40 50
Intensity (a.u.)
2 θ
-0.2 0.0 0.2 0.4 0.6 0.8 -6 -4 -2 0 2 4 6
I/mAcm
-2E / V vs. AgCl
TF200 TF300 TF400 TF500 (A) -0.2 0.0 0.2 0.4 0.6 0.8 1.0 -5 0 5 10I/mAcm
-2E / V vs. AgCl
TF200 TF300 TF400 TF500 (B)Figure 3: Cyclic voltammograms of PtRu electrocatalysts deposited with various Toff
(labeled as TF in the diagrams, unit in ms) in electrolyte of (A) 0.5 M H2SO4,
TF200 TF300 TF400 TF500 52 56 60 64 68 72 76 80 Pt ratio Specific Ib
Pt ratio (%atomic)
(A) 0 2 4 6Specific I
b(mAcm
-2 ) TF200 TF300 TF400 TF500 40 80 120 160 200 Mass activity I f/ specific IbMass activity (mA/Pt mg)
(B) 2 4 6
I
f/ specific I
bFigure 4: Relations of CV parameters with various Toff (labeled as TF, unit in ms); (A)
Figure 5: The TEM images for PtRu nanoparticles prepared with (a) Toff of 200 ms, and
Table I. Materials information of PtRu from various Toff (labeled as TF). Mass activity Parameter (in ms) Pt Atomic % Total weight (mgcm-2) Onset potential (V vs. AgCl) mA/Pt mg mA/PtRu mg Particle size(nm) if/ib TF200 54.6 0.129 0.106 48.9 34.2 8-32 5.20 TF300 61.2 0.085 0.135 116.5 87.7 na 4.01 TF400 64.1 0.068 0.167 213.8 165.8 4-20 6.04 TF500 77.9 0.091 0.217 133.4 116.3 na 2.02