Effect of Cyclic Flange Local Buckling on the Capacity of Steel Members 1
Tung-Yu Wua,*; Sherif El-Tawilb; and Jason McCormickb 2
a Department of Civil Engineering, National Taiwan University, Taipei, 10617, Taiwan 3
b Department of Civil and Environmental Engineering, University of Michigan, Ann Arbor, MI 4 48109, United States 5 6 ABSTRACT 7
Cyclic flange local buckling typically occurs when plastic hinges form in the beams and columns 8
of special moment resisting frames subject to seismic excitation. While local buckling in beam 9
plastic hinges has been investigated in the past for monotonic loading situations, the effect of cyclic 10
flange local buckling on beam and column behaviors is not yet well understood. In order to address 11
this shortcoming, nineteen half-scale T-section specimens are tested under cyclic axial loads in a 12
configuration intended to replicate the cyclic demands imposed on flanges of beams and columns 13
in their plastic hinge region. The main experimental variables are flange slenderness ratio, level of 14
web restraint, and loading scheme (monotonic versus cyclic). Validated computational studies are 15
performed to expand the parameter space. The test data and computational results show that T-16
section members that meet the current highly ductile limit can suffer excessive axial strength 17
degradation under cyclic axial loading. The effect of slenderness ratios on column compression 18
capacity due to strength degradation of flanges is evaluated and quantified. 19
Keywords: cyclic response; local instability; steel structures; capacity; seismic loading 20
* Corresponding author at: Department of Civil Engineering, National Taiwan University, Taipei, 10617,
1. Introduction 21
Local buckling can cause significant strength and stiffness degradation in steel member response 22
during an earthquake. Maximum values for the slenderness ratios of unstiffened and stiffened 23
elements of wide flange sections (i.e. b/2tf for flanges and h/tw for webs, where bf and h are flange 24
width and web height, respectively, and tf and tw are flange and web thicknesses, respectively) are 25
specified in the AISC specifications [1]. When ductility is important, e.g. in earthquake 26
applications, the maximum slenderness ratios are specified in the AISC seismic provisions [2] for 27
members classified as highly ductile or moderately ductile. The current slenderness limits are 28
derived from early analytical and experimental research on beams under monotonic loading [3-6]. 29
30
Information on the effect of cyclic loading on the slenderness limits is rather rare in the literature 31
and is typically inferred from member level response. Richards and Uang [7] studied the effect of 32
flange slenderness ratio on the cyclic rotation capacity of links using finite element models. Their 33
results suggested that the existing limiting slenderness ratios for link flanges could be relaxed. 34
Newell and Uang [8] conducted cyclic tests of W14 columns subjected to axial forces combined 35
with large drift loading. The stocky webs of W14 columns were found to stabilize the flange and 36
contribute to the observed large deformation capacity of the studied sections. Cheng et al. [9] tested 37
nine H-shaped beam-columns with large slenderness ratios and concluded that the effect of 38
flange/web slenderness ratios and axial force ratios should be considered mutually because of their 39
strong dependence upon each other. The computational study performed by Elkady and Lignos 40
[10] indicated that current limiting ratios for highly ductile members are not adequate for columns 41
subjected to a constant axial load of 0.2Py or more, where Py is the axial yield strength of the cross 42
section. Fogarty and El-Tawil [11], Fogarty et al. [12] and Wu et al. [13] reached similar 43
conclusions and proposed revised highly ductile limits for deep columns. 44
45
The intent of this paper is to address the paucity of experimental data on the effect of flange local 46
buckling (FLB) and develop a deeper understanding of the effect of the FLB slenderness on the 47
cyclic response of steel wide flange sections. To this end, nineteen half-scale T-section specimens 48
are subjected to monotonic axial compression and cyclic axial loading. The test configuration and 49
axial loading protocols are carefully chosen and developed to replicate the seismic demands 50
imposed on beam flanges and column flanges in their plastic hinge regions. The specimens cover 51
a wide range of flange slenderness ratios and allow for the study of the effect of web restraint on 52
flange local buckling behavior. A computational study is performed to further investigate the effect 53
of local slenderness ratios on the cyclic behavior of column flanges. The peak strength and strength 54
degradation rates observed from the test and simulations are compared and used to evaluate current 55
seismic provisions for local instability of steel members. 56
57
2. Finite Element Model Development and Validation 58
The finite element models employed in this work are created and analyzed using the commercial 59
software, Hypermesh [14] and LS-DYNA [15], respectively. The models are discretized using 4-60
node fully integrated shell elements (ELFORM 16) based on the formulation published by 61
Engelmann et al. [16] with a mesh size of 25.4 mm, which is also employed in Fogarty and El-62
Tawil [11]. The mesh density is kept constant in all models to avoid mesh size dependency. A 63
combined isotropic/kinematic hardening material model (MAT_153) developed by Huang and 64
Mahin [17] is assigned to the shell elements. The hardening moduli and model parameters are 65
calibrated to the true stress-true strain model proposed by Arasaratnam et al. [18] using nominal 66
properties of A992 steel. Initial imperfections in the T-section members used herein are obtained 67
by applying the first buckling mode as a geometric perturbation. Calibration studies showed that 68
the results match the test data best when the maximum amplitude of the applied perturbation 69
geometry is the plate width divided by 500. For example, for a flange with a width of 152.4 mm, 70
the magnitude of its imperfection is 0.305 mm. The modeling approach has been extensively 71
validated in previous work by the authors, e.g. in Fogarty and El-Tawil [11], Fogarty et al. [12] 72
and Wu et al. [19]. Additional validation studies using the experimental data obtained in this work 73
are discussed later on in the paper. 74
75
3. Rationale for T-Section Test Specimens 76
Under seismic loading, structural members of a special moment frame (SMF), such as beams and 77
columns, are subjected to either cyclic bending moment or combined cyclic axial force and 78
bending moment in their plastic hinge regions. The premise of this paper is that the seismic 79
demands on flanges in the plastic hinge region can be approximated as cyclic axial deformation 80
demands for wide flange beams and columns, as shown in Fig. 1. Therefore, rather than testing a 81
complete structural component or subassemblage, a short T-section column with fixed ends can 82
be tested under cyclic axial loading instead. This assumption substantially simplifies the study of 83
inelastic cyclic FLB because a hydraulic axial load frame can be used instead of a more 84
comprehensive and complicated setup needed to test a structural member or sub-assembly under 85
cyclic loading. 86
87
(a) (b) 88
Fig. 1. Flange deformed shape in plastic hinge region of (a) wide flange beams under cyclic 89
bending moment and (b) wide flange columns under combined cyclic axial force and bending 90
moment. 91
92
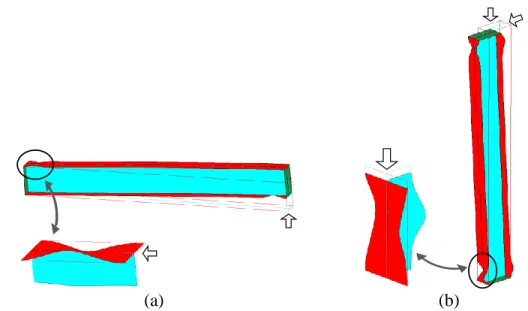
To ensure that the proposed T-section members realistically represent their full section 93
counterparts, the web portion of the T must be adequately long to impose the same level of flange 94
restraint achieved in the original section. Detailed finite element studies of W24 sections are 95
conducted to determine a reasonable web length. The axial deformation history of the flange in the 96
plastic hinge region, whose length is the same as the section depth as usually assumed [20], is 97
extracted and applied to its counterpart T-section member. The responses of the T-section member 98
and the corresponding portion in the full member are compared in terms of overall deformed shape 99
and the force versus deformation history. The studies suggest that a web length equal to one third 100
of the full section depth results in a meaningful representation of the overall section’s behavior. 101
102
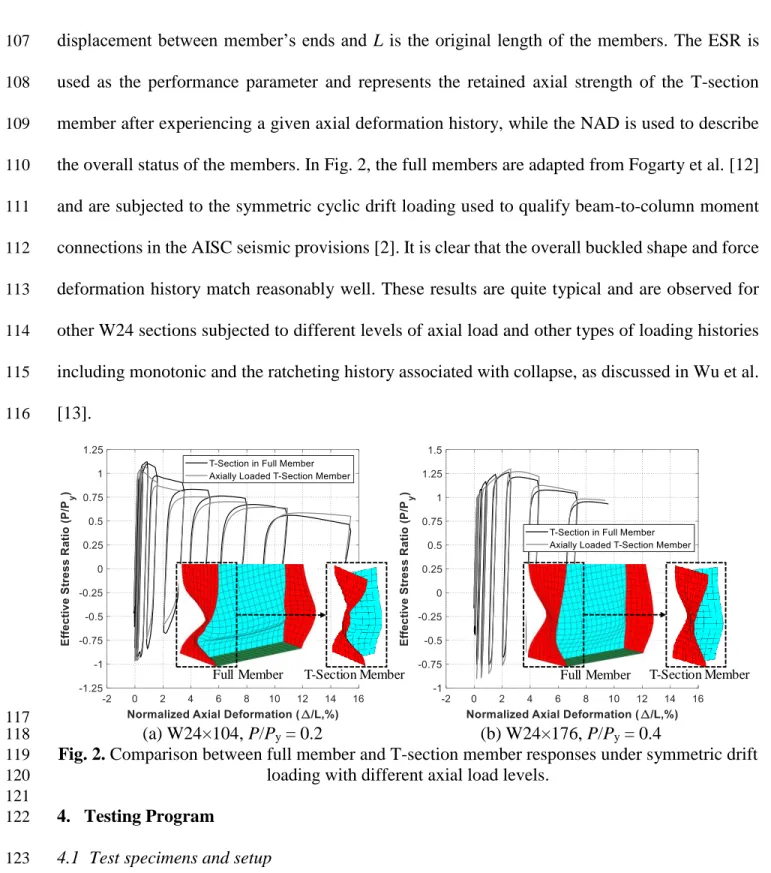
Fig. 2 shows comparisons between the full and T-section member responses for two different W24 103
sections under different levels of axial loading. Here, the effective stress ratio (ESR) is defined as 104
the axial strength normalized by the yield strength of the cross-section, i.e. P/Py, and the 105
normalized axial deformation (NAD) is calculated by Δ/L, where Δ is the relative axial 106
displacement between member’s ends and L is the original length of the members. The ESR is 107
used as the performance parameter and represents the retained axial strength of the T-section 108
member after experiencing a given axial deformation history, while the NAD is used to describe 109
the overall status of the members. In Fig. 2, the full members are adapted from Fogarty et al. [12] 110
and are subjected to the symmetric cyclic drift loading used to qualify beam-to-column moment 111
connections in the AISC seismic provisions [2]. It is clear that the overall buckled shape and force 112
deformation history match reasonably well. These results are quite typical and are observed for 113
other W24 sections subjected to different levels of axial load and other types of loading histories 114
including monotonic and the ratcheting history associated with collapse, as discussed in Wu et al. 115
[13]. 116
117
(a) W24×104, P/Py = 0.2 (b) W24×176, P/Py = 0.4 118
Fig. 2. Comparison between full member and T-section member responses under symmetric drift 119
loading with different axial load levels. 120
121
4. Testing Program 122
4.1 Test specimens and setup 123
Nineteen half-scale T-section specimens with a depth of 305 mm were selected to represent the 124
behavior of a W24 section, which is commonly used for beams and columns in the current design 125
T-Section Member
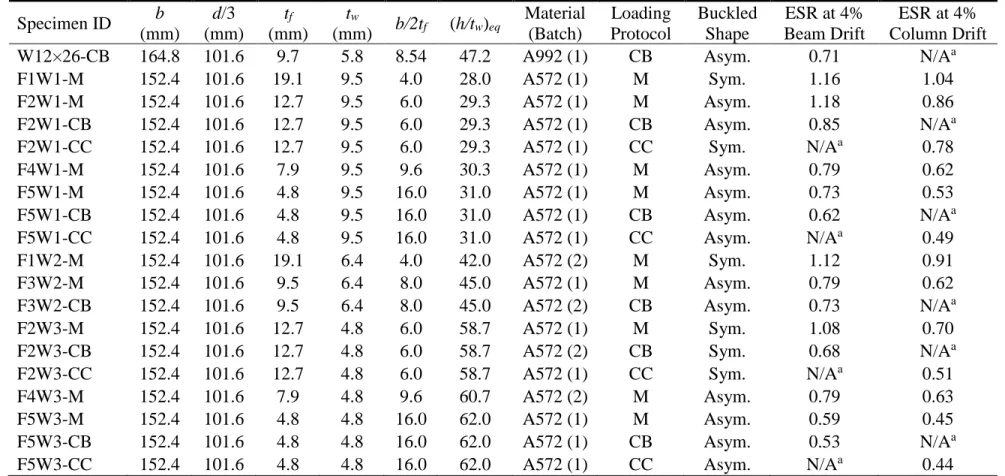
Table 1. Test matrix. 126 Specimen ID b (mm) d/3 (mm) tf (mm) tw (mm) b/2tf (h/tw)eq Material (Batch) Loading Protocol Buckled Shape ESR at 4% Beam Drift ESR at 4% Column Drift
W12×26-CB 164.8 101.6 9.7 5.8 8.54 47.2 A992 (1) CB Asym. 0.71 N/Aa
F1W1-M 152.4 101.6 19.1 9.5 4.0 28.0 A572 (1) M Sym. 1.16 1.04
F2W1-M 152.4 101.6 12.7 9.5 6.0 29.3 A572 (1) M Asym. 1.18 0.86
F2W1-CB 152.4 101.6 12.7 9.5 6.0 29.3 A572 (1) CB Asym. 0.85 N/Aa
F2W1-CC 152.4 101.6 12.7 9.5 6.0 29.3 A572 (1) CC Sym. N/Aa 0.78
F4W1-M 152.4 101.6 7.9 9.5 9.6 30.3 A572 (1) M Asym. 0.79 0.62
F5W1-M 152.4 101.6 4.8 9.5 16.0 31.0 A572 (1) M Asym. 0.73 0.53
F5W1-CB 152.4 101.6 4.8 9.5 16.0 31.0 A572 (1) CB Asym. 0.62 N/Aa
F5W1-CC 152.4 101.6 4.8 9.5 16.0 31.0 A572 (1) CC Asym. N/Aa 0.49
F1W2-M 152.4 101.6 19.1 6.4 4.0 42.0 A572 (2) M Sym. 1.12 0.91
F3W2-M 152.4 101.6 9.5 6.4 8.0 45.0 A572 (1) M Asym. 0.79 0.62
F3W2-CB 152.4 101.6 9.5 6.4 8.0 45.0 A572 (2) CB Asym. 0.73 N/Aa
F2W3-M 152.4 101.6 12.7 4.8 6.0 58.7 A572 (1) M Sym. 1.08 0.70
F2W3-CB 152.4 101.6 12.7 4.8 6.0 58.7 A572 (2) CB Sym. 0.68 N/Aa
F2W3-CC 152.4 101.6 12.7 4.8 6.0 58.7 A572 (1) CC Sym. N/Aa 0.51
F4W3-M 152.4 101.6 7.9 4.8 9.6 60.7 A572 (2) M Asym. 0.79 0.63
F5W3-M 152.4 101.6 4.8 4.8 16.0 62.0 A572 (1) M Asym. 0.59 0.45
F5W3-CB 152.4 101.6 4.8 4.8 16.0 62.0 A572 (1) CB Asym. 0.53 N/Aa
F5W3-CC 152.4 101.6 4.8 4.8 16.0 62.0 A572 (1) CC Asym. N/Aa 0.44
aNot available because the loading protocol is intended to approximate the seismic demands on flanges in beams (columns). 127
128 129
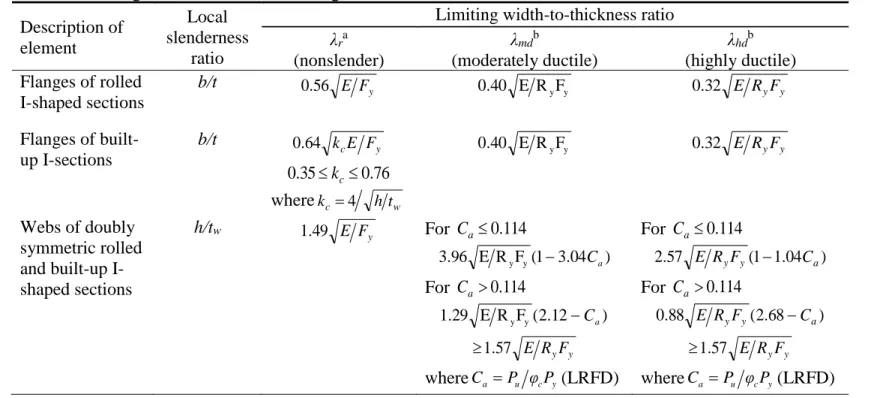
Table 2. Limiting slenderness ratios for flanges and webs. 130 Description of element Local slenderness ratio
Limiting width-to-thickness ratio λra (nonslender) λmdb (moderately ductile) λhdb (highly ductile) Flanges of rolled I-shaped sections b/t y F E 56 . 0 0.40 E RyFy 0.32 E RyFy Flanges of built-up I-sections b/t y cE F k 64 . 0 76 . 0 35 . 0 kc wherekc =4 h tw y yF R E 40 . 0 0.32 E RyFy Webs of doubly symmetric rolled and built-up I-shaped sections h/tw y F E 49 . 1 For Ca 0.114 ) 04 . 3 1 ( F R E 96 . 3 y y − Ca For Ca 0.114 ) 12 . 2 ( F R E 29 . 1 y y −Ca y yF R E 57 . 1 whereC =a Pu φcPy(LRFD) For Ca 0.114 ) 04 . 1 1 ( 57 . 2 E RyFy − Ca For Ca 0.114 ) 68 . 2 ( 88 . 0 E RyFy −Ca y yF R E 57 . 1 whereC =a Pu φcPy(LRFD) aAISC [1] 131 bAISC [2] 132
of special moment frames. The experimental parameters are flange and equivalent web slenderness 133
ratios, i.e. b/2tf and (h/tw)eq. The parameter (h/tw)eq is the web slenderness ratio of the full W24 134
section, where the depth is three times that of the T-section member. Changing (h/tw)eq changes 135
the amount of web restraint applied to the flanges. To achieve control over the slenderness ratios, 136
built-up sections were preferred over cutting T-sections from an existing W-sections. The effect 137
of residual stress due to the welding between the web and flange is considered insignificant as the 138
specimens undergo large plastic deformations. To confirm that the test results from built-up T-139
section specimens are transferable to WT-section members, a WT-section specimen cut from a W-140
section member with similar slenderness ratios to one of the built-up T-section specimens is also 141
studied. 142
143
Five flange thicknesses and three web thicknesses are selected to cover a range of local slenderness 144
ratios. The employed built-up T-section specimens are listed in Table 1, where F1 and W1 145
represent the thickest flange and web used in the test, respectively, and F5 and W3 represent the 146
thinnest ones. The local slenderness ratios of the specimens are shown in Fig. 3 along with the 147
code-specified limiting ratios for highly ductile (λhd), moderately ductile (λmd), and non-slender 148
(λr) elements, as listed in Table 2. According to AISC [1][2], highly/moderately ductile members 149
are “intended to withstand significant plastic rotation of 0.04/0.02 rad or more” during the design 150
earthquake, and non-slender sections are “cross sections possessing plate components where local 151
buckling in the elastic range will not occur”. Note that only non-slender limits for built-up sections 152
consider the effect of web slenderness ratio on flange capacity by using the kc factor, where kc is 153
the buckling coefficient for unstiffened elements and is calculated as 4 √ℎ 𝑡⁄ ⁄ 𝑤. 154
The built-up T-section and WT-section specimens were made of ASTM A572 Gr. 50 steel and 156
A992 steel, respectively. The steel was ordered in two batches, and two coupons were taken from 157
each plate in each batch and tested in accordance with ASTM E8 [21]. Table 3 summarizes the 158
average material properties of the two coupons from each batch of material. 159
160
Fig. 3. Local slenderness ratios of specimens along with code-specified limiting ratios for highly 161
ductile (λhd), moderately ductile (λmd), and non-slender (λr) elements. WT: WT sections. BU: 162
built-up section 163
164
Table 3. Results of Tensile Coupon Tests. 165 Material t (mm) Batch 1 Batch 2 Fy (MPa) Fu (MPa) Elongation (%) Fy (MPa) Fu (MPa) Elongation (%) A992 9.65 357 470 39.8 381 481 49.9 5.84 360 475 35.6 400 487 42.0 A572 19.1 357 506 36.2 380 540 - 12.7 380 460 40.5 407 464 36.9 9.53 414 469 41.7 401 465 54.9 7.94 440 484 31.3 471 537 42.3 6.35 425 470 27.6 365 448 48.3 4.76 408 513 29.2 368 496 36.9 166
The specimens are tested using the setup shown in Fig. 4. The web plate is welded to the flange 167
plate using a 2-sided fillet weld to form the built-up specimens. The specimens are then welded to 168
fixture plates that are bolted to the fixed loading heads of a 2.22 MN uniaxial hydraulic load frame. 169
Axial loading is applied in displacement control. The applied axial load is directly measured by a 170
load cell, while the axial displacement is measured by an optical tracking system with the markers 171
located at the center and four edges of the fixture plates. The five measured relative axial 172
displacements were averaged to obtain only the deformation in the specimen. 173
174
Fig. 4. Test setup. 175
176
4.2 Loading schemes 177
Three different loading protocols are employed in the experiment: (1) monotonic axial 178
compression (designated M); (2) cyclic axial loading that is intended to approximate the seismic 179
demands on flanges in beams (designated CB); and (3) cyclic axial loading intended to 180
approximate the seismic demands on flanges in columns (designated CC). The monotonic loading 181
scheme is used to obtain the buckling and post-buckling capacity of the cross-section without 182
cyclic degradation. The cyclic loading schemes reflect the axial demands on beams and columns 183
under the symmetric cyclic drift loading specified in the AISC seismic provisions [2]. 184
It is assumed that the overall strain distribution across the cross-section of a beam is linear about 186
the neutral axis and that the neutral axis location does not fluctuate with cyclic loading. For a 187
plastic hinge rotation, θ, the flange is subjected to an axial deformation Δ=dθ/2 in the plastic hinge 188
region, where d is the section depth. Assuming that the plastic hinge length is d [20], then the 189
flange is subjected to a NAD = Δ/L = dθ/2d= θ/2 in the plastic hinge region. As a result, the NAD 190
protocol applied to the T-section member, i.e. the CB protocol, is half the beam rotation specified 191
in the beam-column connection qualification protocol. For example, NAD = 2% when a beam 192
achieves 4% plastic rotation, a limit commonly associated with highly ductile response. The 193
resulting CB protocol is shown in Fig. 5. 194
195
The existence of axial force in columns increases the severity of web local buckling in column 196
members and causes the columns to shorten under cyclic loading. To take this into account, the 197
CC protocol is developed using finite element simulations of deep column specimens 1L 198
(W24×176), 2L (W24×131), and 3L (W24×104) tested in Ozkula et al. [22] and subjected to 199
symmetric cyclic drift loading. The three columns specimens are subjected to a constant axial load 200
of 0.18Py. The computed axial demand histories are averaged and smoothed to get the CC loading 201
protocol shown in Fig. 5. The NAD corresponding to a column drift of 4% in the selected CC 202
protocol is 8.3%. Although this protocol is specific to certain column sizes (similar to those 203
considered in this research) and may not be applicable to other columns, it reflects the flange 204
behavior commonly seen in experimental column tests. 205
The loading rate for monotonic loading (M protocol) is 1.52 mm/min. Faster rates of 3.05 mm/min 207
for small deformations and 12.2 mm/min for 4% NAD or larger are used for the cyclic loading 208
tests (the CB and CC protocols) to reduce test duration to a reasonable time. 209
210
Fig. 5. Employed loading schemes. 211
5. Experimental Results 212
5.1 Comparison between WT-Section and T-Section Specimens 213
Fig. 6 shows a comparison between the hysteresis responses and backbone curves of a WT-section 214
(W12×26) and a T-section (F3W2) specimen with similar slenderness ratios subjected to the CB 215
loading protocol. Except for the sudden drop in the backbone curve under tension due to a lapse 216
of applying axial displacement, Fig. 6 clearly shows that both specimens yield generally similar 217
responses in terms of peak load, post-buckling strength, post-peak degradation rate and hysteresis 218
under cyclic loading. This comparison provides confidence in the use of built-up sections in this 219
study and suggests that the findings also can be applied to W-sections. 220
221
(a) (b) 222
Fig. 6. Comparison of (a) hysteresis responses and (b) backbone curves for Wsection and T-223
section specimens with similar slenderness ratios under the CB protocol 224
225
5.2 FLB Modes 226
The specimens subjected to both monotonic and cyclic loading exhibit two distinct buckled shapes, 227
asymmetric and symmetric FLB, as shown in Fig. 7(a, d) and (b, e), respectively. The buckling 228
mode of each specimen is documented in Table 1. Most of the specimens exhibit asymmetric 229
buckling behavior, where the flange and web interact with each other and experience local 230
buckling simultaneously. The test data indicates that specimens that have comparable flange and 231
web slendernesses are more likely to experience asymmetric buckling. 232
233
A few specimens with a very stocky flange and a slender web, e.g. Specimen F1W2 with b/2tf of 234
4.0 and (h/tw)eq of 42.0, buckle in a symmetric mode, i.e. both half flanges bend together in the 235
direction of the plane of the web, as shown in Fig. 7(b). In this case, the flange itself suffers from 236
weak-axis flexural buckling because the restraint provided by the web is relatively minimal and 237
not able to alter the flange buckling mode. Within the studied range of slenderness ratios, only the 238
specimens with b/2tf ≤ 6 are susceptible to this mode. 239
The asymmetric buckling behavior is commonly seen in plastic hinge zones of deep columns 240
subjected to combined axial and lateral loading [22][23], lending credence to the premise of this 241
paper, i.e. the T-section specimens can replicate certain flange buckling responses and be used to 242
study the flange behavior in plastic hinge regions under large lateral displacements. The symmetric 243
buckling behavior has also been seen in previous tests [24], but with slight flange-web junction 244
displacement and in columns with the extreme combination of a stocky flange and a very stocky 245
web, e.g. W14×176 with b/2tf = 5.97 and h/tw = 13.7. 246 247 248 (a) (b) (c) 249 250 (d) (e) (f) 251
Fig. 7. Asymmetric local buckling in (a) Specimen F4W3-M and (d) Specimen F3W2-M; 252
symmetric local buckling in (b) Specimen F1W2-M and (e) Specimen F2W1-CC; and fracture in 253
(c) Specimen F2W1-CB and (f) Specimen F2W3-CB. 254
Fracture
5.3 Response under Monotonic Loading 255
The nine specimens under monotonic loading are compressed to 10% NAD and ESR is computed 256
using the material yield strength obtained from the coupon tests listed in Table 3. The ESR versus 257
NAD curves of the nine T-section specimens are plotted in Fig. 8, where specimens with the same 258
flange thickness are plotted in the same color, while the specimens with the same web thickness 259
are plotted in the same line style. 260
261
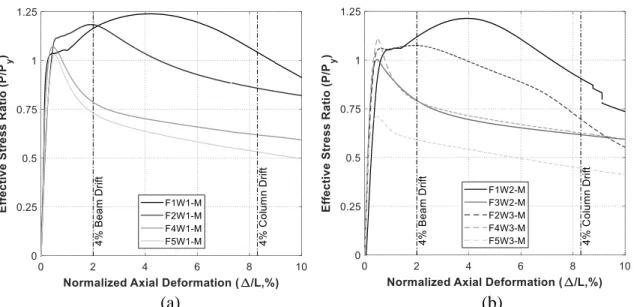
By comparing the curves of the specimens with a web thickness of 9.5 mm, i.e. W1 specimens 262
plotted as solid curves, it is clear that the smaller the b/2tf, the higher the buckling and post-263
buckling strength. For example, specimen F1W1-M’s peak strength reaches 1.24Py (b/2tf = 4.0), 264
meanwhile as b/2tf increases, the buckling strength drops to 1.18Py, 1.07Py, and 1.02Py for F2W1-265
M, F4W1-M, and F5W1-M, respectively. All four W1 specimens can reach Py even though F5W1-266
M has a b/2tf = 16.0, which is larger than λr = 13.5. The better than expected performance results 267
from the fixed end condition, which causes a full buckling wavelength that is commonly seen in 268
experiments and simulations [13, 24], unlike the pinned end conditions conservatively assumed in 269
the AISC specification [1]. In terms of post-buckling capacity, λhd works well for identifying the 270
sections with superior ductility. Specimens with a b/2tf lower than λhd = 7.35, i.e. F1W1-M and 271
F2W1-M, maintain a large post-buckling capacity of at least Py until 8.9% and 4.5% NAD, 272
respectively, which are much higher than NAD = 2% that corresponds to 4% beam drift. On the 273
other hand, F4W1-M and F5W1-M that have a b/2tf larger than λhd exhibit rapid strength 274
degradation after reaching the peak values and can only maintain Py up to NADs of 0.8% and 0.7%, 275
respectively. 276
277
(a) (b) 278
Fig. 8. Effective stress ratio-normalized axial deformation curves of specimens under monotonic 279
axial compression: (a) W1 specimens; (b) W2 and W3 specimens 280
281
The effect of equivalent web slenderness ratio, (h/tw)eq, on flange behavior is not significant when 282
b/2tf is smaller than 10 as can be seen from the comparison of specimens F1W1-M, F2W1-M, and 283
F4W1-M to their counterparts with slenderer webs, i.e. F1W2-M, F2W3-M, and F4W3-M. For 284
specimens with slender flanges, e.g. F5W1-M and F5W3-M, the effect of (h/tw)eq is significant 285
because the slender flange negatively interacts with the slender web. As shown in Fig. 8, while 286
Specimen F5W1-M has a peak strength of 1.02Py, F5W3-M reaches an axial capacity of only 0.7Py. 287
Overall, for flanges under monotonic compression, the λr and λhd limits in current seismic 288
provisions seem to be reasonable. 289
290
5.4 Effects of Cyclic Loading 291
The resulting relationship between ESR and NAD of the specimens under the three applied loading 292
protocols are plotted together in Fig. 9. Positive and negative NAD represent compression and 293
tension, respectively, to be consistent with Fig. 8. 294
Although the difference in peak compression strength between specimens under the M and CB 296
protocol is not significant, the degradation rate of post-buckling compression strength of the 297
specimens subjected to CB demands is considerably faster than their monotonic counterparts. For 298
example, as shown in Fig. 9(c), while Specimen F2W1-M maintains an axial capacity of at least 299
Py up to 4.5% NAD, Specimen F2W1-CB can only sustain Py to 1.5% NAD and quickly degrades 300
to 0.85Py at 2% NAD, suggesting that moment capacity of beams satisfying the λhd limits starts to 301
degrade after reaching 3% drift. The effect is even more pronounced for Specimen F2W3-CB. 302
These results suggest that the web restraint has a large impact on the rate of degradation with 303
continued cycling to large NAD levels. The strength degradation rates for specimens with high 304
b/2tf, e.g. specimen F5W1-CB and F5W3-CB, are comparable to their monotonic counterparts 305
before 2% NAD. After reaching 2% NAD, the rate of degradation is much faster. For example, the 306
post-buckling strength of both specimens under the CB protocol is 0.51Py and 0.44Py at 3% NAD, 307
respectively, compared to 0.67Py and 0.57Py, respectively, under monotonic loading. 308
309
Degradation of tensile strength occurs with cyclic loading, but the rate is substantially smaller than 310
that under compression. Tensile degradation generally begins during the 1.5% or 2% NAD cycles. 311
Specimens typically fail when the tensile strength drops to 0.8Py. Failure occurs due to fracture, 312
as marked by red circles in Fig. 9. One key characteristic that slenderness ratios influence is the 313
recovery of the tensile strength after unloading from compression. Specifically, more tensile strain 314
is required to stretch out the buckled shape and recover tensile strength for specimens that have 315
higher b/2tf and (h/tw)eq, i.e. experience more severe local buckling. For example, during the 2% 316
NAD cycle, Specimen F2W1-CB can reach 0.8Py at 0.7% NAD, but Specimen F5W3-CB has to 317
be pulled to -1.3% NAD (tension side) to recover the same level of tensile strength, as shown by 318
the red (thicker) lines in Fig. 9(c) and (b). 319
320
Although specimens under the CB protocol have the same buckled shape as the ones under the M 321
protocol, they eventually failed by ultra-low-cycle fatigue under tension. As shown in Fig. 7(c), 322
for Specimen F2W1-CB, fracture initiates at midpoints along the outer edges of the flange and 323
web, where the highest strain level occurs due to the buckling behavior. Because of the connection 324
between strain level and buckling behavior, fracture occurs earlier for specimens with larger b/2tf 325
and (h/tw)eq due to buckling during earlier cycles. For example, fracture occurs during the 3.5% 326
NAD cycle for Specimen F5W3-CB and is delayed to the 4.5% and 5.5% NAD cycles for 327
Specimens F5W1-CB and F2W1-CB, respectively. One exception is that Specimen F2W3-CB 328
suffers from earlier fracture at the midpoint along the flange-web connection during the 3% NAD 329
cycle due to symmetric buckling behavior, as shown in Fig. 7(f), suggesting that buckling mode 330
also has an influence on fracture behavior. Although ultra-low-cycle fatigue is the eventual failure 331
mode for all specimens, severe strength degradation under compression occurred much earlier and 332
therefore is a design concern. 333
334
The responses of the four specimens under the CC protocol are shown in Fig. 9. The backbone 335
curves of the F5 specimens are almost identical to the responses of their monotonic counterparts. 336
The F2 specimens under the CC protocol, unlike their monotonic counterparts, buckle in a 337
symmetric mode and have a lower backbone curve. From Fig. 9 it can be seen that all specimens 338
under the CC protocol experience much less tensile plastic strain than specimens under the CB 339
protocol, allowing the specimens to deform to greater NADs without succumbing to ductile 340
fracture. Nevertheless, the ESR of the specimens under the CC protocol at the 8.3% NAD that 341
corresponds to 4% column drift is lower than that of the specimens under the CB protocol at the 342
2% NAD that corresponds to 4% beam drift, as can be observed from Fig. 9. For example, the ESR 343
of F2W1-CC at the 8.3% NAD and F2W1-CB at the 2% NAD is 0.78 and 0.85, respectively. These 344
lower ESRs may greatly degrade column capacity and require further investigation. 345 346 347 (a) (b) 348 349 (c) (d) 350
Fig. 9. Comparison of axial force ratio-axial strain curves between different loading schemes for 351
Specimen (a) F5W1; (b) F5W3; (c) F2W1; and (d) F2W3. 352
6. Finite Element Simulations 354
Computational simulation is used to expand the parameter space and gain greater insight into the 355
effects of FLB on member capacity. 356
357
6.1 Validation 358
In addition to the validation effort discussed earlier in the paper, the modeling approach is further 359
validated using the experimental data presented in Section 5. Due to limited space, only a 360
comparison of responses of Specimen F3W2-M and F5W1-CC are shown in Fig. 10. The measured 361
specimen dimensions and material properties obtained from tensile coupon tests in Table 3 are 362
used in the finite element simulation. The peak strength, post-buckling strength, cyclic strength 363
degradation rate obtained from the simulation match well with those measured during the physical 364
testing and provide additional confidence that the employed modeling techniques can generate 365 reasonable behavior. 366 367 (a) (b) 368
Fig. 10. Comparison of responses between experimental and simulation results for Specimen (a) 369
F3W2-M and (b) F5W1-CC. 370
6.2 Section Selection and Performance Parameter 372
To study the effect of slenderness ratio on cyclic capacity of column flanges, finite element models 373
of T-sections with b = 152.4 mm, d/3 = 101.6 mm, and b/2tf and (h/tw)eq ranging from 6 to 16 and 374
24 to 56, respectively, are created using the modeling approach described in Section 2. The values 375
of b and d are the same as the tested specimens, and the range of slenderness ratios is selected to 376
cover most commercial standard W-section sections. The T-section models are axially loaded 377
according to the CC protocol to further study the lower ESRs observed from these specimens. 378
379
In all simulation cases, ESR is used to track cross-section capacity at different column drift levels. 380
As noted earlier, column drift levels are gauged from detailed finite element analysis of entire 381
columns. Fig. 11 shows the results of a T-section where b/2tf = 6 and (h/tw)eq = 32. The ESR is 382
0.94, 0.83, 0.76 and 0.69 at column drift levels of 1%, 2%, 3%, and 4%. 383
384
385
Fig. 11. The effective stress ratio (ESR) corresponding to different column drifts for the T-386
section with b/2tf = 6 and (h/tw)eq = 32 under the CC protocol. 387
6.3 Simulation Results 389
All T-sections buckle in the asymmetric mode with the ESRs plotted in Fig. 12 against b/2tf for 390
column drift levels of 1% through 4% for different values of (h/tw)eq. It is clear that (h/tw)eq has a 391
negative effect on ESR. While the negative effect is significant when the drift level is small, 1%, 392
it diminishes as both (h/tw)eq and drift level decrease in value. The effect also diminishes as the 393
value of b/2tf decreases. The above results further confirm the trend observed from the tests: the 394
effect of (h/tw)eq is significant only on post-buckling strength at small strain levels when the flange 395
is slender. An important observation from Fig. 12(d) is that the ESR curves tend to cluster together 396
at drift levels in excess of 2%, suggesting that it is reasonably accurate to ignore the effect of 397
(h/tw)eq on λhd limits for the flanges. 398
399
Fig. 12 also shows that both b/2tf and drift level adversely affect ESR. For example, for T-sections 400
with (h/tw)eq = 56, the ESR corresponding to 1% drift decreases from 0.92 to 0.61 when b/2tf 401
increases from 6 to 16. ESR drops significantly as the column drift increases to 4%, where its range 402
decreases from 0.92 - 0.61 to 0.70 - 0.50 for b/2tf ranging from 6 to 16. Through a regression 403
analysis, the effect of b/2tf and drift level on ESR can be quantified by the following bilinear 404
equation with b/2tf = 8 as a transition point: 405 𝐸𝑆𝑅 = (0.0575 − 0.422𝐷𝑅) (23.3 − 𝑏 2𝑡𝑓 ) for 6 ≤ 𝑏 2𝑡𝑓 ≤ 8 𝐸𝑆𝑅 = (0.0205 − 0.15𝐷𝑅) (51 − 𝑏 2𝑡𝑓 ) for 8 < 𝑏 2𝑡𝑓 ≤ 16 (1)
where DR is the column drift ratio, e.g. 0.04 rad for the cases in Fig. 12(d). Equation (1) is plotted 406
as the solid black line in Fig. 12 and portrays the negative effect of both b/2tf and drift level on 407
ESR. Another observation is that the degradation of ESR with drift level could be substantial. 408
According to Equation (1), when b/2tf=λhd, ESR drops from 0.78 to 0.65 (17% decrease) as DR 409 increases from 2% to 4%. 410 411 412 (a) (b) 413 414 (c) (d) 415
Fig. 12. Effective stress ratio (ESR) of T-sections at column DR of (a) 1%; (b) 2%; (c) 3% and 416
(d) 4%. 417
418
7. Comparison with Current AISC Seismic Provisions 419
All specimens with b/2tf and (h/tw)eq smaller than λr have a buckling strength larger than Py under 420
all loading schemes. Even when b/2tf exceeds λr, e.g. F5W1 specimens, a peak strength of at least 421
Py is still achieved. While not shown in this paper, the computational study also supports this 422
finding. As a result, the current λr limit is considered adequate for flanges in beams and columns 423
under the monotonic and cyclic loading schemes considered in this work. 424
425
From the experimental results, it is also clear that λhd is reasonable under monotonic loading. This 426
assessment is based on the observed good post-buckling responses exhibited by monotonically 427
loaded specimens with F1 and F2 flanges. The same can be said for specimens subjected to cyclic 428
axial loading for demands under the CB protocol. The degradation in tensile strength is much 429
milder than the post-buckling degradation seen under compression, which combined, will likely 430
allow most available cross-sections to carry at least 80% of their plastic moment capacity up to 431
4% rotation. Therefore, current limits on λhd for flanges appear to provide appropriate highly 432
ductile behavior for beams under cyclic loading. 433
434
Specimen F2W1-CC, which has a b/2tf smaller than the current λhd limit, exhibits an ESR of 0.78Py 435
at a NAD corresponding to 4% column drift. Equation (1) indicates that ESR reaches 0.65 at the 436
highly ductile slenderness limit. The evidence in this paper suggests that, barring other failure 437
modes such as global instability, a W24 column with slenderness characteristics similar to those 438
considered would be able “to withstand significant plastic rotation of 0.04 rad or more” per current 439
design philosophy and still support a substantial axial load. However, the key question of whether 440
the moment or axial capacities have been degraded too much by cyclic FLB is not addressed in 441
current seismic provisions. Unlike beams, where current seismic design provisions require that the 442
moment capacity be at least 80% of the plastic capacity at 4% drift, columns have no such 443
requirement. The research in this paper points out the need for more precise performance 444
requirements for columns. 445
446
8. Conclusions 447
The effect of cyclic FLB on the capacity of structural members in special moment frames was 448
experimentally and computationally investigated in this study. Nineteen half-scale T-section 449
specimens were axially loaded to represent the flange/web subassembly in the plastic hinge region 450
of a wide flange section under combined axial and flexural loading. The specimens were selected 451
to cover a wide range of slenderness ratios and subjected to three different loading schemes. The 452
loading schemes included monotonic compression, meant to obtain the flange capacity without 453
cyclic degradation, and two cyclic axial loading histories, one that reflected the axial demands on 454
beam flanges and another for column flanges under cyclic drift loading. To further study the cyclic 455
behavior of column flanges and justify the observation from the test results, a parametric 456
computational study with different slenderness ratios was performed. The effect of slenderness 457
ratios on column compression capacity due to flange strength degradation was then evaluated. 458
459
The test results showed that most T-section specimens could reach a peak strength of Py regardless 460
of the value of b/2tf, but b/2tf substantially influenced post-buckling behavior. Under monotonic 461
loading, the current value for λhd for a flange was shown to be a boundary between large buckling 462
capacity and rapid degradation after reaching peak strength. The effect of (h/tw)eq, on the other 463
hand, was shown to be secondary and became significant only when both b/2tf and (h/tw)eq were 464
large and negatively interacted with each other. 465
Specimens under the CB loading protocol exhibited much more severe compressive strength 467
degradation than the monotonic protocol. Depending on a specimen’s b/2tf, the compressive 468
strength dropped to as low as 0.53 Py at deformation levels that corresponded to 4% beam rotation. 469
The tensile strength had a much milder degradation rate than the compressive strength. However, 470
the required tensile strain for recovery of tensile strength after unloading from compression 471
depended on the slenderness ratio due to the effort of stretching out the buckled shape. 472
473
The backbone curves of specimens under CC loading were much higher than those for specimens 474
under CB loading and were quite close to the responses under M loading. This result was attributed 475
to the smaller tensile plastic strain demands and led to a milder cyclic degradation rate under 476
compression. Nevertheless, the degradation at higher drift levels could be substantial and could 477
compromise the axial and flexural capacities of the columns. 478
479
The experimental and computational data was used to evaluate the current AISC seismic 480
provisions. It was shown that the current λr limit is adequate for flanges in beams and columns 481
under the monotonic and cyclic loading schemes considered in this work. It was also shown that 482
λhd is reasonable for members under monotonic loading and CB loading, which is representative 483
of the demands seen in beams. The conclusion for λhd and λmd under CC loading, representative of 484
the demands seen in columns, was not definitive because the performance expectations of the 485
AISC seismic provisions are not as explicit as they are for beams. The research outlined in this 486
paper provides useful input to refine current specifications to address this issue. 487
The evaluation in this paper is only valid for the specific wide flange section sizes, loading 489
protocols and range of parameters studied. Although this research points out specific drawbacks 490
in the current AISC seismic provisions, additional research is needed to broaden the results and 491
draw comprehensive conclusions that warrant specification changes. 492
493
Acknowledgements 494
This work was supported by the University of Michigan and US NSF grant number ACI-1638186. 495
Any opinions, findings, conclusions, and recommendations expressed in this paper are those of the 496
authors and do not necessarily reflect the views of the sponsor. 497
498
References 499
[1] ANSI/AISC 360-16 Specification for Structural Steel Buildings. Chicago, IL: American 500
Institute for Steel Construction; 2016. 501
[2] ANSI/AISC 341-16 Seismic Provisions for Structural Steel Buildings. Chicago, IL: American 502
Institute for Steel Construction; 2016. 503
[3] Sawyer HA. Post-Elastic Behavior of Wide-Flange Steel Beams. Journal of the Structural 504
Division ASCE 1961; 87 (ST8): 43–71. 505
[4] Lay MG. Some Studies of Flange Local Buckling in Wide-Flange Shapes. Journal of the 506
Structural Division ASCE 1965; 91(6): 94-116. 507
[5] Bansal JP. The Lateral Instability of Continuous Steel Beams. CESRL Dissertation No. 71-1. 508
Austin, TX: University of Texas; 1971. 509
[6] Kemp AR. Factors Affecting the Rotation Capacity of Plastically Designed Members. Struct 510
Eng 1986; 64B(2): 28-35. 511
[7] Richards PW, Uang C-M. Effect of flange width-thickness ratio on eccentrically braced frames 512
link cyclic rotation capacity. J Struct Eng ASCE 2005; 131(10): 1546–1552. 513
[8] Newell JD, Uang C-M. Cyclic behavior of steel wide-flange columns subjected to large drift.” J 514
Struct Eng ASCE 2008; 134(8):1334-1342. 515
[9] Cheng X, Chen Y, Nethercot DA. Experimental study on H-shaped steel beam-columns with 516
large width-thickness ratios under cyclic bending about weak-axis. Eng Struct 2013; 49: 264-517
274. 518
[10] Elkady A, Lignos DG. Analytical investigation of the cyclic behavior and plastic hinge 519
formation in deep wide-flange steel beam-columns. Bull Earthquake Eng. 2015; 13: 1097-520
1118. 521
[11] Fogarty J, El-Tawil S. Collapse resistance of steel columns under combined axial and lateral 522
loading. J Struct Eng ASCE 2015; 142(1): 04015091. 523
[12] Fogarty J, Wu T.-Y., El-Tawil S. Collapse Response and Design of Deep Steel Columns 524
Subjected to Lateral Displacement. J Struct Eng ASCE 2017; 143(9): 04017130 525
[13] Wu T-Y, El-Tawil S, McCormick J. Highly ductile limits for deep steel columns. J Struct Eng 526
ASCE 2018; 144(4): 04018016. 527
[14] Altair Computing. Hypermesh Version 12.0. Troy, MI: Altair Engineering Inc.; 2013. 528
[15] Hallquist J. LS-DYNA. Livermore, CA: Livermore Software Technology Corp; 2013. 529
[16] Engelmann BE, Whirley RG, Goudreau GL. A simple shell element formulation for large-530
scale elastoplastic analysis. In: Noor AK, Belytschko T, and Simo JC, editors. Analytical and 531
computational models of shells. New York: ASME, New York; 1989. 532
[17] Huang Y, Mahin SA. Simulating the inelastic seismic behavior of steel braced frames 533
including the effects of low-cycle fatigue. Rep. No. PEER 2010/104. Berkeley, CA: Pacific 534
Earthquake Engineering Research Center, Univ. of California at Berkeley; 2010. 535
[18] Arasaratnam P, Sivakumaran KS, Tait MJ. True stress-true strain models for structural steel 536
elements. ISRN Civ Eng 2011. http://dx.doi.org/10.5402/2011/656401 537
[19] Wu T-Y, El-Tawil S, McCormick J. Seismic collapse response of steel moment frames with 538
deep columns. J Struct Eng ASCE 2018; 144(9): 04018145. 539
[20] MacRae GA, Carr AJ, Walpole WR. The seismic response of steel frames. Research Rep. No. 540
90-6. New Zealand: Dept. of Civil Engineering, Univ. of Canterbury; 1990. 541
[21] ASTM E8/E8M-15a Standard test methods for tension testing of metallic materials. West 542
Conshohocken, PA: ASTM; 2015. 543
[22] Ozkula G, Harris J, Uang C-M. Observations from cyclic tests on deep, wide- beam-column 544
columns. AISC Eng. J. 2017; 54(1): 45–61. 545
[23] Elkady A, Lignos DG. Full-Scale Testing of Deep Wide-Flange Steel Columns under 546
Multiaxis Cyclic Loading: Loading Sequence, Boundary Effects, and Lateral Stability Bracing 547
Force Demands. J Struct Eng ASCE 2017; 144(2): 04017189. 548
[24] Ozkula G, Harris J, Uang C-M. Classifying Cyclic Buckling Modes of Steel Wide-Flange 549
Columns under Cyclic Loading. Structures Congress 2017: 155-167. 550