行政院國家科學委員會專題研究計畫 成果報告
合作行銷網絡之形成與動態變化
計畫類別: 個別型計畫 計畫編號: NSC93-2416-H-002-009- 執行期間: 93 年 08 月 01 日至 94 年 07 月 31 日 執行單位: 國立臺灣大學國際企業學系暨研究所 計畫主持人: 黃恆獎 計畫參與人員: 江季芸 報告類型: 精簡報告 處理方式: 本計畫可公開查詢中 華 民 國 94 年 12 月 26 日
行政院國家科學委員會補助專題研究計畫
▓ 成 果 報 告
□期中進度報告
合作行銷網路之形成與動態變化
計畫類別:
▓
個別型計畫
□ 整合型計畫
計畫編號:NSC 93-2416-H-002-009
執行期間:93 年 08 月 01 日至 94 年 07 月 31 日
計畫主持人:黃恆獎
共同主持人:
計畫參與人員: 江季芸
成果報告類型(依經費核定清單規定繳交):□精簡報告
▓
完整報告
本成果報告包括以下應繳交之附件:
□赴國外出差或研習心得報告一份
□赴大陸地區出差或研習心得報告一份
□出席國際學術會議心得報告及發表之論文各一份
□國際合作研究計畫國外研究報告書一份
處理方式:除產學合作研究計畫、提升產業技術及人才培育研究計畫、列
管計畫及下列情形者外,得立即公開查詢
□涉及專利或其他智慧財產權,□一年□二年後可公開查詢
執行單位:國立台灣大學
國際企業學系(所)
中
華
民
國
94
年
12 月
23
日
合作行銷網路之形成與動態變化
The Formation and Dynamic Evolution of Co-marketing
Networks
摘
要
配銷密度策略對行銷者而言是非常重要的,因為它會影響一個企業的市場涵蓋範圍、市 場佔有率、以及銷售量。然就實務現狀而言,企業間所運用的配銷密度策略卻不盡相同。過 去已有許多研究曾探究造成這些差異的原因,且其焦點主要著眼於產品與消費者的特質、品 牌策略、以及相關的通路作業實務等議題。然而,至今尚未有研究以客觀的經濟效益以及主 觀的社會關係為主軸來探討配銷密度策略。 本研究試圖以交易成本理論、代理理論、以及社會網絡等觀點來探討配銷密度策略,並 據此發展出一個觀念性架構。在資料蒐集方面,本研究鎖定台灣的電影產業,並以電影配銷 商作為問卷的施測對象。研究結果發現,資產專屬性與配銷密度之間有顯著的負相關;而資 訊蒐集、績效衡量性、以及社會關係三者則與配銷密度之間有顯著的正相關。而配銷密度與 績效之間亦呈現顯著的正相關係。此外,本研究針對交易成本理論、代理理論、以及社會網 絡三者間所提出之四項延伸性假設,全都獲得實證結果之支持。 關鍵字:配銷密度、交易成本理論、代理理論、以及社會網絡觀點。Abstract
Distribution intensity is important for a marketer, because it influences a company’s market coverage, market share, and sales volume. In practice, the degrees of distribution intensity vary remarkably among manufacturers. Some studies have explored how such differences occur from the nature of products and consumer characteristics, brand strategies, and related channel practices, however, no study has explored these differences from objective economy factors and subjective relationship aspects so far.
This study investigates distribution intensity from transaction cost analysis, agency theory, and social network perspective, and develops a conceptual framework. Data collected from movie distributors in Taiwan’s film industry are used to test this conceptual framework. Empirical results show that asset specificity has a significant negative relationship with distribution intensity, and information gathering, measurability and social relations have significant positive relationships with distribution intensity. Besides, distribution intensity has a significant positive relationship with performance. Some extended hypotheses related to transaction cost analysis, agency theory, and social network perspective are all supported by the empirical results.
Key words: distribution intensity, transaction cost analysis, agency theory, and social network
1. Introduction
Most producers do not sell their goods directly to the final users; between them stand a set of intermediaries performing a variety of functions. These intermediaries constitute a distribution channel (Kotler, Ang, Leong, and Tan 2003). Producers can choose various channels to reach their customers. Each channel expectantly reaches a different segment of customers and delivers the right products to each at the minimal cost and efficient ways.
In comparison with company-owned distribution, use of distributors affords advantages of lower capital investment and greater flexibility (Corey, Cespedes, and Rangan 1989; Day and klein 1988), but coordinating relationships with distributors is a challenge (Celly and Frazier 1996). Coordinating channel activities is challenging because manufacturers and retailers have different and potentially conflicting goals and perspectives. (Weitz and Wang 2004).
Manufacturers rely heavily on channel members to perform their marketing programs, whether these programs can be accomplished or not depend largely on the channel members. Therefore, the design of channel structures and the management of channel members are focal tasks faced by the marketers. Frazier and Lasser (1996) are the first scholars who treat distribution intensity as the focal construct and their findings have provide a lot of insights. Several research issues related to distribution intensity should be explored, however, in the past ten years no research has ever focused on distribution intensity again. Owing to this reason, we decide to study distribution
intensity issue and treat it as the focal construct again. For a better studying distribution strategy, we will investigate this issue from transaction cost analysis (TCA), agency theory, and extend to social network perspective aspects. We expect that we could derive an ideal research framework of
distribution strategy after comprehensively considering the relative theories and then propose useful management insights for both of the groves of academy and industry after performing the empirical test.
2. Literature Review
2.1 Marketing Channels and Distribution Intensity
The term marketing channel was first used to describe the existence of a trade channel bridging producers and users (Lewis 1968; Pelton, Strutton, and Lumpkin 2002). Marketing channels
facilitate the exchange process, since marketing focuses on the activities and behaviors necessary for exchange to occur, channels should be though of as exchange facilitators. According to this
exchange relationships that create customer value in the acquisition, consumption, and disposition of products and services.
Companies have to decide the number of intermediaries to be used at each channel level. Three basic strategies are available: exclusive distribution, selective distribution, and intensive distribution (Stern et al 1989; Kotler, Ang, Leong, and Tan 2003; Pelton, Strutton, and Lumpkin 2002). Frazier and Lasser (1996) indicate that distribution intensity has been commonly defined as the number of intermediaries used by a manufacture with its trade areas (cf. Bonoma and Kosnik 1990; Corey, Cespedes, and Rangan. 1989; Stern, El-Ansary, and Brown 1996). Building on prior definitions in the channels literature, Frazier and Lasser (1996) define distribution intensity as the extent to which a manufacturer relies on numerous retailers in each trade area to carry its brand. We adopt and adapt the concepts of Stern, El-Ansary, and Brown (1989), Kotler, Ang, Leong, and Tan (2003), and Pelton, Strutton, and Lumpkin (2002). In this study, we additionally emphasize the concept “a particular intermediary type”and define distribution intensity (market coverage) as the number of outlets of a particular intermediary type established in a given geographic area.
2.2 Transaction cost analysis Perspective
Williamson (1985) suggests that transaction cost analysis poses the problem of economic organization as a problem of contracting. Transaction cost analysis implying that as traders increase their transaction-specific investments, transaction costs of all forms of governance increase
consequently, because traders must safeguard against the hazards of opportunism (Klein, Crawford, and Alchian 1978; Williamson 1985, 1991a; Dyer 1997).
The criterions of organizing commercial transactions are cost economizing and it takes two parts: economizing on production expanse and economizing on transaction costs and this study only consider transaction costs. Companies usually try to set up some safeguarding mechanisms to against the partners’potential opportunistic behaviors, and these mechanisms would increase the transaction costs. Holding the governance structure constant, these two objectives are in tension,
since a reduction in monitoring commonly gives to an increase in opportunism. Therefore,
governance structures could be regarded as the optimization problem. Markets, hierarchies, and the intermediate modes of organization are different governance structures, managers have to choose the most economical governance structure to economize the transaction costs and enhance the transaction efficiency (Williamson 1979).
Given bounded rationality, it is impossible to deal with complexity in all contractually relevant respects. Opportunism is a variety of self-interest seeking but extends simple self-interest seeking to include self-interest seeking with guile (Williamson 1979). If bounded rationality and opportunism are inevitable human failings, then it is impossible for human beings to perform a perfect
transaction.
2.3 Agency Theory Perspectives
Agency theory is directed at prevalent agency relationships in which one party (the principal) delegates work to another party (the agent) who performs that work. In fact, agency theory uses the metaphor of a contract to describe these relationships and the focus of this theory is to determine the most efficient contrast governing (Jensen and Meckling 1976; Eisenhardt 1989; Bergen, Dutta, and Walker 1992). Agency theory attempts to resolve two problems occurring in an agency relationship. The first problem is that it is difficult for the principal to verify whether the agent behaves
appropriately or not. The first problem may occur under (1) the desires or goals of the principal and agent conflict and (2) it is difficult or expensive for the principal to verify what the agent is actually doing. The second problem is risk sharing, it arises when the principal and agent have different attitudes toward risk (Eisenhardt 1989). Overall, the basic agency structure is the relationship between a principle and an agent engaging in cooperative behavior but having different goals and attitudes toward the risk.
Agency theory focuses on the contract relationship between the principal and the agent, and an efficient contract will achieve the expectant goals and bring superior outcome for the principal (or
maybe the joint utility for both the principal and the agent). How could a principal understand if he has accomplished an efficient contrast? How could a principal know if his agent behaves
opportunistically? These questions are postcontractual problems faced by a principal. To explore the postcontractual problems faced by a manufacturer, we will discuss the information gathering, monitoring costs, and outcome measurability issues that are important to the post-distributing contracts.
2.4 Network Perspective
2.4.1 Social Relations
Selecting an appropriate partner is very important to the distribution decision, since a partner’s ability and actual behavior will affect the consequent outcome and the success of an agency
relationship. According to the embeddedness perspective mentioned by Granovetter (1985, p. 490), embedded economic actions are based upon “the widespread preference for transacting with
individuals of known reputation”and “someone is know to be reliable is the information from a trusted informant that he has dealt with that individual before, and even better is the information from one’s own past dealing with that person.”Embedded relationships accumulating into a network will become a growing repository of information on the availability, competencies, and reliability of prospective partners (Kogut, Shan, and Walker 1992; Powell, Koput, and Smith-Doerr 1996; Gulati and Gargiulo 1999). In several Gulati and Gargiulo’s (1999) field interviews, they found that referrals and their associated reputation effects were explicitly mentioned as an important mechanism through which their organizations learned about reliable partners. Thus, personal ties are important for the formation of interorganizational cooperation (Doz 1996), and friendships and longstanding personal connections also affect business connections everywhere (Lohr 1982).
2.4.2 Network Position
The extent of prominence of an actor in a particular social system is highly related to the actor’s involving degree in that system. There are two different prominence concepts: centrality and
prestige, and they represent different network position assumptions. Prominent actors with
centrality position are those who are extensively involved in relationships; prestige actors are those who are extensively the object of relations (Knoke and Burt 1983). Central organizations have a large intelligence web through which they can learn about collaborative opportunities, so lowering their level of uncertainty about partnerships (Gulati 1999; Powell, Koput and Smith-Doerr 1996). Central positions are often associated with power and influence. One’s centrality is increased by virtue of being linked to highly central others (Brass and Burkhardt 1992). Therefore, organizations may seek to enhance their own visibility and attractiveness as potential partners by forming new ties with central actors in the network.
3. Conceptual Framework and Research Hypotheses
3.1 Conceptual Framework
Shown in Figure 1 is the conceptual framework. Three components are seen to have significant main effects on distribution intensity. The first component includes two key factors from transaction cost analysis, and they are asset specificity and completing contract. The second component
includes three key factors from agency theory, and they are information gathering, monitoring costs and measurability. The third component includes two key factors from social network perspective, and they are social relations and network position.
Figure 1 Conceptual Framework
3.2 Research Hypotheses
3.2.1 Hypotheses about Transaction Cost Analysis
Once transaction-specific investment has been made, the traders can exchange efficiently for a considerable period thereafter. However, an investor which invests a high specificity investment would be locked into the transaction to a significant degree, since this investment has a lower value outside the original transaction.
H1: The distribution intensity is lower when a manufacturer invests higher specific asset in certain retailers.
Although decision makers intend to formulate and solve complex problems and process information rationally, this intention may be constrained by their bounded rationality (Simon 1957; Williamson 1981; Rindfleisch and Heide 1997). Under the assumption of bounded rationality, a manufacturer can hardly make a perfect contract with its retailer.
H2: The more easily a manufacturer makes complete distribution contracts with its retailers, the higher is its level of distribution intensity.
3.2.1 Hypotheses about Agency Theory
A principal needs to gather the relevant information about the potential agents so as to know the characteristics, capabilities, and reputation of those potential agents and then select appropriate partners to achieve its tasks and goals. Though a principal is assumed to be aware of everything about the agent that he chooses, his knowledge about that agent is neither perfect nor complete.
H3: The more easily a manufacturer gathers information about the potential retailers, the higher is its level of distribution intensity.
Agency problem arises when the desires or goals of the principal and agent conflict (Eisenhardt 1989), however this problem could hardly be resolved perfectly because people are assumed to be self-interest. If both parties to the relationship are utility maximizers, we could believe that the agent will not always act in the best interests of the principal. The principal can limit divergences from his interest by establishing appropriate incentives for the agent and by incurring monitoring costs designed to limit the aberrant activities of the agent (Jensen and Meckling 1976).
H4: The higher a manufacturer’s monitoring costs, the lower its level of distribution intensity.
When the difficulty of performance measurement is quite high, a principal must design
complex measurement methods to evaluate the agent’s performance. However, not all the principals have the ability to design such methods and not all the measurability of performance can be defined clearly. The difficulty of performance measurability will affect a principal’s managerial ability. That is, if the performance measurability is unclear and complicate, a manufacturer can hardly deal with many retailers simultaneously, it had better concentrate on certain distribution relationships, vice versa.
H5: The easier the performance measurability, the higher a manufacturer’s level of distribution intensity.
3.2.3 Hypotheses about Social network Aspect
People prefer to transact with individuals of known reputation, and the reputation information about a certain individual may come from a trusted informant that he has dealt with that individual or come from one’s own past experience with that person (Granovetter 1985). Personal ties are important for the formation of interorganizational cooperation (Doz 1996), and friendships and longstanding personal connections also affect business connections everywhere (Lohr 1982). The social relations of a manufacturer and its managers will influence it distribution intensity strategies.
H6: The more social relations a manufacturer and its managers have, the higher is a manufacturer’s level of distribution intensity.
The position an organization occupies in a network (industry) can influence its ability to access fine-grained information about potential partners as well as its visibility and attractiveness for other organizations throughout the network (industry). Because network centrality is a direct function of organizations’involvement in strategic alliances, it can also be a signal of their willingness,
experience, and ability to establish partnerships (Gulati and Gargiulo 1999). The signal property of network positions is particularly important in uncertain environments, because it introduces
systemic reputational differences among organizations that extend beyond their immediate circle of direct and indirect ties (Podolny 1993; Han 1994; Podolny and Stuart 1995; Gulati and Gargiulo 1999).
H7: The higher a manufacturer’s network position, the higher its level of distribution intensity.
3.2.4 Hypotheses about the Relationship between Distribution Intensity and
Performance
intensive distribution in order to enhance their market coverage and sales volume. However, for some high quality and specialty goods, this strategy may increase the short term performance but decrease the long term performance since mass marketing often results in brand image dilution (Kotler, Ang, Leong, and Tan 2003; Pelton, Strutton, and Lumpkin 2002).
H8: For general products, the higher a manufacturer’s level of distribution intensity, the higher its performance.
3.2.5 Hypotheses between Transaction cost Analysis and Agency Theory
From the contract perspective mentioned above, we could conjecture that the degree of asset specificity will influence the relationship between exchange partners and the forms of trading contracts. Transaction costs are increased as the transactors increase their investments in specific assets, since they have to safeguard against the hazards of opportunism (Williamson 1985). The larger the appropriable specialized quasi rents and the larger the premium payments necessarily to prevent contractual reneging, the more costly the implicit contractual solution will be. Since
safeguard mechanisms are designed to monitor transactors’behavior, reduce opportunistic behavior, and evaluate the final performance, therefore, I conjecture that “asset specificity”will influence “complete contract”, “monitoring cost”and “measurability”. The related hypotheses are as follows.
H9: The higher the asset specificity, the more difficult a manufacturer makes complete distribution contracts with its retailers.
H10: The higher the asset specificity, the higher a manufacturer’s monitoring cost.
H11: The higher the asset specificity, the more complicated a manufacturer evaluates the behavior and performance of its retailers.
3.2.6 Hypothesis between Social Relations and Network Position
Most prominent or important actors usually locate in strategic locations within the network (Wasserman & Faust, 1994). There are different definitions about network centrality, for example,
degree centrality calculates directional relations; closeness centrality calculates both direct and indirect relations; and betweenness centrality considers the extent to which a actor locates on the shortest paths between other pairs and connects them (Freeman, 1979 Brass & Burkhardt, 1992; Wasserman & Faust, 1994). Doubtlessly, an actor with many social relations in a network will becomes an important actor in that network and possesses a higher network position.
H12: The more social relations that a manufacturer has, the higher its network position is.
4. Research Method
4.1 Characteristics of Taiwan’
s Film Industry and Data Collection
We choose the movie distributors to be the sample of this study. General speaking, if a movie distributor exhibits its films through a lot of exhibitors (theaters), it has higher distribution intensity.
There are three major parts in the film industry: movie production, movie distribution, and movie exhibition. In the film industry, the main task of a movie producer is to product films and the focal task of a movie distributor is to arrange the movie exhibition contracts and activities, hence, we collect empirical data from movie distributors and not from movie producers to examine the related distribution intensity hypotheses. Therefore, “movie distributor”can be a substitute for the general “manufacturer”in the related study. We should not be confused by the terminology.
The movie distributors rely on price discrimination over time by showing the film first at a high price to audiences who are eager to see it in first-run theatres, then at successively lower prices to less eager consumers in second-run theaters, premium cable channels (e.g., HBO), video stores (for rental and/or sale), and network and local television (Caves 2000, Lehmann and Weinberg 2000). In this study, we will only concentrate on the distribution channel of the first-run theaters and we will only study the Taipei city area.
There were 284 movies exhibited in Taiwan’s film market in 2004, 234 were foreign films and 51 were domestic films of Taiwan. The total box-office revenue in Taiwan approximated to 2.6
billion NT dollars, and the box-office revenue of domestic films was 0.1 billion NT dollars. The foreign films dominated the film market of Taiwan. There were 51 movie distributors that arranged the exhibiting contracts of the 284 movies in 2004, and these 51 distributors became the sample frame of this study, that is, the sample frame is the actual population of Taiwan’s film industry.
Some questionnaires were sent by fax, some by e-mail, and some by mail, and the final sample consisted of 43 distributors of the film market of Taiwan in 2004 and the return rate was 84%. The sample size included 43 distributors, and it could represent the overall distributors in the film industry of Taiwan sufficiently.
4.2 Analytical Method
Wold’s Partial Least Squares (PLS) method (see Fonell and Cha, 1994; Chin and Newsted, 1999; Fornell and Bookstein, 1982) is a useful alternative to Covariance-based SEM. PLS can be a powerful method of analysis because of the minimal demands on measurement scales, sample size, and residual distributions (Wold 1985; Chin and Newsted, 1999), hence, this method is usually termed “soft modeling”. LS (Least Squares) estimation is distribution-free, except for predictor specification, and does not require independence of observations. Predictor specification can be summarized as a linear conditional expectation relationship between dependent and independent variables, and LS modeling based upon predictor specification is prediction-oriented (Wold 1985). That is, the variance-based approach of PLS shifts the orientation from casual model/theory testing to component-based predictive modeling (Chin and Newsted 1999).
In some situations, there are many variables but not necessarily many samples and
observations. PLS is considered especially useful for constructing prediction equations in such situations (Höskuldsson 1988; Garthwaite 1994), and the sample range of minimal
recommendations is from 30 to 100 cases (Chin and Newsted, 1999). Although this study had only 43 samples, it could use PLS method to analyze the data appropriately.
(2) outer relations, and (3) weight relations (see Fonell and Cha 1994). PLS models make several types of predictions, and there are different fit indices for testing the predictive relevance of the model. The critical indices are communality, structural prediction, validity, redundancy, and operational variance (see Lohmöller 1989; Fonell and Cha 1994).
This study uses Jackknife technique to assess parameter significance. The Jackknife technique construct the distribution of parameter estimates without assumptions on the distribution of the variables involved. This is done by estimating the parameters N times in a data set with N observations, each time cutting off just one observation. The N estimates for the same parameter, then, are used to compute the mean, the standard deviation, and other distributional characteristics of that parameter (Lohmöller 1984).
5. Data Analysis
5.1 Preliminary Analysis
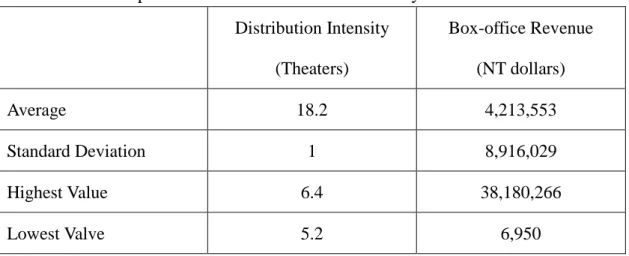
This study used empirical movie exhibition data as the index of distribution intensity. There are twenty three first-run theaters in Taipei city. We found that each movie distributor had its fixed and unique exhibition pattern.The descriptive statistics of distribution intensity and box-office revenue are summarizeed in Table 1.
Table 1 the Descriptive Statistics of Distribution intensity and Box-office Revenue Distribution Intensity (Theaters) Box-office Revenue (NT dollars) Average 18.2 4,213,553 Standard Deviation 1 8,916,029 Highest Value 6.4 38,180,266 Lowest Valve 5.2 6,950
5.2 Hypotheses Testing
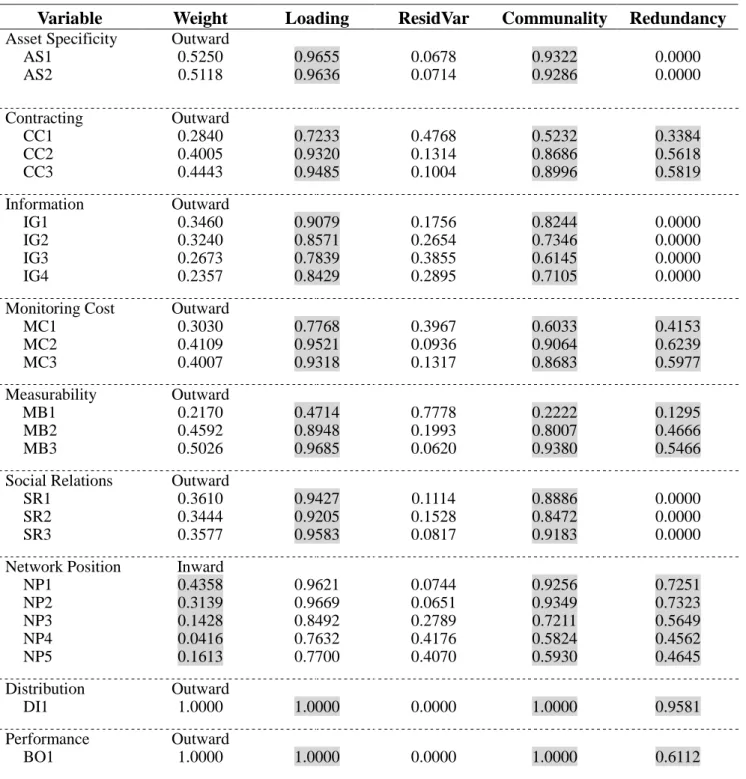
5.2.1 Outer Relations (Measurement Model)
MV-LV relationship, except one manifest variable belonging to measurability, most manifest variables’loadings are higher than 0.72, and these loadings are consistent in sign, and the residual variances are generally small. Most communality of the manifest variables of each latent variable is generally high. The redundancy coefficients of manifest variables of complete contracting,
monitoring cost, measurability, network position, distribution intensity, and performance are different apparently.
Table 2 Parameter Estimates of Measurement Models
Variable Weight Loading ResidVar Communality Redundancy Asset Specificity AS1 AS2 Outward 0.5250 0.5118 0.9655 0.9636 0.0678 0.0714 0.9322 0.9286 0.0000 0.0000 Contracting CC1 CC2 CC3 Outward 0.2840 0.4005 0.4443 0.7233 0.9320 0.9485 0.4768 0.1314 0.1004 0.5232 0.8686 0.8996 0.3384 0.5618 0.5819 Information IG1 IG2 IG3 IG4 Outward 0.3460 0.3240 0.2673 0.2357 0.9079 0.8571 0.7839 0.8429 0.1756 0.2654 0.3855 0.2895 0.8244 0.7346 0.6145 0.7105 0.0000 0.0000 0.0000 0.0000 Monitoring Cost MC1 MC2 MC3 Outward 0.3030 0.4109 0.4007 0.7768 0.9521 0.9318 0.3967 0.0936 0.1317 0.6033 0.9064 0.8683 0.4153 0.6239 0.5977 Measurability MB1 MB2 MB3 Outward 0.2170 0.4592 0.5026 0.4714 0.8948 0.9685 0.7778 0.1993 0.0620 0.2222 0.8007 0.9380 0.1295 0.4666 0.5466 Social Relations SR1 SR2 SR3 Outward 0.3610 0.3444 0.3577 0.9427 0.9205 0.9583 0.1114 0.1528 0.0817 0.8886 0.8472 0.9183 0.0000 0.0000 0.0000 Network Position NP1 NP2 NP3 NP4 NP5 Inward 0.4358 0.3139 0.1428 0.0416 0.1613 0.9621 0.9669 0.8492 0.7632 0.7700 0.0744 0.0651 0.2789 0.4176 0.4070 0.9256 0.9349 0.7211 0.5824 0.5930 0.7251 0.7323 0.5649 0.4562 0.4645 Distribution DI1 Outward 1.0000 1.0000 0.0000 1.0000 0.9581 Performance BO1 Outward 1.0000 1.0000 0.0000 1.0000 0.6112
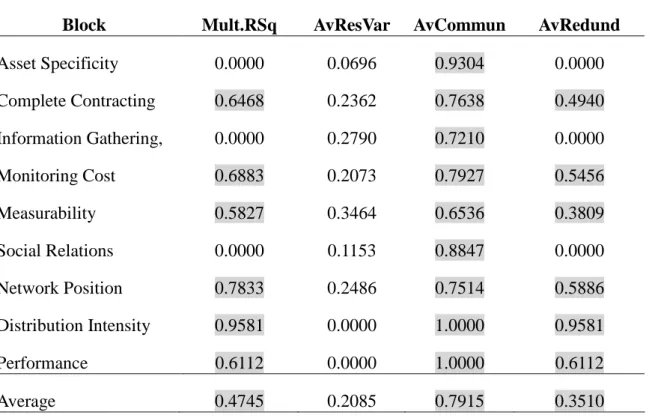
5.2.2 Inner Relations (Structural Model)
Table 3 contains the PLS parameters for the structural models. The average of the
communalities of all the manifest variables is 0.7915, it is calculated as the communality of an overall model; that is, the overall model of this study has an appropriate overall communality.
R2represents the explanatory power of structural models. The average redundancy coefficients among blocks (endogenous variables) are different apparently. The redundancy coefficient of the overall model is 0.3510. According to the empirical results, the structural models of this study have reasonable precision.
Table 3 Parameter Estimates of Structural Models
Block Mult.RSq AvResVar AvCommun AvRedund
Asset Specificity 0.0000 0.0696 0.9304 0.0000 Complete Contracting 0.6468 0.2362 0.7638 0.4940 Information Gathering, 0.0000 0.2790 0.7210 0.0000 Monitoring Cost 0.6883 0.2073 0.7927 0.5456 Measurability 0.5827 0.3464 0.6536 0.3809 Social Relations 0.0000 0.1153 0.8847 0.0000 Network Position 0.7833 0.2486 0.7514 0.5886 Distribution Intensity 0.9581 0.0000 1.0000 0.9581 Performance 0.6112 0.0000 1.0000 0.6112 Average 0.4745 0.2085 0.7915 0.3510
5.2.3 Hypotheses Tests
(1) Direct Effects:There are twelve hypotheses in this study; it implies that there are twelve paths need to be tested. 8 of the twelve hypotheses are the antecedents which would affect distribution intensity, 1 is the relationship between distribution intensity and performance, and 4 are extended hypotheses that
explore the relationships between critical variables of the related theories. The path coefficients and related t-statistic are shown in Table 4 and Table 5, respectively. I will discuss the empirical results of each hypothesis as follows.
Table 4 Path Coefficients
Asset Contract Inform Monitor Measure Social Network Distribu Perform
A sset 0.000 0.000 0.000 0.000 0.000 0.000 0.000 0.000 0.000 C o ntract -.804*** 0.000 0.000 0.000 0.000 0.000 0.000 0.000 0.000 I nform 0.000 0.000 0.000 0.000 0.000 0.000 0.000 0.000 0.000 M onitor .830*** 0.000 0.000 0.000 0.000 0.000 0.000 0.000 0.000 M easure -.763** 0.000 0.000 0.000 0.000 0.000 0.000 0.000 0.000 S ocial 0.000 0.000 0.000 0.000 0.000 0.000 0.000 0.000 0.000 N etwork 0.000 0.000 0.000 0.000 0.000 .885*** 0.000 0.000 0.000 D istribute -.175** .123 .134** .071 .214*** .424** .074 0.000 0.000 P erform 0.000 0.000 0.000 0.000 0.000 0.000 0.000 .782*** 0.000 *p<0.1, **p<.05, ***p<.01
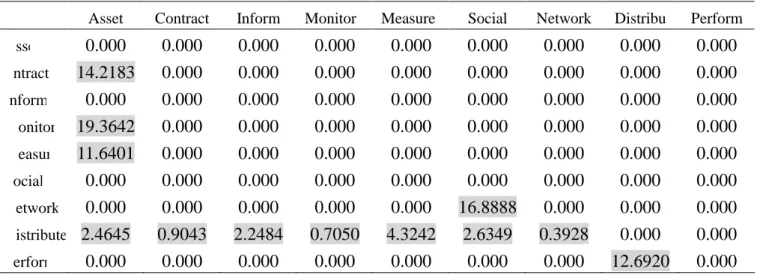
Table 5 T-Statistic of Path Coefficients
Asset Contract Inform Monitor Measure Social Network Distribu Perform
A sset 0.000 0.000 0.000 0.000 0.000 0.000 0.000 0.000 0.000 C o ntract 14.2183 0.000 0.000 0.000 0.000 0.000 0.000 0.000 0.000 I nform 0.000 0.000 0.000 0.000 0.000 0.000 0.000 0.000 0.000 M onitor 19.3642 0.000 0.000 0.000 0.000 0.000 0.000 0.000 0.000 M easure 11.6401 0.000 0.000 0.000 0.000 0.000 0.000 0.000 0.000 S ocial 0.000 0.000 0.000 0.000 0.000 0.000 0.000 0.000 0.000 N etwork 0.000 0.000 0.000 0.000 0.000 16.8888 0.000 0.000 0.000 D istribute 2.4645 0.9043 2.2484 0.7050 4.3242 2.6349 0.3928 0.000 0.000 P erform 0.000 0.000 0.000 0.000 0.000 0.000 0.000 12.6920 0.000
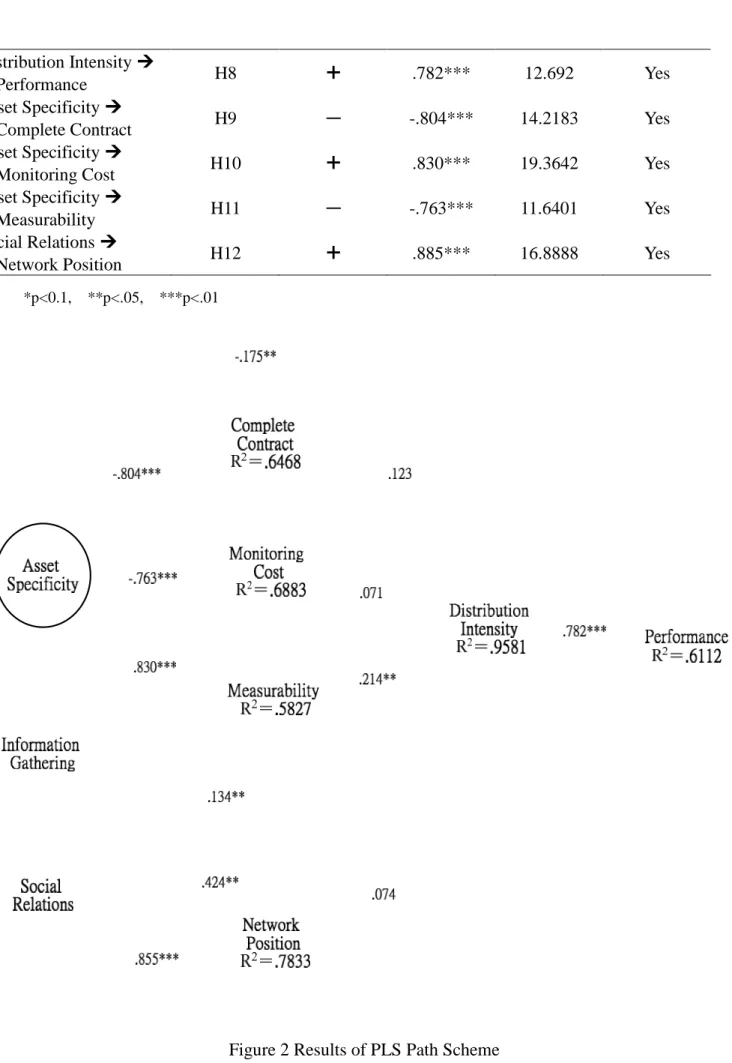
Nine of the twelve path coefficients are significant at the .05 level and support the hypotheses; three of the twelve path coefficients are not significant. Asset specificity has a significant inverse relationship with distribution intensity (path coefficient = -.175, p<.05), providing support for H1. Complete contract has positive relationship with distribution intensity; however, the parameter is not significant and H2 is not supported. H3 is supported, because information gathering has a significant positive relationship (path coefficient =.134, p<.05) with distribution intensity.
Monitoring cost has a nonsignificant inverse relationship with distribution intensity, so H4 is not supported. Measurability has a significant positive relationship (path coefficient =.214, p<.01) with distribution intensity, hence H5 is supported.
H6 is supported, because social relations has a significant positive relationship with
distribution intensity (path coefficient = .424, p<.01). H7 is not supported, because the relationship between network position and distribution intensity is not significant. H8 is supported, because distribution intensity has a significant positive relationship with performance (path coefficient = .782, p<.01). All the extended hypotheses are supported. Asset specificity has a significant inverse relationship with complete contract, asset specificity has a significant positive relationship with monitoring cost (path coefficient = .830, p<.01), and asset specificity has a significant inverse relationship with measurability (path coefficient = -.763, p<.01); therefore H9, H10, and H11 are supported. H12 is supported, because social relations has a significant positive relationship with network position (path coefficient = .885, p<.01).
The results of these hypotheses tests are summarized in Table 6, and the results of PLS path scheme are depicted in Figure 2.
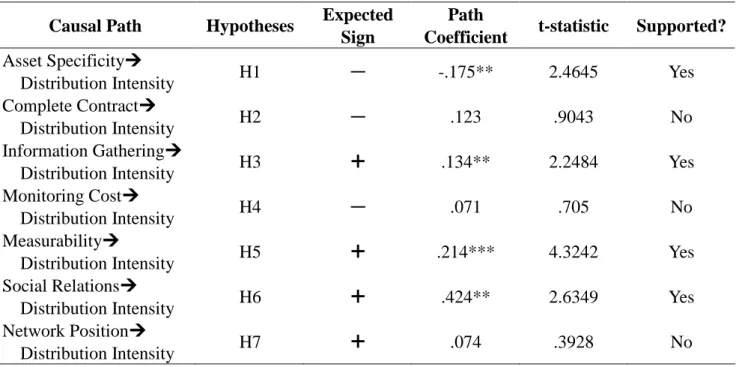
Table 6 Results of Hypotheses Tests
Causal Path Hypotheses Expected Sign
Path
Coefficient t-statistic Supported?
Asset Specificity
Distribution Intensity H1 ― -.175** 2.4645 Yes
Complete Contract
Distribution Intensity H2 ― .123 .9043 No
Information Gathering
Distribution Intensity H3 .134** 2.2484 Yes
Monitoring Cost
Distribution Intensity H4 ― .071 .705 No
Measurability
Distribution Intensity H5 .214*** 4.3242 Yes
Social Relations
Distribution Intensity H6 .424** 2.6349 Yes
Network Position
Distribution Intensity
Performance H8 .782*** 12.692 Yes
Asset Specificity
Complete Contract H9 ― -.804*** 14.2183 Yes
Asset Specificity
Monitoring Cost H10 .830*** 19.3642 Yes
Asset Specificity
Measurability H11 ― -.763*** 11.6401 Yes
Social Relations
Network Position H12 .885*** 16.8888 Yes
*p<0.1, **p<.05, ***p<.01
(2) Indirect Effects:
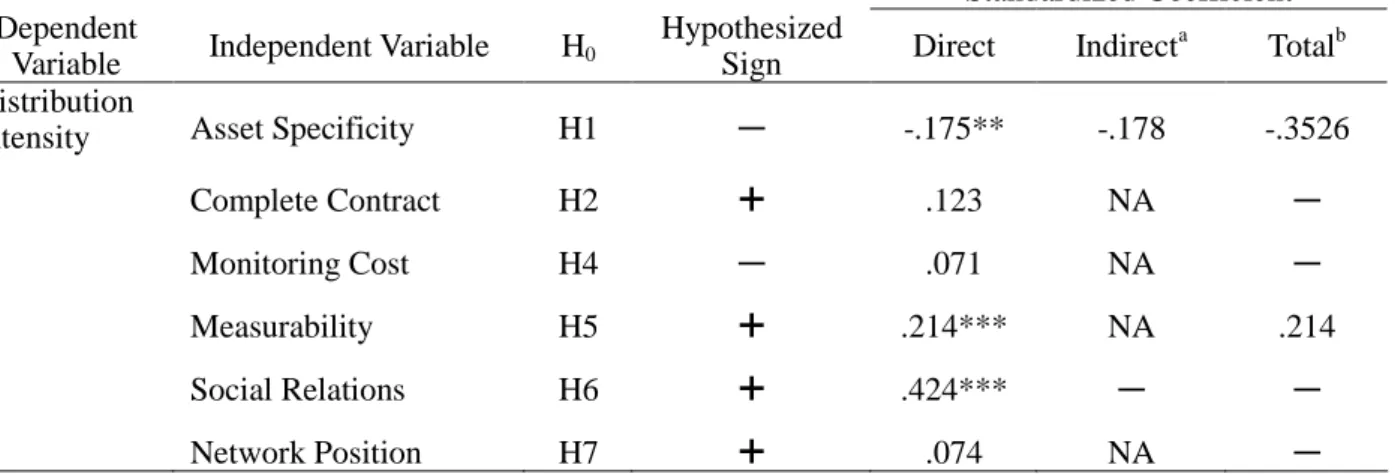
We examine how complete contract, monitoring cost and measurability mediate the relationship between asset specificity and distribution intensity, and how network position mediates the relationship between social relations and distribution intensity. This analysis is based on the approach suggested by Baron and Kenny (1986), and Sarkar et al. (2001). Only statistically significant indirect effects are included in the computation and the total effects only include statistically significant direct and indirect effects. Complete contract and monitoring cost do not significantly mediate the relationship between asset specificity and distribution intensity, and network position does not significantly mediate the relationship between social relations and distribution intensity. Only measurability significantly
mediates the relationship between asset specificity and distribution intensity, and the size of the indirect effects is -.178. These results summarize in Table 7.
The indirect effects indicate that any neglect of these variables from the theoretical framework could lead to an underestimate of the total effects of asset specificity on distribution intensity. Asset specificity could influence distribution intensity directly, however, it could also influence distribution intensity indirectly through the mediating effect of measurability, and the total effects become larger.
Table 7 Direct, Indirect, and Total Effects of Asset Specificity and Social Relations on Distribution Intensity
Standardized Coefficient Dependent
Variable Independent Variable H0
Hypothesized
Sign Direct Indirect
a
Totalb Distribution
Intensity Asset Specificity H1 ― -.175** -.178 -.3526 Complete Contract H2 .123 NA ― Monitoring Cost H4 ― .071 NA ― Measurability H5 .214*** NA .214 Social Relations H6 .424*** ― ― Network Position H7 .074 NA ―
Note: NA=not applicable
a. Only statistically significant indirect effects are included in the computation.
b. Only statistically significant effects (direct and indirect) are included in the computation. *p<0.1, **p<.05, ***p<.01
6. Conclusion
This study examines distribution intensity from transaction cost analysis, agent theory, and social network position aspects, and the conceptual framework is supported by considerable empirical results. It implies that, besides the traditional perspectives, managers shall consider other factors and make better distribution intensity strategy. Conventionally, scholars usually measure distribution intensity and performance through subjective investigation. This study uses empirical data as measures and has well empirical results. Therefore, this study combines the subjective and objective measures and could be a fair example for future research.
There is a trade off between asset specificity and distribution intensity. A manufacturer may want to invest specific assets on its certain retailers so as to improve the operational efficiency. However, this decision may cause itself to be locked in certain relationships. A manufacturer has to consider how its asset specificity decision influences its distribution intensity strategy and
consequent market coverage and sales revenue.
The empirical results support that the distribution intensity and performance have a significant positive relationship, so for general consumer products, it would be better for a manufacturer to increase its level of distribution intensity. According to this study’s theoretical framework and empirical results, our advices are as in the following. A company must try to gather information about potential partners and environment from as many channels as possible, since sufficient information would help a company to understand all conditions about a transaction, and it could make adequate and comprehensive contracts with its partners. Besides, managers have to improve their negotiation and drafting capability to make better contracts. Superior capability to gather information and make contracts could facilitate a company to cooperate with potential partners, and it will improve a company’s ability to implement more intensive distribution strategy.
A company has to enhance its managerial and supervisory capability, because it can improve the monitoring efficiency and than reduce the monitoring cost. A company also needs to build
standardized and objective criterions. Through such evaluative rules, its partners could know how to behave and a company can evaluate its partners easily.
Finally, a company should build well social relations with its potential partners and improve its network position with in its industry. When a company keeps close relationships with other
organizations or related people, it will have more chances to find out new business opportunities. When a company has prominent network position, it will attract a lot of organizations to cooperate with it. It will be easily for a manufacturer with rich social relations and prominent network position to increase its level of distribution intensity.
Reference
Baron, R. M. and D. A. Kenny (1986),“TheModerator-Mediator Variable Distinction in Social Psychology Research:Conceptual,Strategic,and StatisticalConsiderations,”Journalof Penality and Social Psychology Copyright, 51 (6), pp. 1173-1182.
Bergen, Mark, Dutta, Shantanu, Walker, Orville C., Jr. (1992), “Agency Relationships in Marketing: A Review of the Implications and Applications of Agency and Related Theories,”Journal of Marketing, 56 (3), pp. 1-24.
Bonoma, Thomas V. and Kosnik, Thomas J. (1990), Marketing Management: Text and Cases. Homewood, IL: Richard D. Irwin.
Brass, D. J. & Burkhardt, M. E. (1992), “Centrality and Power in Organizations, pp. 191-215 in Networks and Organizations: Structure, Form and Action, edited by N. Nohria and R. Eccles. Boston: Harvard Business School Press.
Brass, D. J. & Burkhardt, M. E. (1992), “Centrality and Power in Organizations, pp. 191-215 in Networks and Organizations: Structure, Form and Action, edited by N. Nohria and R. Eccles. Boston: Harvard Business School Press.
Celly, K. S. and Frazier, G. L. (1996), “Outcome-Based and Behavior- Based Coordination Efforts in Channel Relationships,”JournalofMarketing Research,33 (2),pp.200-210
Chin, W. Y. W and Newsted, P. R. (1999), “Structural Equation Modeling Analysus with Small Samples Using Partial Least Squares.”Pp. 307-341 in Statistical Strategies for Small Sample Research. Sage Publications, Thousand Oaks, CA.
Corey, E. R., Cespedes, F. V. and Rangan V. K. (1989). Going to Market: Distribution Systems for Industrial Products. Boston: Harvard Business School Press.
Day, G. and klein, S. (1988), “Cooperative Behavior in Vertical Markets,”in Review of Marketing, Vol. 3, Michael Houston, ed. Chicago: American Marketing Association, pp. 39-66.
Maximise Transaction Value,”Strategic Management Journal, 18 (7), pp. 535-556. Eisenhardt, Kathleen M. (1989), “Agency Theory: An Assessment and Review,”Academy of
Management Review, 14, pp. 57-74.
Fornell, Claes and Bookstein, Fred L. (1982), “Two Structural Equation Models: LISREL and PLS Applied to Consumer Exit-Voice Theory,”Journal of Consumer Research, 19 (November), pp. 440-452.
Fornell, Claes and Cha, Jaesung (1994), Partial Least Squares. Pp. 52-78 in: R. P. Bagozzi (Ed.) Advanced Methods in Marketing Research. Cambridge, MA, B. Blackwell.
Frazier, Gary L. and Lassar, Walfried M. (1996), “Determinants of Distribution Intensity,”Journal of Marketing, 60 (4), pp. 39-51.
Freeman, L. C. (1979), “Centrality in Social Network: Conceptual Clarification,”Social Networks, 1, 215-239.
Garthwaite, Paul H. (1994), “An Interpretation of Partial Least Squares,”Journal of the American Statistical Association, 89 (425), pp.122-127.
Granovetter, Mark (1985), “Economic Action and Social Structure: The Problem of Embeddedness,”American Journal of Sociology, 91, 481-510.
Gulati, Ranjay & Gargiulo, Martin (1999), “Where Do Interorganizational Networks Come From?”The American Journal of Sociology, 104 (5), pp. 1439-1493.
Gulati, Ranjay (1999), “Network Location and Alliance Formation,”Strategic Management Journal, 20, 397–420.
Höskuldsson, Agnar (1988), “PLS Regression Methods,”Journal of Chemometrics, 2 (3), pp. 211-228.
Jensen,Michaeland W.Meckling,(1976),“Theory of the Firm: Managerial Behavior, Agency Costs,and CapitalStructure,”JournalofFinancialEconomics,3 (October),pp.305-360. Klein, B., Crawford, R. G. and Alchian,A.A.(1978),“VerticalIntegration,CompetitiveRentsand
theCompetitiveContracting Process,”JournalofLaw and Economics,21,pp.297-326.
Knoke,David,and Ronald S.Burt.1983."Prominence.”pp.195-222 in Applied Network Analysis: A Methodological Introduction, edited by Ronald S. Burt and Michael J. Minor. Beverly Hills: Sage Publications.
Kogut, Bruce, Weijan Shan, and Gordon Walker, (1992), “Competitive Cooperation in
Biotechnology: Learning through Networks?” Pp. 348-365 in Networks and Organizations: Structure, Form, and Action, edited by N. Nohria and R. Eccles. Boston: Harvard Business School Press.
Kotler, Philip, Ang, Swee Hoon, Leong, Siew Meng, and Tan, Chin Tiong (2003), Marketing Management: an Asian Perspective, 3rded. Singapore; New York: Prentice Hall.
Lehmann,Donald R.and Weinberg,CharlesB.(2000),“Sales Through Sequential Distribution Channels: An Application to Movies and Videos,” JournalofMarketing,64 (July),pp.18-33. Lewis, Edwin E. (1968), “Marketing Channels: Structure and Strategy,”Perspectives in Marketing
Series, Robert D. Buzzell and Frank M. Bass, eds., New York, NY: McGraw-Hill.
Pelton, Lou E., Strutton, David, and Lumpkin, James R. (2002), Marketing Channels: a Relationship Management Approach, International Edition,McGraw-Hill.
Podolny Joel M. (1993), “A Status-Based Model of Market Competition,”American Journal of Sociology, 98, 829-872.
Podolny Joel M. and Toby E. Stuart (1995), “A Role-Based Ecology of Technological Change,” American Journal of Sociology, 100 (5), 1224-1260.
Powell, Walter W., Kenneth Koput & Laurel Smith-Doerr (1996), “Inter-Organizational Collaboration and the Locus of Innovation: Networks of Learning in Biotechnology,” Administrative Science Quarterly, 41, pp. 116-145.
Rindfleisch, Aric and Heide, Jan B. (1997), “Transaction Cost Analysis: Past, Present, and Future Applications,”Journal of Marketing, 61 (4), 30-54.
Sarkar,M. B., R. Echambadi, S. T. Cavusgil, and P. S. Aulakh (2001),“The Influence of Complementarity, Compatibility, and Relationship Capital on Alliance Performance,” Journal of the Academy of Marketing Science, 29 (4), pp. 358-373.
Simon, Herbert A. (1957), Models of Man. New York: John Wiley and Sons.
Stern, Louis W., El-Ansary, Adel I. and Brown, James R. (1989). Management in Marketing Channels, Englewood Cliffs, N. J.: Prentice Hall.
Stern, Louis W., El-Ansary, Adel I. and Coughla (1996). Marketing Channels, 5thed. Upper Saddle Creek, N. J.: Prentice Hall.
Wasserman, Stanley and Faust, Katherine (1994), Social Network Analysis: Methods and Applications, Cambridge University.
Weitz, Barton, and Wang, Qiong (2004), “Vertical Relationships in Distribution Channels: a Marketing Perspective,”Antitrust Bulletin, 49 (4), pp. 859-876.
Williamson, Oliver E. (1979), “Transaction cost analysis: The Governance of Contractual Relations,”Journal of Law and Economics, 22 (October), pp. 233-261.
Williamson,OliverE.(1985),“CorporateFinance and CorporateGovernance,”JournalofFinance, 43 (3), pp.567-591.
Williamson, Oliver E. (1985), The Economic Institutions of Capitalism. New York: Free Press. Williamson, Oliver E.(1991a),“Strategizing,Economizing,and Economic Organization,”Strategic
Management Journal, 12 (Winter), pp.75-94.
Wold, H. (1985), “Predictor Specification Specification.”Pp. 587-599 in S. Kotz and N. L. Johnson (eds), Encyclopedia of Statistical Sciences, Vol. 8, New York: