行政院國家科學委員會專題研究計畫 成果報告
電子行銷典範--子計畫四:網路行銷研究之探討:建立、驗
證及應用(3/3)
研究成果報告(完整版)
計 畫 類 別 : 整合型 計 畫 編 號 : NSC 95-2416-H-004-002- 執 行 期 間 : 95 年 08 月 01 日至 96 年 07 月 31 日 執 行 單 位 : 國立政治大學企業管理學系 計 畫 主 持 人 : 樓永堅 共 同 主 持 人 : 別蓮蒂、張愛華 計畫參與人員: 博士班研究生-兼任助理:蔡孟君、邱亞康 報 告 附 件 : 出席國際會議研究心得報告及發表論文 處 理 方 式 : 本計畫可公開查詢中 華 民 國 96 年 11 月 01 日
行政院國家科學委員會補助專題研究計畫成果報告
電子行銷典範--子計畫四:網路行銷研究之探討:
建立、驗證及應用(3/3)
計畫類別:□ 整合型計畫
計畫編號:
NSC 95-2416-H-004-002
執行期間:2006/08/01 ~ 2007/07/31
計畫主持人:樓永堅
共同主持人:別蓮蒂
計畫參與人員: 邱亞康
、
黃增隆
、
蔡孟君
成果報告類型(依經費核定清單規定繳交):□完整報告
本成果報告包括以下應繳交之附件:
□赴國外出差或研習心得報告一份
□赴大陸地區出差或研習心得報告一份
□出席國際學術會議心得報告及發表之論文各一份
□國際合作研究計畫國外研究報告書一份
處理方式:除產學合作研究計畫、提升產業技術及人才培育研究
計畫、列管計畫及下列情形者外,得立即公開查詢
□涉及專利或其他智慧財產權,二年後可公開查詢
執行單位:國立政治大學企業管理學系
中 華 民 國 96 年 10 月 31 日
ABSTRACT
This study was aimed to examine the difference between web-based and
traditional paper-and-pencil survey modes from college students’ course evaluation data. The results revealed that the proportions of extremely positive answers are not significant higher in paper-and-pencil questionnaires than web-based ones.
Regarding to the proportions of selecting midpoint scale, the result showed that the proportion of selecting midpoint was unexpectedly higher in the web-based
questionnaire than the paper-and-pencil questionnaire. Eventually, respondents in the paper-and-pencil questionnaire were more satisfied with instructors’ teaching and the difference reached significance level. Based on the results, the reliability and validity of a web-based survey is somehow verified because the results are no different from, or even better than the conventional paper-and-pencil one which has been used in years. Implications derived from this study could contribute to future consumer and international researches.
Keywords: paper-and-pencil questionnaires, web-based questionnaires, course
IS THE WEB-BASED SURVEY AS VALID AS
THE PAPER-AND-PENCIL ONE?
Introduction
The Internet and World Wide Web are incredibly popular at schools and home
alike. With advancement of Web-developing tools, the use of web-administered
surveys by colleges and universities is becoming more prevalent. Accordingly, the
Internet can be considered a new instrument for data collection and many researchers
as well as practitioners have begun to pay much attention to this new research method.
Gosling, Vazire, Srivastava, and John (2004) argue that there are three reasons why
web-based surveys are interesting as a research subject to academic and commercial
researchers. First, one major incentive is that web-based methods can provide access
to samples beyond the reach of methods typically used in academic research.
Secondly, potential benefit is the efficiency with which Internet data can be collected.
Computerized administration, for instance, allows researchers to obtain sample sizes
that far exceed those obtained with most traditional techniques such as
paper-and-pencil format. Finally, compare with paper-and-pencil mode, web-based
In order to attempts to fill this knowledge about understanding (dis)advantages
of web-based surveys, many studies were conducted to compare the psychometric
qualities of traditional and new research methods, such as paper-and-pencil surveys,
and web-based surveys (e.g. Bachmann, Elfrink, and Vazzana 1996; Layne,
DeCristoforo, and McGinty 1999; Meade and Michels, and Lautenschlager 2004;
Kaplowitz, Hadlock, and Levine 2004; Smither, Walker, and Yap 2004). Bachmann
et al. (1996) determine if web-based surveys could be used a surrogate for traditional
paper-and-pencil surveys, they test for significant differences in the responses of the
two modes and no differences are found at the 0.05 level. Ployhart, Weekley, Holtz,
and Kemp (2003) find that relative to the applicants completing the paper-and-pencil
measures, the Web-based measures showed better distributional properties, lower
means, more variance, higher internal consistency reliabilities, and stronger
inter-correlations. Kaplowitz et al. (2004) suggest that, in a population in which
each member has Web access, a Web survey application can achieve a comparable
response rate to a questionnaire delivered by surface mail. Several studies also have
confirmed that there are virtually no difference between web-based and
paper-and-pencil surveys in observed scores for faculty evaluations (Layne et al.
1999), socially desirable responding (Meade et al. 2004), and self-monitoring
significant difference between web-based and mail surveys on response quality.
Obviously, most of previous researches have addressed issues about the quality
of data collected. Few, however, explicitly account for why there is any no
significant or significant difference between web-based and face-to-face surveys on
response quality; namely, what was the cause of these results is unclear. Hence, the
object of this paper tries to find the important factors which generate no significant or
significant difference between the two modes on response style. The following
section collects related factors affecting respondents’ response style according to
previous literature on the subject and infers that whether there are significant
differences between the two modes of questionnaires on these factors base on logic.
Factors affecting respondents’ response style
Lack of anonymity is regarded as one of the most important factors which affect
response rates and response style (Kiesler and Sproull, 1986; Ranchhod and Zhou,
2001). Kuhnert and McCauley (1996) pointed out that because the validity of data
gathered from surveys is directly tied to respondents’ trust in the confidentiality of
their responses, it is imperative that respondents believe that their answers will remain
anonymous and will not lead to retribution or negative outcomes. In the existing
studies comparing survey results across web-based versus paper-and-pencil form of
discourages some people from participating in surveys using the new medium (such
as web-based survey) because of security and privacy concerns (Dommeyer and
Moriarty, 1999; Parker, 1992). Furthermore, Heerwegh (2005) argue that differences
in responses to sensitive questions were expected because personalization of e-mail
invitations decreases the level of anonymity and perceived privacy. However, other
empirical studies found that respondents considered the web survey more confidential
(Booth-Kewley, Rosenfeld, and Edward 1993; Stanton 1998). For instance, in a
survey carried out by Handwerk, Carson and Blackwell (2000), the results also
showed web-based respondents have higher confidence than ones in paper-and-pencil
survey and the overall response rate for web-based survey (37.5%) was significantly
higher than that for the paper-and-pencil survey group (25.5%).
In addition to lack of anonymity, Baumgartner and Steenkamp (2001) proposed
numbers of factors, such as time pressure, levels of the willingness, meaningful
stimuli, anxiety and distraction, that might affect respondents’ response style.
However, few previous researchers have examined whether there were really
differences in these factors between a web-based and a paper-and-pencil survey and
are seldom to clarify the mystery that how these differences will affect the response
style of respondents participating in web-based or a paper-and-pencil survey.
different context, so there may be differences in these factors between a web-based
survey and a paper-and-pencil form of the same survey. For example, since there is
difference in the period of time for answering questionnaires between a web-based
and a paper-and-pencil survey, time pressure was different among the two modes. In
answering the web-based questionnaires, respondents would be admitted to select the
period of time most convenient for them to fill out the questionnaire, without any time
limitation in the answering period; in contrast, respondents who answer the
paper-and-pencil questionnaires are requested to complete the survey within a limited
period of time. Hence, respondents answering the paper-and-pencil questionnaires
perceive greater time pressure than ones answering the web-based questionnaires.
In addition, compared with the web-based questionnaire, the paper-and-pencil
survey has less flexible in choosing the suitable time and the place to answer
questionnaire. Therefore, respondents answering the paper-and-pencil
questionnaires experience so great limited that their willingness to answer the
questionnaires would decrease. In other words, the respondents answering the
web-based questionnaires can decide the time and place they fill this survey, and they
can freely choose their favorite time and place, thus, this maybe up grate their
willingness to fill this survey.
concentration; for instance, while the respondents fill out questionnaires by internet at
home, they can stop filling the survey to do other things in any answering period.
Furthermore, sometimes the respondents will found the paper-and-pencil survey is
more strenuous and inconvenient than web-based survey, and they will become
anxiety and influencing their wiliness to fill this survey due to these factors. Since
few researchers have examined whether there were really differences in the time
pressure, levels of the willingness, meaningful stimuli, anxiety and distraction,
especially between a web-based and a paper-and-pencil survey, the current study
adopt the course evaluation as the sample to test the response style differences
between the two modes of surveys. The reasons for choosing the course evaluation
mainly due to the respondents (students) are supposed to be homogeneous in the
sample profile. To understand the differences between the answering contexts
between the two modes, this study conduct the pilot study to make sure if there is
really difference existence of the above-mentioned problems which may cause the
response style different. .
Pilot Study
We conducted a pilot study to understand the perceived difference in the
above-mentioned factors between the two modes of questionnaires for students. The
and of distraction among two modes of questionnaires. All questionnaires were
developed in terms of Baumgartner and Steenkamp’s (2001) definition; meanwhile,
the study invites five professionals to assess all questionnaires in order to ensure the
content validity. Moreover, all questionnaires were measured by using 5-point scales,
ranging from strongly agree (5) to strongly disagree (1). Subjects were 49 university
students and they were randomly assigned to response one of the two modes of
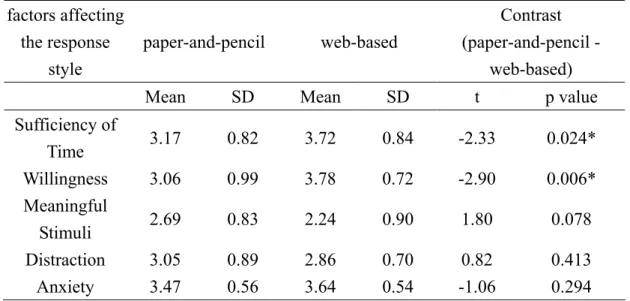
questionnaires (such as web-based versus a paper-and-pencil). The results showed
that there were not significant perceived difference in levels of meaningful stimuli, of
anxiety and of distraction between a web-based and a paper-and-pencil survey, but
there were significant perceived difference both in the levels of time pressure and the
willingness (see table 1). In other words, respondents considered the web-based
survey more sufficient than the paper-and-pencil one (web-based Mean = 3.72 vs.
paper-and-pencil Mean = 3.17, p = 0.024) as well as participants’ willingness to answer
the questionnaires in web-based survey was significant higher than the one in
paper-and-pencil survey (web-based Mean = 3.78 vs. paper-and-pencil Mean = 3.06,
p=0.006). We describe further our basic research concepts and propose the
following hypothesizes as a result of the above-mentioned outcome.
---
---
Basic concepts and hypotheses
First of all, in answering the paper-and-pencil questionnaires, respondents were
asked to complete the survey within a limited period of time (20 minutes) during the
class. But they would be allowed to choose the period of time most convenient for
them to fill out the web-based questionnaire, without any time limitation in the
answering process. Thus, time pressure was different among the two modes.
Besides, based on the above-mentioned results, in the comparison of sufficiency of
time for filling out the questionnaires, it was significantly lower for the
paper-and-pencil questionnaire than the web-based one (p=0.024, significant at p<.05).
McGee and Komorita (1963) manipulated the amount of time available for
responding to each question, and find the tendency to make agreement responses
varies inversely with the amount of time available to the respondents for considering
the question. They infer that the results result from respondents’ lack of adequate
cognitive resources. According to Baumgartner and Steenkamp (2001), under time
pressure, Acquiescence Response Style tends to agree with items regardless of the
content. While all the items in the questionnaire were targeted to evaluate the
approval, and Likert 5-point items was applied to the answers. Thus, compared with
the web-based questionnaire, it is proposed that the proportion of selection for
positive extremely is relatively higher in the paper-and-pencil questionnaire.
H1: The proportions of selection positive extremely are higher in paper-and-pencil questionnaires than web-based ones.
As to the willingness to answer the questionnaires, the pretest result has shown
that it was higher for the web-based questionnaire. Schuman and Presser (1981)
point out that because respondents lack the willingness to read the instructions and
interpret items appropriately, the tendency to use the middle scale category varies
inversely with the level of the willingness to the respondents for considering the
question. Base on Baumgartner and Steenkamp’s (2001) suggestion that if the
sample’s willingness is lower, the response style tends to be Midpoint Responding.
In terms of the Likert 5-point items adopted in this study, the proportion of the
selection for midpoint responding would be higher. Thus, it is proposed that in
comparison with the web-based questionnaires, the selections for midpoint responding
are in a greater proportion in paper-and-pencil questionnaires.
H2: The proportions of selection for midpoint responding are higher in paper-and-pencil questionnaires than web-based ones.
questionnaires were mostly based on the higher anonymity and truer response due to
the fact that the surveyed could not be easily identified(Dommeyer and Moriarty,
1999; Parker, 1992). As this study was aimed to evaluate the instructor’s teaching
performance, in answering the paper-and-pencil questionnaire with lower anonymity,
students would be worried that lower evaluation results might influence their
instructor’s final evaluation on them if they were identified. As a result, this study
proposed that the mean scores are lower from web-based questionnaires than
paper-and-pencil ones.
H3: Evaluation scores are lower for web-based questionnaires than paper-and-pencil ones.
The aforementioned web-based questionnaires provided higher anonymity than
the paper-and-pencil questionnaire, so respondents had less worries about the problem
of identification, and were more willing to express their opinions. Davis’s (1997)
and Handwerk, Carson, and Blackwell’s (2000) results show that relative to the
applicants completing the paper-and-pencil surveys, the web-based surveys such as
Web or e-mail make respondents so more confidential that respondents are willing to
provide more information on web-based questionnaires than paper-and-pencil ones.
37.5% of a total of respondents completing web-based surveys is willing to fill out the
paper-and-pencil surveys is willing to fill out the open-ended. Thus, it can be further
inferred that respondents are willing to provide more information on web-based
questionnaires than paper-and-pencil ones.
As to the amount of information provided, that samples make spontaneous
efforts should be the precondition. Thus, the answers to open-end items were taken
as the basis for information provided by the respondents.
There are two indicates for the amount of information provided. First, for the
2 open-end questions (“Which part in the course do you consider the best?” and
“Which part in the course do you consider necessary to improve?”), 2 unaware of the
purpose of this study persons were asked to categorize the answers to these open-end
items into “teaching style”, “teaching content”, “student interactivity”, “environment”,
and “others”. Each was marked as either “positive” or “negative” expression to sum
up the total counts. If any inconsistent was discovered in the categorization, two of
the authors would discuss and decide how it should be categorized. The second
indicator is the sum of total word counts of the answers to the 2 open-end items.
Thus, the hypothesized as follows:
H4: The amount of information provided are greater in web-based questionnaires than paper-and-pencil ones.
Methodology
Considering the above-mentioned inconsistency among various research
conclusions, this study focuses the comparison of web-based and paper-and-pencil
survey. The sample units of this study are courses result which had been evaluated
by students that took that course credits. The reasons for choosing course evaluation
as the samples mainly due to the respondents (students) are already familiar with the
Internet and the surveyed topic is highly concerned by the respondents to avoid
exclusiveness.
Data Collection Process
The data of this study is the course evaluation by a university in northern Taiwan.
The web-based survey of the course evaluation is conducted before the end of each
semester. However, the web-based surveys are still partly accompanied by a small
amount of conventional paper-and-pencil questionnaires to compare the response rate
and the tendency of the answers. The paper-and-pencil surveys are randomly
selected from all the available courses.
In order to make sure that respondents are truly the students of the course and
answer one taken course once only, a non-anonymous method is adopted in both
survey modes. It means that students are required to fill in their student ID before
instructor cannot see the individual answer. As for the paper-and-pencil
questionnaire, the instructor has to finish the class and leave the classroom 20 minutes
earlier. A staff from the Office of Academic Affairs distributes and then collects the
questionnaires. The instructor is not allowed to access any part of the process. As
for the web-based questionnaire, students take their own time fill out the
questionnaire. Students are also required to enter their student ID and password to
access the system.
Data Structure
All of the courses in the commerce college were chosen as research samples
mainly due to the consideration of homogeneity among samples (courses). That is to
say, it was believed the teaching methods and contents in the commerce college were
more consistent in comparison with other colleges. And when the Office of
Academic Affairs sampled courses for the instructor evaluation survey, random
sampling was adopted. Thus, no initial difference should have existed between the
evaluations of web-based and paper-and-pencil courses. The only difference derived
from different should be attributed to the answering modes.
There were totally 1,517 courses in the business college. The web-based
questionnaire was adopted for 1,382 courses, and the paper-and-pencil questionnaire
by outliers, only courses with more than 20 registered students, more than 10
respondents, and higher than 30% of respondent ratio (number of survey respondents /
number of registered students) were included in the analysis. A total number of 30
paper-and-pencil questionnaire courses while 307of the web-based ones were
including after the abovementioned sifting procedure. As there was a big difference
samples size between the two modes, from the above qualified courses, 30 web-based
courses were selected at random for further analyses.
RESULTS
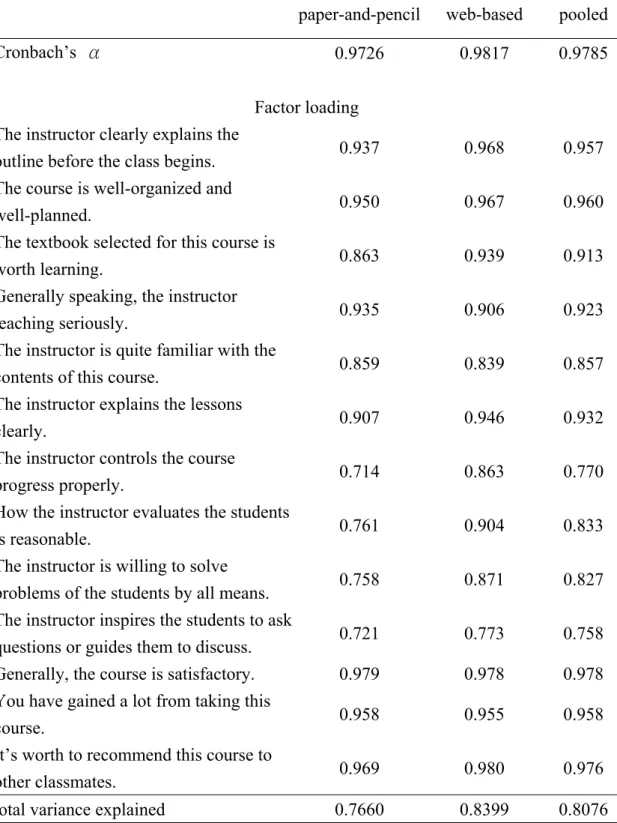
There were a total of 13 items in the evaluation. Exploratory factor analysis
(EFA) was first employed. Under the principal component method, all of the 13
items fell into one factor no matter in the paper-and-pencil and web-based
questionnaires. The total variance explained at least reached 76.60% and the
cronbach’s αs all more than .97. Thus, we conclude these items had a certain degree
of internal consistence, and the followed-up analyses would be conducted with the
summed scores. Questions, factor analysis, and Cronbach alpha values were shown
on Table 2.
---
Table 2 insert about here
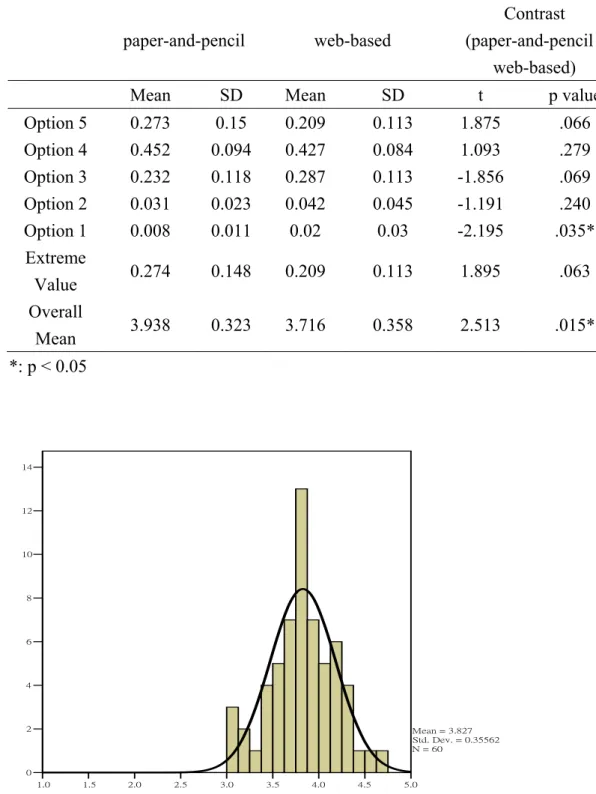
First of all, for the two modes of questionnaires, each course was taken as the data
point for the between subject comparison. In other words, in each mode, the
respective proportion of choices from 1 to 5 for all the courses were calculated with
Equation (1). The mean score and SD (standard deviation) were shown as Table 3.
The choices were presented in proportion, so the sum of means was equal to one.
Because 5-point Likert scale was adopted by the course evaluation, the extreme value
was the sum of the proportions of choosing 5 and choosing 1. As to the Overall
Mean, each option was considered as a continuous variable; that is to say, it was the
mean score of the evaluation.
∑∑∑ = = = × × = 30 1 1 13 1 /(30 13) i n j k ijkl l S n Option ………(1)
where Sijkl=1 when the ith course, the jth student, the kth question, with choosing l
elsewhere Sijkl=0
---
Table 3 insert about here
---
Table 3 showed that in the comparison of option 5, more respondents tended to
select 5 in the paper-and-pencil questionnaires than the web-based ones. However,
the difference did not reach the significant level (M = .273 vs. .209; p = .066), so H1
web-based questionnaires than the paper-and-pencil ones (M = .232 vs. .287; p
= .069). The result was not consistent with our expectation, so H2 was not
supported. The Overall Mean indicated that the scores were higher in the
paper-and-pencil questionnaires than the web-based ones. That is to say respondents
in the paper-and-pencil questionnaire were more satisfied with instructors’ teaching
and the difference reached significance level. Thus, H3 was supported.
As to the conclusions with hypotheses not supported, the causes were discussed as
follows. First, H1 was not supported but the tendency was consistent with our
expectation, only the difference did not reach the significant level. Regarding to H2,
the result showed that the proportion of choosing 3 was unexpectedly higher in the
web-based questionnaire than the paper-and-pencil questionnaire. According to
Baumgartner & Steenkamp (2001), when sample’s willingness is lower, the response
style tends to be Midpoint Responding. But it was doubted that in the survey of
course evaluations, the Midpoint Responding fell on option 3. That is, choosing 3
(the description was “normal”) was not considered to be neutral. When students
thought the instructor’s teaching performance was “normal”, it might have implied
that the instructor was not good enough.
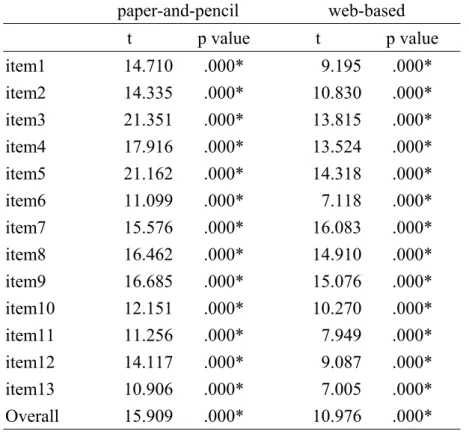
To test this argument, all the qualified samples were pooling. It was shown in
significant level (t = 18.083; p = 0.000). The same result also occurred in only
web-based (t=10.976; p=0.000) and paper-and-pencil (t=15.909; p=0.000)
questionnaires. And the conclusion was consistent with each item. So it was
reasonable to doubt that the Midpoint Responding of this survey did not fall on
choosing 3.
---
Table 4 insert about here
---
---
Figure 1 insert about here
---
Due to the fact that Midpoint Responding could not be directly tested, an indirect
approach of investigating its variance was adopted. It was believed that if Midpoint
Responding was more likely to occur in the paper-and-pencil questionnaire, the
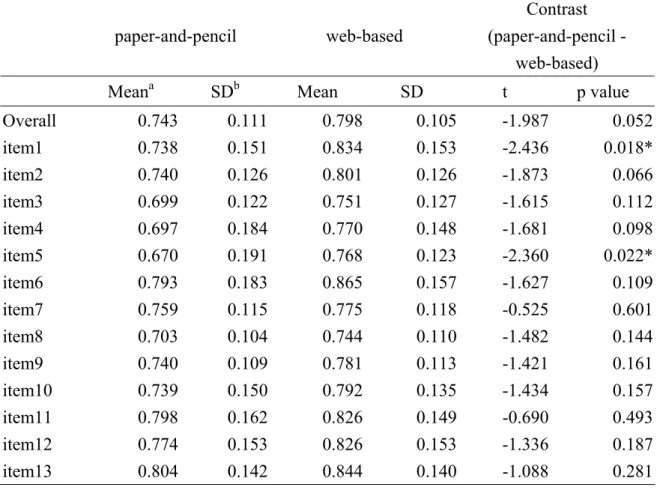
variance would be smaller. The related results were shown in Table 5. It could be
found from Table 5 that despite the fact that the differences in SD among most of the
items were not reach the significant level, the direction showed the SD was lower in
the web-based questionnaires than the paper-and-pencil ones; in other words,
dispersion was larger in the web-based questionnaires. Thus, it was also consistent
---
Table 5 insert about here
---
As to the analysis on open questions, previous researchers relied more on the word
count as the amount of provided information (e.g. Schaefer & Dillman, 1988). It is
conceived in this study that simply using word count as a proxy will yield distorted
results, due to the fact that what researcher really cares is the amount of information
provided rather than word count. Though, in general situations, more amount of
provided information requires the expression of more words. In addition to word
count, to understand the difference between these two survey modes, content analysis
was adopted to calculate the amount of information provided by each student and sum
the amount as the total amount of information provided for each course. First, two
research staffs unaware of the research intent were asked to carry out the encoding of
the answers to open-end questions. The encoding rule was based on the positive or
negative evaluations for instructor’s teaching performance and respective amount of
information. Take “the teacher explains the course articulately and clearly, and is
serious in teaching” as an example. “Being articulate and clear” is a student’s positive
attitude toward teacher’s teaching, and “being serious in teaching” represents an
earnest attitude held by the instructor. There may not be a causal relationship
explaining but always about irrelevant issues), so they are considered two positive
pieces of information. Besides, in the case where “the instructor is expected to have
sufficient understanding about the course; otherwise, the student may still have no
idea about the course after class”, the cause is “the instructor does not have sufficient
understanding about the course”, and the result is “the student may still have no idea
about the course after class.” Thus, there is only one negative piece of information in
this case.
Among the 60 courses, there were totally 1,489 open-end replied. 206 of them
were responded with a “no” or “no comment”, and among the rest 1,283 replies, 1,110
had a consistent results in the encoding of the 2 judgers. So, the consistency was
0.8652. For the inconsistent portion, after discussion, 1,412 pieces of information
were generated. Among them, 777 were positive and 635 were negative. The
---
Table 6 insert about here
---
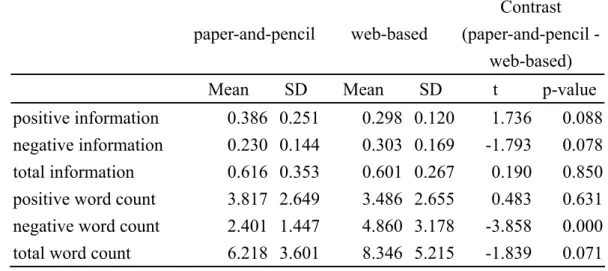
From Table 6, we can find that in the aspect of positive information, the
paper-and-pencil questionnaire tends to yield higher values than the web-based
questionnaire, and in the aspect of negative information, the result was the opposite.
This is consistent with our expectation, but the differences may not reach a significant
level. In terms of word count, a consistent tendency is shown. However, only in
the word count of negative attitude, the paper-and-pencil mode has a lower value than
the web-based one and reaches the significant level. In terms of the total amount of
information, no evidence supports any difference. But the p-value for the difference
in word count reaches .071. Generally speaking, the above comparison data partial
support H4.
Conclusion and Discussion
Previous studies on the comparison of web-based and paper-and-pencil
questionnaires focused more on the direct comparisons between the two. When no
significant difference is observed, web-based questionnaires can be reliable, and can
questionnaires are correct. However, in addition to the comparison of the two modes,
this study further investigates the cause of the differences. That is, we are trying to
find out which mode of questionnaire has better validity in every aspect. Even
though not all of the hypotheses proposed in this study are supported, according to the
research results, there is still a certain difference, if any, at least in students’ evaluation
on the instructor, between the two survey modes. However, there may also some
differences between course survey and other survey topics in management science, so
the conclusions may not apply to all other surveys before the duplication.
First of all, there is time limit in the survey. In the pre-test, some students
expressed they felt more time pressure when filling out the paper-and-pencil
questionnaire. In the comparison of mean scores, result does not reveal that the
paper-and-pencil questionnaire presents a stronger tendency in Acquiescence
Response Style than the web-based questionnaire (p=.066). It is possible that the
students were already familiar with the course survey, so that the difference in this
time is not significant. Future studies may set a time control to investigate the
impact of time. If the impact of time really causes the Acquiescence Response Style,
web-based questionnaire may be a better mode that response more correct results.
For the researchers planning to adopt paper-and-pencil questionnaire, mail
be provided to minimize this difference.
Besides, the hypothesis that Midpoint Responding tends to be higher in the
paper-and-pencil questionnaire than the web-based one was not supported, but in the
follow-up comparisons, this tendency was discovered. The research issue in this
study were not neutral, and the response of social desirable might exist. So Midpoint
Responding did not occur on central answers. Future researchers may investigate
into more neutral issues. If the result shows a serious tendency of Midpoint
Responding in the paper-and-pencil questionnaire, when adopting this mode of survey,
more attention should be paid to the willingness of the respondents. Because just
trying to extend the respondents amount by conducting conventional sampling
without make sure the respondents’ willingness to answer the questionnaire may lead
to biased conclusions. And the willingness can be enhanced through the stress on
the importance of the study and proper encouragement. On the contrary, regarding
to web-based questionnaire and mail questionnaire, because the respondents can be
ignored if they show low willingness, the difference caused by this issue is relatively
lower compare to face-to-face mode.
If the survey questions are not neutral, anonymity plays an important factor.
Web-based questionnaires that offer better anonymity may yield truer answers, and
questionnaires, the enhancement of anonymity becomes relatively important. In
face-to-face surveys, the surveyor may have to keep a certain distance from the
respondents, in order to acquire identifiable personal data, anonymity may be lowered.
For mail questionnaires, it is essential to ensure the respondents that the received
questionnaire and mail-back envelopes are consistent with those mailed to other
respondents. The anonymity will be higher, and more information can be acquired.
Finally, the focus of this study was placed on the comparison of the differences in
response styles in between web-based questionnaires and paper-and-pencil ones, not
to find out which mode of surveys is more optimal. In our knowledge, respondents’
response styles depend on different situations and issues, rather than simply the mode
of the survey. There are still limited issues pertaining to this aspect, so more issues
and more conclusions are required to provide researchers with more information for
design or control appropriate situations for the survey issues to derive truer
REFERENCES
Bachmann, D., Elfrink, J., and Vazzana, G. 1996. Tracking the Progress of E-mail vs. Snail-mail. Marketing Research, 8(2): 31-5.
Baumgartner, H., Jan-enedict E., and Steenkamp M. 2001. Response Styles in Marketing Research: A Cross-National Investigation. Journal of Marketing Research, 38 (May): 143-156.
Booth-Kewley, S., Rosenfeld, P., and Edwards, J. E. 1993. Computer Administered Surveys in Organizational Settings: Alternatives, Advantages, and Applications. in Improving Organizational Surveys: New Directions, Methods, and Applications, ed. P. Rosenfeld, J. E. Edwards, and M. D. Thomas, Newbury Park, CA: Sage, 73-101.
Cobanoglu, C., Warde B., and Moreo P. J. 2001. A Comparison of Mail, Fax and Web-Based Survey Methods. International of Journal of Market Research, 43 (4): 441-52.
Dommeyer, C. J. and Moriarty E. 1999. Comparing Two Forms of an E-mail Survey: Embedded and Attached. International Journal of Market Research, 52 (1): 39-50.
Gosling, S. D., Vazire S., Srivastava S., and John O. P. 2004. Should We Trust Web-Based Studies? A Comparative Analysis of Six Preconceptions about Internet Questionnaires. American Psychologist, 59 (2): 93-104.
Handwerk, P. G., Carson, C., and Blackwell, K. M. 2000. On-line vs. Paper-and-Pencil Survey of Students: A Case Study, paper present at the
Annual Forum of the Association for Institutional Research. Cinnecinnati, OH.
Heerwegh, D. 2005. Effects of Personal Salutations in E-mail Invitations to Participate in a Web Survey. Public Opinion Quarterly, 69: 588-598.
Kaplowitz, M. D., Hadlock, T. D., and Levine, R. 2004. A Comparison of Web and Mail Survey Response Rates. Public Opinion Quarterly, 68(1): 94-101.
Kiesler, S. andSproull L. S. 1986. Response Effects in the Electronic Survey. Public Opinion Quarterly, 50 (3):402-13.
Kuhnert, K. and McCauley, D. P. 1996. Applying Alternative Survey Methods. In A.I. Kraut (Ed.), Organizational surveys: Tools for assessment and change: 233-254. San Francisco, CA: Jossey-Bass Publishers.
Traditional Student Ratings of Instruction. Research in Higher Education, 40 (2): 221-32.
Meade, A. W., Lawrence C. M., and Lautenschlager, G. J. 2004. Are Online and Paper-and-Pencil Personality Tests Truly Comparable? symposium presented at the 19th
Annual Conference of the Society for Industrial and Organizational Psychology, Chicago, IL.
Ployhart, R. E., Weekley J. A., Holtz, B. C., and Kemp C. 2003. Web-Based and Paper-and-Pencil Testing of Applicants in a Proctored Setting: Are Personality, Biodata, and Situational Judgment Tests Comparable ? Personnel Psychology, 56 (September):733-52.
Ranchhod, A. and Zhou F. 2001. Comparing Respondents of E-mail and Mail Surveys: Understanding the Implications of Technology. Marketing Intelligence and Planning, 19 (4): 254-262.
Ray, N. M., Griggs K., and Tabor S. W. 2001. Web Based Survey Research Workshop. http://telecomm.boisestate.edu/research/.
Smither, J. W., Walker A. G., and Yap M. K. T. 2004. An Examination of the Equivalence of Web-Based versus Paper-and-Pencil Upward Feedback Ratings: Rater- and Ratee- Level Analyses. Educational and Psychological Measurement, 64 (1): 40-61.
Stanton, J. M. 1998. An Empirical Assessment of Data Collection Using the Internet. Personnel Psychology, 51: 709-25.
Table 1 pilot study for factors affecting the response style factors affecting the response style paper-and-pencil web-based Contrast (paper-and-pencil - web-based)
Mean SD Mean SD t p value Sufficiency of Time 3.17 0.82 3.72 0.84 -2.33 0.024* Willingness 3.06 0.99 3.78 0.72 -2.90 0.006* Meaningful Stimuli 2.69 0.83 2.24 0.90 1.80 0.078 Distraction 3.05 0.89 2.86 0.70 0.82 0.413 Anxiety 3.47 0.56 3.64 0.54 -1.06 0.294 *: p < 0.05
Table 2 Results of Factor Analysis
paper-and-pencil web-based pooled Cronbach’s α 0.9726 0.9817 0.9785
Factor loading The instructor clearly explains the
outline before the class begins. 0.937 0.968 0.957 The course is well-organized and
well-planned. 0.950 0.967 0.960 The textbook selected for this course is
worth learning. 0.863 0.939 0.913 Generally speaking, the instructor
teaching seriously. 0.935 0.906 0.923 The instructor is quite familiar with the
contents of this course. 0.859 0.839 0.857 The instructor explains the lessons
clearly. 0.907 0.946 0.932 The instructor controls the course
progress properly. 0.714 0.863 0.770 How the instructor evaluates the students
is reasonable. 0.761 0.904 0.833 The instructor is willing to solve
problems of the students by all means. 0.758 0.871 0.827 The instructor inspires the students to ask
questions or guides them to discuss. 0.721 0.773 0.758 Generally, the course is satisfactory. 0.979 0.978 0.978
You have gained a lot from taking this
course. 0.958 0.955 0.958 It’s worth to recommend this course to
other classmates. 0.969 0.980 0.976 total variance explained 0.7660 0.8399 0.8076
Table 3 Descriptive Statistics
paper-and-pencil web-based
Contrast (paper-and-pencil -
web-based)
Mean SD Mean SD t p value Option 5 0.273 0.15 0.209 0.113 1.875 .066 Option 4 0.452 0.094 0.427 0.084 1.093 .279 Option 3 0.232 0.118 0.287 0.113 -1.856 .069 Option 2 0.031 0.023 0.042 0.045 -1.191 .240 Option 1 0.008 0.011 0.02 0.03 -2.195 .035* Extreme Value 0.274 0.148 0.209 0.113 1.895 .063 Overall Mean 3.938 0.323 3.716 0.358 2.513 .015* *: p < 0.05 1.0 1.5 2.0 2.5 3.0 3.5 4.0 4.5 5.0 0 2 4 6 8 10 12 14 Mean = 3.827 Std. Dev. = 0.35562 N = 60
Table 4 Comparisons of the Mean and Choice 3 in Overall and Every Item paper-and-pencil web-based t p value t p value item1 14.710 .000* 9.195 .000* item2 14.335 .000* 10.830 .000* item3 21.351 .000* 13.815 .000* item4 17.916 .000* 13.524 .000* item5 21.162 .000* 14.318 .000* item6 11.099 .000* 7.118 .000* item7 15.576 .000* 16.083 .000* item8 16.462 .000* 14.910 .000* item9 16.685 .000* 15.076 .000* item10 12.151 .000* 10.270 .000* item11 11.256 .000* 7.949 .000* item12 14.117 .000* 9.087 .000* item13 10.906 .000* 7.005 .000* Overall 15.909 .000* 10.976 .000* *: p < 0.05
Table 5 Comparisons on Standard Deviations
paper-and-pencil web-based
Contrast (paper-and-pencil -
web-based)
Meana SDb Mean SD t p value
Overall 0.743 0.111 0.798 0.105 -1.987 0.052 item1 0.738 0.151 0.834 0.153 -2.436 0.018* item2 0.740 0.126 0.801 0.126 -1.873 0.066 item3 0.699 0.122 0.751 0.127 -1.615 0.112 item4 0.697 0.184 0.770 0.148 -1.681 0.098 item5 0.670 0.191 0.768 0.123 -2.360 0.022* item6 0.793 0.183 0.865 0.157 -1.627 0.109 item7 0.759 0.115 0.775 0.118 -0.525 0.601 item8 0.703 0.104 0.744 0.110 -1.482 0.144 item9 0.740 0.109 0.781 0.113 -1.421 0.161 item10 0.739 0.150 0.792 0.135 -1.434 0.157 item11 0.798 0.162 0.826 0.149 -0.690 0.493 item12 0.774 0.153 0.826 0.153 -1.336 0.187 item13 0.804 0.142 0.844 0.140 -1.088 0.281 a: the mean of SD.
Table 6 Comparisons on Amount of Provided Informationa
paper-and-pencil web-based Contrast (paper-and-pencil -
web-based)
Mean SD Mean SD t p-value positive information 0.386 0.251 0.298 0.120 1.736 0.088 negative information 0.230 0.144 0.303 0.169 -1.793 0.078 total information 0.616 0.353 0.601 0.267 0.190 0.850 positive word count 3.817 2.649 3.486 2.655 0.483 0.631 negative word count 2.401 1.447 4.860 3.178 -3.858 0.000 total word count 6.218 3.601 8.346 5.215 -1.839 0.071
a: Represent in average forms (amount of item / total amount of student answer the
出席國際學術會議心得報告
計畫編號 NSC 95-2416-H-004-002 計畫名稱 電子行銷典範--子計畫四:網路行銷研究之探討:建立、驗證及應用(3/3) 出國人員姓名 服務機關及職稱 樓永堅 國立政治大學企管系教授 會議時間地點 2007.07.11~14 Milan, Italy會議名稱 European Conference of Association for Consumer Research
發表論文題目 Ingredient Branding Alliances: An Investigation of Brand Awareness and Feedback Effects
一、參加會議經過
消費者研究學會 ACR (Association for Consumer Research) 是研究消費者行為最重要的組 織,每年在北美舉行的年會,,皆吸引全球各地數百位學者及博士班學生前來與會發表最新研 究成果。但接受率只有 50%左右,競爭相當激烈,而其出版之大會論文集 Advances in Consumer Research,雖然只是研討會論文輯,但其影響力很大,甚至,比一些期刊還重要, 更被評為所有行銷期刊中最具影響力的第十三名。可見其水準之高,學術地位之重要性。另 外,除了北美年會外,遇西元單數年在歐洲,雙數年在亞洲另舉行地區性年會。今年,歐洲 年會是於七月十一至十四日在義大利米蘭舉行,約有三百人參加。
年會論文發表分成四大部分: 一是競爭論文(competitive paper session),是學者已完成的 研究成果,二是特別議題(special session),是集合數篇在議題取向類似,或是針對某一新興研 究取向,提出一整合性探討。可能是研究成果,也可能只是概念的分享,但往往是未來許多 最新研究課題的激發,三是工作論文(working paper session) 可能是尚未成為完整論文形式或 是理論架構完成但還未實際測試,或是雖未達競爭論文水準,但仍有潛力,而以 poster 的方 式呈現。另外,則是圓桌論壇(Roundtable),針對某些特殊議題,由參與者進行討論。今年有 八場,涵蓋社會行銷,質性研究方法,刻板印象,家庭消費,食物消費行為等。 在二天半的 時間中,每天有四個時段,同時有八場研討會進行,共約有二百五十篇論文發表。 EACR 年 會 的 另 一 個 特 色 , 是 在 正 式 年 會 的 前 一 天 , 為 博 士 班 學 生 舉 辦 Doctoral Symposium,由大會邀請在消費者研究領域中,學有專精的重量級人物或是歷任期刊(Journal of Consumer Research)主編為這些未來的研究生力軍講解如何進行研究,如何進行期刊的投稿, 發表,如何與期刊主編和審稿人對話,以及學術生涯的規劃等議題進行深入分析,以便這些 生力軍能及早適應未來的學術生活。自去年年會開辦以來,廣受好評,費用七十歐元(含晚 餐),更重要的是,沒有配額限制。只要是 ACR 的學生會員,每年皆可參加,是值得國內博 士班學生考慮參與。
(consumption and branding strategies) 之場次,論文題目是 Ingredient Branding Alliances: An Investigation of Brand Awareness and Feedback Effects,主要探討成分品牌與主品牌的知名度高 低、雙品牌的成功與否,對於成分品牌與主品牌的品牌形象之回饋效果。在會場中與許多學 者充分交換意見,並得到許多寶貴的意見,對未來進一步的探討及延伸收穫良多。 二、與會心得 EACR 年會每次皆吸引數百位學者及博士班學生與會,提供學者們一個互相交流及社交 的機會,同時也讓博士班學生能及早接觸,了解學術生涯及生態,並建立人際網路或合作研 究的基礎。另外,更有許多重量級學者幾乎每次皆參與,也提供博士班學生親炙大師風采, 更進而有所請益的機會。 再者,藉由每年年會的機會,檢視學者們研究的進展及成果,進而 發覺可能的合作機會,也就是這樣暨合作又競爭的機制,使得學術水準不斷提昇。因此,國 內似應更加強相關學術社群之互動機制,以提供學者持續交流的機會,並加強博士班學生互 動,以彼此激勵與學習 再者,本次大會所發表的兩百多篇文章中,與品牌相關的論文似有逐年大幅增加的趨勢。 其中與大陸相關的論文,更是逐年攀升,並吸引爆滿的學者與會,並且熱烈的討論,欲罷不 能。大陸市場似乎不僅吸引了企業的注意,也成功的吸引學者關注。其中,更不乏許多重量 級學者的投入。面對這股學術的大熱潮,我們應如何自處,如果西方學界不斷投入大陸的研 究,透過快速增加的大陸留學生而建立與大陸學界的聯繫管道或直接的合作研究,則台灣將 喪失原有同文同種的優勢,將更難對世界整體的知識提昇有所貢獻。因此,本人認為國內似 應更積極的強化大陸消費者行為的研究,或是將本土化的消費者研究放在更大的華人文化的 架構下,與國際主流接軌,方能確保立足之地。