This article was downloaded by: [National Chiao Tung University 國立交通大學] On: 28 April 2014, At: 08:55
Publisher: Taylor & Francis
Informa Ltd Registered in England and Wales Registered Number: 1072954 Registered office: Mortimer House, 37-41 Mortimer Street, London W1T 3JH, UK
Aerosol Science and Technology
Publication details, including instructions for authors and subscription information:
http://www.tandfonline.com/loi/uast20
Design and Evaluation of a
Plate-to-Plate Thermophoretic
Precipitator
Chuen-Jinn Tsai a & Hsin-Chung Lu a a
Institute of Environmental Engineering, National Chiao Tung University , Hsin Chu, Taiwan
Published online: 26 May 2010.
To cite this article: Chuen-Jinn Tsai & Hsin-Chung Lu (1995) Design and Evaluation of a Plate-to-Plate Thermophoretic Precipitator, Aerosol Science and Technology, 22:2, 172-180, DOI: 10.1080/02786829408959738
To link to this article: http://dx.doi.org/10.1080/02786829408959738
PLEASE SCROLL DOWN FOR ARTICLE
Taylor & Francis makes every effort to ensure the accuracy of all the information (the “Content”) contained in the publications on our platform. However, Taylor & Francis, our agents, and our licensors make no representations or warranties whatsoever as to the accuracy, completeness, or suitability for any purpose of the Content. Any opinions and views expressed in this publication are the opinions and views of the authors, and are not the views of or endorsed by Taylor & Francis. The accuracy of the Content should not be relied upon and should be independently verified with primary sources of information. Taylor and Francis shall not be liable for any losses, actions, claims, proceedings, demands, costs, expenses, damages, and other liabilities whatsoever or howsoever caused arising directly or indirectly in connection with, in relation to or arising out of the use of the Content.
This article may be used for research, teaching, and private study purposes. Any substantial or systematic reproduction, redistribution, reselling, loan, sub-licensing, systematic supply, or distribution in any form to anyone is expressly forbidden. Terms & Conditions of access and use can be found at http:// www.tandfonline.com/page/terms-and-conditions
Design and Evaluation of a Plate-to-Plate
Thermophoretic Precipitator
Chuen-Jinn Tsai* and Hsin-Chung Lu
Institute of Encironmental Engineering, National Chiao Tung Unicersity, Hsin Chu, Taiwan
A plate-to-plate thermophoretic precipitator with high particle collection efficiency has been designed and tested. The precipitator consists of two flat plates sepa- rated by a 0.38-mm thermal insulating shim. The top plate is heated by a constant high-temperature water flow while the bottom plate is cooled by a constant low-temperature water flow. Through this forced con- vective heat transfer arrangement, a high and uniform temperature gradient is achieved between the two plates, where submicron aerosol particles can be col- lected efficiently and uniformly in the direction of the
air flow. The precipitator was tested in the laboratory using NaCl and sodium fluorescein monodisperse test particles. When the temperature gradient ranges from 502" to 879"C/cm and the Knndsen number ranges from 0.27 to 3.5, the experimental data show that the present precipitator collects submicron particles effi- ciently. Among previous theories, the thermophoretic velocity equation proposed by Talbot et al. (1980) is found to fit very well with the present experimental data.
INTRODUCTION
When an aerosol particle is suspended in a gas with a temperature gradient, the particle is subjected to a thermophoretic force and will move in the direction of decreasing temperature gradient. The thermophoretic phenomenon has been studied extensively both theoretically and experimentally (for example, Brock, 1962; Derjaguin and Yalamov, 1965, 1966; Der- jaguin et al., 1966, 1976; Kousaka et al., 1976; Talbot et al. 1980; Nazaroff and Cass, 1987; Stratmann and Fissan, 1989; Bakanov, 1991; Montassier et al., 1991; Loyalka, 1992). In addition to air sampling applications, thermophoretic effect has also been used to suppress particle depo- sition to surfaces (Stratmann et al., 1988). Swift and Lippmann (1989) has re- viewed the previous design of thermo-
* T o whom correspondence should be addresed.
phoretic precipitators for air sampling purposes. Green and Watson (1935) was the first to constructed a thermal precipi- tator of the heated wire design for mea- suring dust concentration. The flow rate is limited to 6-7 cm3/min and the collec- tion efficiency is Low. Later, many modifi- cations to the hot wire thermal precipi- tator were made mainly to increase the uniformity of the particle deposit. T o in- crease particle collection efficiency fur- ther, Kethley et al. (1952) and Wright (1953) designed thermophoretic precipita- tors in which the temperature gradient is maintained by two circular plates. The aerosol is drawn through a tube in the center of the upper plate and flows radi- ally in the gap between the plates. These precipitators are claimed to collect viable airborne particles efficiently but experi- mental data are very limited.
In the aspect of the thermophoretic theory, Brock (1962) was the first to do a Aerosol Scicr~cc a n d Technology 22:172 -180 ( 1 9 9 5 ) (0 1995 Amcrlcari Association for Aerosol Research Puhllshed by Elsevicr Sciencc Inc.
Plate-to-Plate Thermophoretic Precipitator 173
complete hydrodynamic analysis of the problem. Later, Talbot et al. (1980) re- viewed the previous theoretical work and found that Brock's equation (Brock, 1962) approaches Waldmann's free molecular limit for the thermophoretic force F,,
(Waldmann, 1959, 1961), while other equations such as those proposed by Der- jaguin and Yalamov (1965, 1966), and Derjaguin et al. (1976) do not. According to Derjaguin and Yalamov (1965, 19661, the thermophoretic velocity
U,,
isDerjaguin et al. (1976) made a correction to the above equation with the factor 3 revised to 2.2.
Talbot et al. (1980) made a correction to Brock's fluid drag equation and pro- posed an interpolating formula for the thermophoretic velocity Ut, as
In the limit of very large Knudsen number, A/R, Eq. 2 states that the dimensionless thermophoretic velocity, U,,T,,/(v V T ) is a constant. Talbot et al.
(1980) found that measurement in the particle-free layer over a heated flat plate, particle trajectory calculation according to Eq. 2 gave the best agreement with the experimental data. In Eqs. 1 and 2, R is
the radius of the particle; A is the mean free path of air molecules; v = p / p is the air kinematic viscosity, with p the air dy- namic viscosity and p the air density; T,, is the mean air temperature in the center of the particle; VT is the temperature gradient in the air; k , and k , are the
thermal conductivities of the air and par- ticle respectively; C is the slip correction factor; C, is the momentum exchange coefficient; C, is the thermal slip coeffi- cient; and C, is the temperature jump coefficient. For complete accommodation, the reasonable values of C,, C,, and C, are 1.14, 1.17, and 2.18, respectively (Talbot et al., 1980; Montassier et al., 1991; Loyalka, 1992).
In the experimental study of ther- mophoretic particle deposition in laminar tube flow, Montassier et al. (1991) also found that Eq. 2 gives a good agreement between the experimental data and theo- retical results. However, in the experi- ment of Montassier et al. (1991), the particle collection efficiency is very low, generally less than 10%. This may in- volves too much uncertainty in the mea- surement. In a recent study of ther- mophoretic force on a single particle by Loyalka (1992), the numerical solution of the linearized Boltzmann equation was obtained and compared with previous work. After reviewing many previous ex- perimental results and theoretical work in the small Knudsen number regime, Bakanov (1991) concluded that differ- ences among various theories still exist, and previous experimental results are not accurate enough to resolve these differences.
In this study, a plate to plate thermal precipitator of high particle collection ef- ficiency has been designed and tested. The advantage of using two flat plates, the top of which is heated while the bottom is cooled by force convection, is that a high and uniform temperature gradient can be set up and hence particles can be col- lected efficiently on the colder bottom plate. Furthermore, since the relationship between the particle collection efficiency and thermophoretic precipitation velocity is simple for a laminar flow in a rectangu- lar duct, it is easily to calculate the ther- mophoretic velocity from the measured
174 C.-J. Tsai and H.-C. Lu
particle collection efficiency data. In this study, the precipitator is tested for parti- cle collection efficiency in the laboratory with two particle materials, namely NaCl and sodium fluorescein, under two high temperature gradients conditions. The ex- perimental data converted in dimension- less form, U,,T,,/(v VT), can be used to check which of the previous thermophor- etic theories is the most accurate one.
THE PLATE-TO-PLATE THERMAL PRECIPITATOR
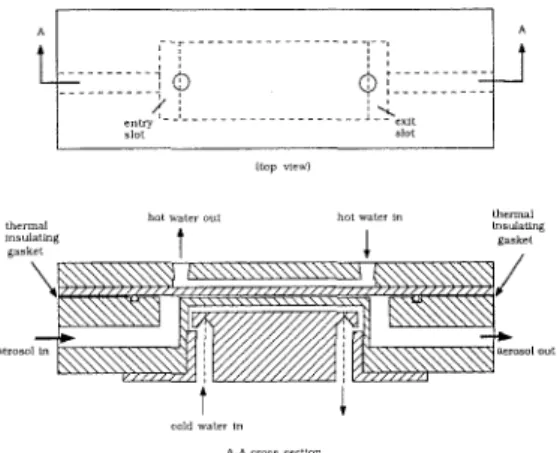
A plate-to-plate thermal precipitator has been made and its detail drawing is shown in Figure 1. The thermal precipitation re- gion is confined within a small gap be- tween two flat plates, the top of which is heated by hot water circulating from a constant temperature bath while the bot- tom plate is cooled by water at ambient temperature. The precipitation area is 3.0 crn (W, width) x 7.1 cm ( L , length), and the gap between the plates is kept at 0.38 mm ( H , height) by a thermal insulating
shim. The design air flow rate is kept constant at 0.4 L/min and the mean air velocity u,, is calculated to be 58.48 cm/s.
The flow Reynolds number Re, defined as Re = pD, u,,/p ((D, : hydrodynamic diam- eter), is 29.10 at ambient conditions. Ac- cording to Schlichting (1979), the hydro- dynamic entry length is 0.04 Re D, = 0.087 cm, which is very short compared with the channel length. Therefore the air flow can be considered to be laminar and fully developed in the precipitation region.
The temperature profile in the precipi- tation region is also fully developed since the Prandtl number is 0.7 for air flow and the temperature profile develops faster than the velocity profile. The theoretical temperature distribution and temperature gradient vertical to the flow direction can be calculated as discussed below.
According to the energy equation, one can obtain the following governing equa- tion for the temperature distribution in the duct (refer to Figure 2 for the coordi- nate system) as
This equation can be solved for the tem- perature gradient dT/dy under constant heat flux conditions as
FIGURE 1. A schematic diagram of the present
platc-to-plate thermophorctic precipitator.
FIGURE 2. Coordinate systcm and the location of thermocouplcs.
Plate-to-Plate Thcrmophoretic Precipitator
In Eqs. 3 and 4, T, is the mixing cup temperature, T, and T, are the top and bottom plate temperature, respectively, u,, is the average air velocity, c, is the specific heat capacity of air at constant pressure. The mixing cup temperature
T, is defined as T, = j"?,u~PVdy/ (ua,HW) where u and T are the air ve- locity and temperature at y. In this study, the temperature gradient is measured by six 0.2-mm diameter J-type thermocouples embedded in the top and bottom plates. Two sets of measured temperature data at air flow rates ranging from 0 to 7.43 L/min are shown in Table 1. For the positions where the thermocouples are installed, one can refer to Figure 2. It can be seen from the table that temperature distribu- tion is very uniform along the direction of the precipitation region. For example, at the top portion of Table 1, it shows that
the axial temperature variation dT,,/dx, only ranges from 0.17" to 0.20"C/cm in the top plate or from 0.06" to 0.08"C/cm in the bottom plate. The influence of air Aow rate through the precipitator on the plate temperature is shown to be quite small, presumably because that the ther- mal conductivity of air is quite low com- pared with that of water. At the current design air flow rate of 0.4 L/min, the pressure drop through the precipitator, which is measured as 6 mm H 2 0 , can be considered to be very small.
Since the axial temperature variation is small, the first term of the right hand side of Eq. 4 is negligible compared with the second term. For example, referring to the data in the top portion of Table 1, at the air flow rate of 0.4 L/min and the average air temperature of 300 K, the maximum value of the first term of Eq. 4
TABLE 1. Experimental Temperature Data in thc Thcrmophoretic Precipitator "C Location
Air Flow Top Plate Bottom Plate
Rate (L/min) Point #1 Point #2 Point #3 Point #4 Point #5 Point #6
H o t water tank temperature = 40 7"C, flow rate = 3 5 L/mm Old water ~ n l c t tcmpcrature = 20 8"C, flow rate = 0 77 L/mm
Location
Air Flow Top Plate Bottom Plate
Rate (LLmin) Point #1 Point #2 Point #3 Point #4 Point #5 Point #6
Hot water tank temperature = 30.3"C, flow rate = 3.5 L/rnin
Cold water inlet temperature = 20.g°C, flow rate = 0.77 L/min
176 C.-J. Tsai and H.-C. Lu
is about S.O°C/cm, which is very small compared with the second term of 410°C/ cm. Therefore, in this precipitator, the temperature gradient dT/dy can be con- sidered to be uniform in both axial and vertical directions, and its value can be calculated directly from the measured top and bottom plate temperature data as
Therefore, a very high and uniform temperature gradient can be setup easily in this thermophoretic precipitator as long as the gap is kept small. It is expected that the particle collection efficiency will be high when the temperature gradient is raised to a high value. To find the particle collection efficiency 77, the critical particle trajectory (x*, y*) for a particle to just deposit on the rear edge of the bottom plate must be found. Since the air flow becomes fully developed very quickly, one can assume a parabolic air velocity profile in the axial direction, and the particle equations of motion in the x and y direc- tions can be written as
Integrating above equations and setting x" = L, one can find the critical particle trajectory from the following equation as
Setting x* = 0 in thc above equation, the critical point at the duct entry, y*,, can be found from the following equation:
Then, the particle collection efficiency 77 can be calculated as
It is seen that particle collection efficiency 77 turns out to be the same as in the case of an uniform air velocity profile assump- tion. Using Eq. 9, the thermophoretic ve- locity U,, can therefore be calculated eas-
ily once the particle collection efficiency 77 is measured.
Besides high particle collection effi- ciency, there are additional advantages of using this thermophoretic precipitator. First, since the air flow is laminar in the precipitator, the precipitation flux of par- ticles is uniform along the axial direction. Furthermore, since most of particles have thermal conductivity much higher than that of air, one can see from Eq. 2 that the precipitation velocity and hence the precipitation flux for submicron particles is nearly independent of particle materi- als. But this statement is not true for supermicron particles with high thermal conductivity.
EXPERIMENTAL METHOD AND RESULTS
The experimental setup used to measure the particle collection efficiency is shown in Figure 3. Polydisperse NaCl or sodium fluorescein aerosol is generated using a constant output aerosol atomizer (TSI model 3076). The aerosol is dried in a
Plate-to-Plate Thermophoretic Precipitator 177
FIGURE 3. Schematic diagram of the experi- mental system.
diffusion dryer neutralized in an electro- static charge neutralizer (TSI model 30771, and passed through an electrostatic clas- sifier (TSI model 3071A) to generate monodisperse aerosol particles. The mon- odisperse aerosol is further neutralized by an electrostatic charge neutralizer before being introduced into the thermal precipi- tator. At a preset temperature gradient, the inlet and outlet aerosol concentra- tions are measured by a condensation nu- cleus counter (TSI model 3760). The par- ticle collection efficiency is calculated from these concentration data. For the
time being, the air flow rate through the precipitator is maintained at 0.4 L/min at ambient conditions.
In the experiment, particle loss due to Brownian diffusion is found to be impor- tant. When determining the particle col- lection efficiency due to thermophoretic effect, such particle loss has to be ac- counted for. Theoretical particle loss due to Brownian diffusion and gravitational settling in the thermal precipitation re- gion can be seen in Table 2 for NaCl particles at the temperature gradient of 502.63"C/cm. The maximum theoretical particle loss, 6.596, is due to Brownian diffusion, which occurs when the particle diameter is 0.04 pm. As can be seen in Table 2, the loss due to gravitational set- tling is negligible. In addition to the loss in the thermal precipitation region, it is found that loss of particles also occurs at other locations within the precipitator. The loss is particularly important at the entry and exit slots where flow may recir- culate and the residence time of aerosol particles are much longer than that in the thermal precipitation region. The amount of this particle loss can't be predicted by theory and has to be determined experi- mentally.
The amount of total particle loss, qL, was first determined experimentally by setting both the top and bottom plates at the same temperature. This temperature
TABLE 2. Particle Loss and Particle Collection Efficiency in the Therrnophoretic Precipitator, NaCl Particles, Temperature Gradient = 502.63"C/cm
Diffusion Loss (5%) Settling Loss (5%) Total Loss v , (5%) Total Measured Thermophoretic Dp ( pm) (Theory) (Theory) (Experiment) Efficiency v, (5%) Efficiency 7 (9'0)
0.04 6.5 0.0 27.8 63.5 49.4 0.06 3.8 0.0 20.8 59.4 48.7 0.08 2.7 0.0 19.0 57.3 47.3 0.1 2.1 0.1 18.7 55.1 44.8 0.2 1.0 0.2 15.0 52.0 43.5 0.3 0.7 0.3 14.2 50.2 41.3 0.4 0.5 0.5 13.2 47.7 39.7 0.5 0.4 0.9 11.3 47.8 41.1
178 C.-J. Tsai and H.-C. Lu
is the average between the top and bot- tom plate temperatures when the particle collection efficiency due to the ther- mophoretic effect, q, is to be determined at a certain temperature gradient. Total particle loss qL was found to be much greater than the theoretical particle loss in the thermal precipitation region alone. It decreases from 27.8% to 11.3% when the particle diameter is increased from 0.04 to 0.5 pm.
After determining the total particle col- lection efficiency r ) , which includes total
particle loss, the thermophoretic precipi- tation efficiency, q, is then calculated as 1 - (1 - r)T)/tl - qJ
The experimental collection efficiency due to thermophoretic effect is shown in Figure 4a for sodium fluorescein particles, and Figure 4b for NaCl particles at dif- ferent thermal gradients. Temperature gradients are 526.3" and 878.96"C/cm for sodium fluorescein particles, 502.63" and 836.84"C/cm for NaCl particles, respec- tively. Experimental uncertainty which is represented as an error bar is also indi- cated in Figure 4. The tested particle di- ameter ranges from 0.04 to 0.5 p m and the thermal conductivities are 0.016 and 0.00103 cal/(cm. s
.
K) for NaCl (Reist, 1993) and sodium fluorescein (Montasier et al., 1991) respectively. It is seen that the particle collection efficiency increases as the thermal gradient is increased or when the particle size is decreased. Also in this precipitator, the collection effi- ciency for submicron particles is consid- ered to be very high. For example, at the temperature gradient of 878.96'C/cm, the collection efficiency is above 75% for so- dium fluorescein particles smaller than 0.2 p m in diameter. It is expected that higher collection efficiency than the present data can be obtained if the temperature gradi- ent can be maintained above 890°C/cm.When plotted using the coordinate of the dimensionless thermophoretic veloc- ity, D;, T0/(v VT), versus the Knudsen
FIGURE 4. Particle collection efficiency in the precipitator at two different tcmperature gradi- ents. (a) sodium fluorescein particles (b) NaCl particles.
number, h/R, Figure 5 shows the present experimental data agree very well with the theoretical predictions by Talbot et al. (1980) for both two particle materials at different temperature gradients. The data clearly show that U,,T,,/(v VT) ap- proaches Waldmann's free molecular limit asymptotically as h/R goes to infinity. Also shown for comparison is the theoret- ical prediction by Derjaguin and Yalamov (1965, 1966), which is represented by Eq. 1. The present experiment indicates that the theory by Derjaguin and Yalamov (1965, 1966) overestimates the thermo- phoretic velocity substantially in the range of the Knudsen number tested. Although not shown in Figure 5, the corrected for-
Plate-to-Plate Thermophoretic Precipitator 179
sodium fluorescein
FIGURE 5. Comparison of experimental dimcn-
sionless thermophoretic velocities U,,T,/(u V T ) with theoretical prediction. (a) sodium fluorcs- cein particles (b) NaCl particles.
NaCl
mula by Derjaguin et al. (1976) also over- estimates the thermophoretic velocity very much.
1 -
0 8 -
CONCLUSION
An efficient plate-to-plate thermophoretic precipitator has been designed and tested. Forced convective heat transfer through the top and bottom plates provides a high and uniform temperature gradient be- tween plates, where submicron aerosol particles can be collected efficiently and uniformly in the direction of the air flow. The precipitator was tested in the labora- tory using NaCl and sodium fluorescein monodisperse test particles at high ther-
,
-...--- --...---- - -
,'
mal gradients. The present experimental data shows that the thermophoretic veloc- ity formula proposed by Talbot et al. (1980) is accurate.
Since the particle collection efficiency is predictable using simple equations, the present precipitator can be used as an effective submicron aerosol sampling de- vice. To increase sampling efficiency and flow rate further, the precipitation area or the temperature gradient can be in- creased from their present values. For example, it is easy to increase the present precipitation area of 21 cm2 to a value dictated by the desirable collection effi- ciency and flow rate.
Using this plate to plate thermophor- etic precipitator, more experimental data for low thermal conductivity materials and small Knudsen number flow can be ob- tained to further test various previous thermophoretic theories.
temp gradient = 502 6 3 'C/cm
This research was supported by a contract number NSC-80-0410-E-009-22 with the National Science Council, Taiwan, Republic of China.
REFERENCES
Bakanov, S. P. (1991). Aerosol Sci. Technol. 15:77-92.
Brock, J . R. (1962). 1. Colloid Sci. 17:768-780.
Derjaguin, B. V., and Yaramov, Yu. (1965). 1. Colloid Sci. 20:555-570.
Derjaguin, B. V., and Yalarnov, Yu. (1966). J. Colloid
Sci. 21:256-258.
Derjaguin, B. V., and Storozhilova, A. I. and Rabi- novich, Ya. I. (1966). J. Colloid Interface Sci. 21 :35-58.
Dcrjaguin, B. V., Rabinovich, Ya. I., Storozhilova, A. I. and Scherbina, G. I. (1976). J. Colloid Inte$ace Sci. 57:451-461.
Grecn, H. L., and Watson, H. H. (1935). Med. Res. Council Spec. Rept. No. 199, His Majesty's Station-
ary Office, London.
Kethley, T. W., Gordon, M. R., and Orr, C. (1952).
Science 116:368-369.
Kousaka, Y., Okuyama, K., Nishio, S., and Yoshida, T. (1976). J . Chem. Eng. 9:147-150.
Loyalka, S. K. (1992). J. Aerosol. Sci. 23:291-300.
C.-J. Tsai and H.-C. Lu
Montassier, N., Boulaud, D., and Renoux, A. (1991). J .
Aerosol Sci. 5:677-687.
Nazaroff, W. W., and Cass, G. R. (1987). J. Aerosol Sci. 18:445-455.
Reist, P. C. Aerosol Science and Technology, 2nd ed., McGraw-Hill, New York, 1993.
Schlichting, II. Boundary-Layer Theo~y, 7th ed., Mc- Graw-Hill, New York, 1979.
Stratmann, F., and Fissan, H. (1989). J. Aerosol Sci. 20399-902.
Stratmann, F., Fissan, H., and Papperger, A. (1988).
Aerosol Sci. Technol. 9:115-121.
Swift, D. L., and Lippmann, M. (1989). In Air Sampling Instruments for Evaluation of Atmospheric Con- taminants, 7th ed. American Conference of Gov- ernmental Industrial Hygienists Inc., pp. 387-403. Talbot, L., Cheng, R. K., Schefer, R. W., and Willis,
D. R. (19801, J. Fluid Mech. 101:737-758. Waldmann, L. (1959). Z. Natutf. 14:589-599.
Waldmann, L. (1961). In Rarefied Gus Dynamics (ed. L. Talbot), Academic, New York, p. 323.
Wright, B. M. (1953). Science 118:195.
Received Fcbruary 8, 1994; revised May 11, 1994