Pseudo three-dimensional vision-based nail-fold morphological and
hemodynamic analysis
Lun-Chien Lo a, Ker-Chung Linb, Yuan-Nian Hsuc, Tsung-Po Chend, John Y. Chiang e,*, Yung-Fu Chen f,g,*
a Department of Traditional Chinese Medicine, Changhua Christian Hospital, Changhua, Taiwan b Department of Director Center, Nantou Hospital, Department of Health, Executive Yuan, Nantou,
Taiwan
c Department of Director Center, Taoyuan General Hospital, Department of Health, Executive Yuan, Taoyuan, Taiwan
d Chen Tsung-Po Clinic, Taichung, Taiwan
e Department of Computer Science and Engineering, National Sun Yat-sen University, Kaohsiung, Taiwan
f Department of Healthcare Administration, Central Taiwan University of Science and Technology, Taichung, Taiwan
g Department of Health Services Administration, China Medical University, Taichung, Taiwan
*Corresponding Author: John Y. Chiang, Ph.D.
Associate Professor, Department of Computer Science and Engineering, National Sun Yat-sen University, Kaohsiung 80424, Taiwan.
Address: 70 Lienhai Rd., Kaohsiung 80424, Taiwan Tel: +886-934151515; Email: [email protected]
*Corresponding Author: Yung-Fu Chen, Ph.D.
Professor, Department of Healthcare Administration, Central Taiwan University of Science and Technology, Taichung 40601, Taiwan.
Address: 666 Buzih Road, Beitun District, Taichung 40601, Taiwan Tel: +886-4-22391647 Ext. 7285; Email:[email protected]
Abstract
In this study, a Pseudo three-dimensional Vision-based Nail-fold Morphological and Hemodynamic Analysis (PTVNMHA) is proposed to automatically extract morphological/hemodynamic features from a microscopic nail-fold image sequence, reconstruct the corresponding pseudo three-dimensional microvascular models, and visualize the dynamic blood flow in the model constructed. The morphological features extracted include the number, width/height, density, arteriolar limb caliber, curved segment caliber, venular limb caliber, blood color, tortuosity, and width of the curved segment of capillaries. The hemodynamic features identified are blood flow velocity and blood flow rate. All are significant pathological indicators with a spatial precision up to 1.6μm. The diameters of cross-sections along the centerlines of capillaries are identified and employed to reconstruct the pseudo three-dimensional microvascular surface meshes. The microscopic image sequence acquired is mapped to the corresponding microvascular model constructed to perform dynamic blood flow visualization. Compared with laser Doppler velocimtery, PTVNMHA can derive blood flow velocities for each capillary across the microscopic range separately in much higher precision and obtain diversified morphological and hemodynamic features of capillaries with a low-cost equipment setup. In addition to the blood flow velocity, blood flow rate, which keeps almost constant no matter where the measuring position is in a capillary, has also been measured and proposed as a useful feature to discriminate patients with hypertension from the normal with great significance (p<0.001). In the future, large scale experiments will be conducted to diagnose patients with anemia as well as patients with essential and secondary hypertension to verify effectiveness of the PTVNMHA system.
Keywords: Microcirculation; Finger nail-fold morphological/hemodynamic analysis; Pseudo three-dimensional capillary reconstruction; Blood flow velocity; Blood flow rate.
I. Introduction
Microcirculatory changes play a significant role in various vital functions in humans. Due to their size, capillaries present subtle blood circulation variations more acutely than larger blood vessels. Therefore, information about static and dynamic features of capillaries is a key indication of human physiological health. The observation of microcirculation focuses on finger/foot nail-fold, conjunctival, lingual surface and lips. Capillary nail-fold morphological changes and blood flow dynamics have been demonstrated relevant to the occurrence of many diseases, including black foot (Yu et al., 1995), Raynaud's phenomenon (Wollersheim et al., 1988; Bertuglia et al., 1999), diabetes (Chang et al., 1997),hypertension (Bonacci et al., 1996; Cesarone et al., 2000; Levy et al., 2001) and cardiac disease (Sellke, 2006). Finger nail-fold capillary microscopy, usually performed on the ring finger, is simple, non-invasive and expedient to visually observe capillaries and red blood cell (RBC) dynamics on skin surface.
Many approaches have been developed for extracting microcirculatory features and validated to provide pathological information, yet restrictions and disadvantages remained. Only a limited number of morphological features, namely, width/height, density and tortuosity of capillaries are derived by Riaño-Rojas et al. (2008). In the analysis of hemodynamic features, velocity estimation method (Ellis et. al., 1992) requires the vessel segments to be manually selected as a priori. The RBC velocity measurement (F. Langeder et al., 2009) can only be applied to the straight segments of a vessel. The laser Doppler velocimetry (Eiju T. et al., 1981) is frequentlyemployed in measuring the average and instantaneous velocity (Seki et. al., 1990) in vivo. Although it is able to quantify blood
flow of capillaries in a sampling volume (Struijker-Boudier et al. 2007), its resolution is not high as that of the capillaroscopy that assesses blood flow dynamics in one single capillary with a diameter close to the size of a RBC (10μm or so). Computational fluid dynamics (CFD) (Shih et al., 2011) is an approach based on three-dimensional description of the vessel lumen to estimate blood flow modeled by employing the Navier-Stokes equations. CFD calls for the inlet blood velocity, pressure
and viscosity as known a priori. Only static three-dimensional microvascular model is constructed. No morphological feature is provided, nor is the visualization of animated blood flow.
In this study, a pseudo three-dimensional vision-based nail-fold morphological and hemodynamic analysis (PTVNMHA) is proposed to extract not only morphological but also hemodynamic features of capillaries from a microscopic nail-fold image sequence automatically. The morphological features detected include number, width/height, density, arteriolar limb caliber, curved segment caliber, venular limb caliber, blood color, tortuosity and width of the curved segment of capillaries. The velocity of the blood flow, a salient hemodynamic feature, is measured by plasma gaps tracking (PT) between adjacent frames. All the features extracted are significant pathological indicators with a spatial precision up to 1.6μm. The pseudo three-dimensional reconstruction and visualization of microvascular lumen are provided to facilitate the observation of capillaries in any orientation, magnification and viewpoint desirable. The microvascular centerlines derived by medial-axis transform (MAT) and the radii of the corresponding microvascular cross-sections calculated by circular expansion are employed to determine the pseudo three-dimensional microvascular surface meshes. Finally, the source microscopic image sequence is dynamically mapped to the microvascular model constructed to perform animated blood flow visualization.
I. Material and methods
2-1 Experimental Setup and Image Processing
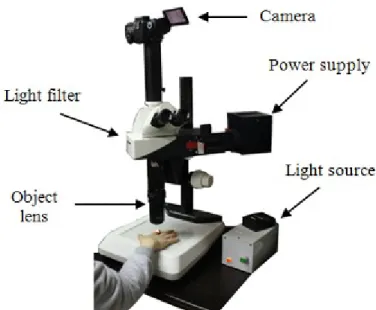
As shown in Fig. 1, a Leica MicroFluoTM microscope consisting of object lens with a magnification ratio of 330, a light source, and a camera (Canon 60D) with a video frame rate of 30 frames per second was employed to capture microscopic nail-fold image sequences, each consisting of 150 frames, for the measurement of capillary features. The dimension of an captured image is 640 480 pixels and the microscopic area observed is around 0.732 mm2, translating to an interpixel distance of around 1.6μm. Figs. 2(a) and (b) show two successive acquired frames.
Fig. 1. Leica MicroFluoTM microscope.
(a) (b)
(c) (d)
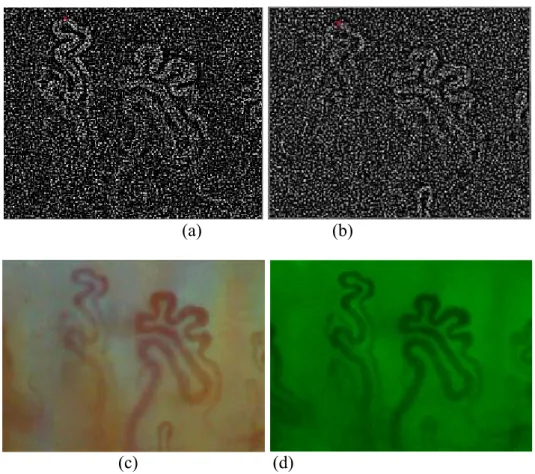
Fig. 2. (a), (b) Two successive frames acquired by the Leica MicroFluoTM microscope from a young healthy female. Note the displacement incurred due to the involuntary movement of subjects captured under a high magnification ratio has to be compensated. Microscopic image frames collected from patients with (c) chronic anemia (hairpin type capillary) and (d) hypertension (branched type capillary).
Capillary videos of five normal subjects (3 males and 2 females; age: 24-30) recruited from the university campus and five patients (3 males and 2 females; age: 42-50) with hypertension recruited from a local hospital were analyzed in this study. In addition, 1 patient with chronic anemia was also recruited to compare the morphological and hemodynamic characteristics with normal subjects and patients with hypertension. Each of them was diagnosed with no Raynaud’s phenomenon. As shown in Fig. 2(c), a hairpin capillary includes three sections, namely, arteriolar limb, curved segment, and venular limb. On the other hand, as shown in Figs. 2(a) and (b), a branched capillary consists of several arteriolar limbs, curved segments, and venular limbs. In peripheral microcirculation, blood flows in the arteriolar limb, passes through the curved segment, and then flows out of the venular limb. If a person suffers from microcirculation lesions, microvascular anomalies will be the first to reflect this abnormality.
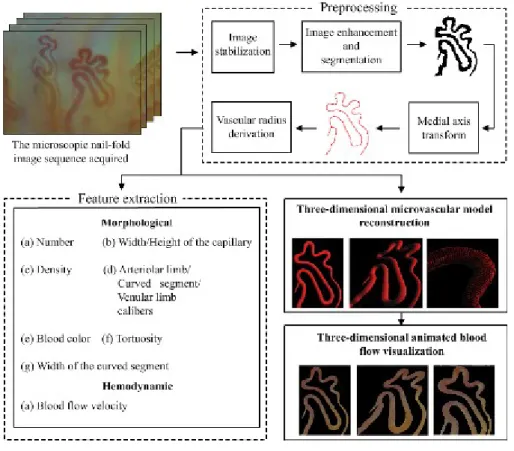
To extract the morphological/hemodynamic features from a microscopic nail-fold image sequence, a series of image processing steps are performed. Fig. 3 illustrates the processing flow diagram of the PTVNMHA. Image stabilization is first applied to stabilize the target vessels within the region of interest (ROI) by compensating motion between adjacent frames. Then, image enhancement is applied to facilitate the segmentation of the vascular and non-vascular areas. The morphological features are extracted by performing geometric analysis on vascular areas, while the hemodynamic one is derived by tracking plasma gaps presented in capillaries and identifying the corresponding displacements between two consecutive frames. The centerline of a capillary can be obtained by applying medial-axis transform (MAT) (Ward et al., 2010). The radius for every microvascular cross-section along the centerline can then be determined through a circular expansion procedure. Given the centers and the radii of microvascular cross-sections, the pseudo three-dimensional capillary surface meshes are constructed. The microscopic image sequence is mapped to the microvascular models built on a frame-by-frame basis to perform three-dimensional animated blood flow visualization.
Fig. 3. Processing flow diagram of PTVNMHA
Image stabilization: Capturing microscopic image sequences under high magnification ratio, even minute involuntary movement of the subject’s finger leads to erratic movements between frames. This problem becomes even more serious as the magnification of microscope increases. Stabilization is an indispensable step to compensate the interframe displacement. Laplacian of Gaussian (LoG) is the second order derivative of the Gaussian function usually used to evaluate the amount of high frequency components surrounding a pixel at (x,y).
2 2 2 4 2 2 2 2 1 ( , ) 1 , 2 x y x y LoG x y e (1)
where is the width of the Gaussian kernel. LoG filter is employed to detect pixels along the vascular regions, i.e., pixels with large LoG values, as control points for interframe matching. Figs. 4(a) and 4(b) illustrate the result after applying the LoG filter. The same vessels present between successive frames will be matched through the correspondence of control points. For a control point
( , )
t i i
previous frame t-1 to locate the matching pointpt1( , )x yj j . Once the correspondence between two control points in frames t and t-1 is established, the interframe displacement
( , x y) (xix yj, iyj) can be determined and compensated accordingly, as shown in Fig. 4(c).
(a) (b)
(c) (d)
Fig. 4. (a) and (b) LoG ( =1.4) results of the two successive frames shown in Figs. 2(a) and 2(b), respectively. The red dot corresponds to the pixel with maximum LoG value. The interframe motion vector detected is ( x y, ) ( 12, 20). (c) Motion-compensated image shown in Fig. 2(b) after image stabilization and (d) its green channel.
Image enhancement and segmentation: Due to the fact that the green channel usually possesses the highest degree of contrast between vascular and non-vascular areas in the color capillary images, as shown in Fig. 4(d), while the red and blue counterparts tend to be noisy. Therefore, only the green color component was utilized in segmenting vascular from non-vascular regions in a microscopic image.
the separation of ROI from an image. A globally enhanced image can help identify major vessels with the possibility of ignoring low-contrast capillaries with smaller diameters, Fig. 5(a), while a locally enhanced one can adapt to regional variations and detect capillaries with a wide range of diameters at the expense of enhancing noises, Fig. 5(b). In light of this observation, the images obtained by applying both the globally and locally enhancing operations are first converted into binary counterparts shown in Figs. 5(c) and (d), respectively. These two images are then fused together through the logic “AND” to remove background noises and short, spurious branches, as shown in Fig. 5(e). It can be found that undesirable artifacts remain visible after the fusion of globally and locally equalized binary images. Further pruning will be performed by utilizing temporal correlation of capillaries present between successive frames.
(g) (h)
Fig. 5. (a) Globaland (b) local histogram equalization of the green channel image shown in Fig. 4(d). Thresholding of the (c) global and (d) local equalization images by Otsu’s threshold selectionmethod (Otsu, 1979), followed by the (e) logic“AND” fusingthe binaryglobal and local equalization images to remove noises and short, spurious branches. (f) Capillaries identified after further processing in the temporal domain. (g) The central lines of the segmented vascular image with shortest branches
removed and the result after applying connected-component to the capillary regions corresponding to the central lines.
Other than segmenting vascular areas along the spatial domain, the precision of the capillaries identified can be improved by taking the temporal correlation into consideration. A capillary has to
be consistently present in the image sequence to be reliably classified as a vessel. Let C x y t( , , ) be
equal to 1 if a pixel P(x, y, t), i.e., pixel at location ( , )x y in frame t, is classified as belonging to a
capillary, 0 otherwise. The presence of a possible vascular area in a location ( , )x y is counted by
summing up the number of occurrences of a possible vessel among all images in an image sequence:
1 ( , ) N ( , , ), t count x y C x y t
(2)where count(x, y) indicates the occurrences of a vessel presented at (x, y) along the temporal axis and N the number of frames in an image sequence. When a pixel P(x, y, t) is determined as belonging to a vascular area, count(x, y) will be incremented by one. The count(x, y) serves as a reliability measure in summing up the total number of vascular presence in N image frames. If the count(x, y) of a pixel exceeds a threshold ζ, it can be reliably classified as belonging to a vascular area, and vice versa, as shown in Fig. 5(f).
Medial-axis transform (MAT): Medial shape representations, i.e., centerlines, permit the use of an object-centered coordinate system whose coordinates directly yield intuitively understood notions of shape, such as bending, thickness and elongation. Medial-axis transform (MAT) is a process by that an object is represented as a skeleton with one-pixel thickness. The segmented vascular image is processed by the MAT to derive the centerline of a capillary (Ward et al., 2010). Fig. 5(g) illustrates the centerlines obtained after applying MAT and pruning of the shorter branches. A pixel located on the centerline can be viewed as the center of the corresponding cross-section of a capillary. In this way, a circular cross-section of a capillary can be defined with a center pixel located on the centerline and the corresponding radius, as shown in Fig. 6.
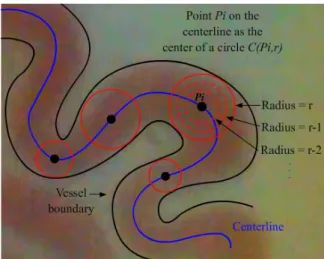
Derivation of vascular radius: The radius of a cross-section of a capillary can be determined by taking a pixel Pi on the centerline as the center of a circle C(Pi, r) first, and then expanding the radius r of the circle gradually until touching the boundary of a vessel, as shown in Fig. 6. The circular expansion algorithm is summarized as follows:
Algorithm: Circular expansion
Input: Segmented image R, Fig. 5(f), and a set of centerlines L, Fig. 5(g). Output: Radii corresponding to all of the cross-sections along the centerline.
STEP 1: Consider a pixel Pi on L as the center of a circle with a radius r, denoted as C(Pi, r). STEP 2: If a vascular area covers the C(Pi, r) completely, then the radius r will be expanded
with a stepsize 1, i.e. r=r+1, and repeat STEP 2; else, go to STEP 3 (i.e., at least one pixel on C(Pi, r) belongs to the non-vascular area in the segmented image).
STEP 3: Output r as the radius of the pixel Pi. The duple (Pi, r) defines a cross-section along the vessel.
Fig. 6. Circular expansion is employed to identify the radius of a vessel cross-section.
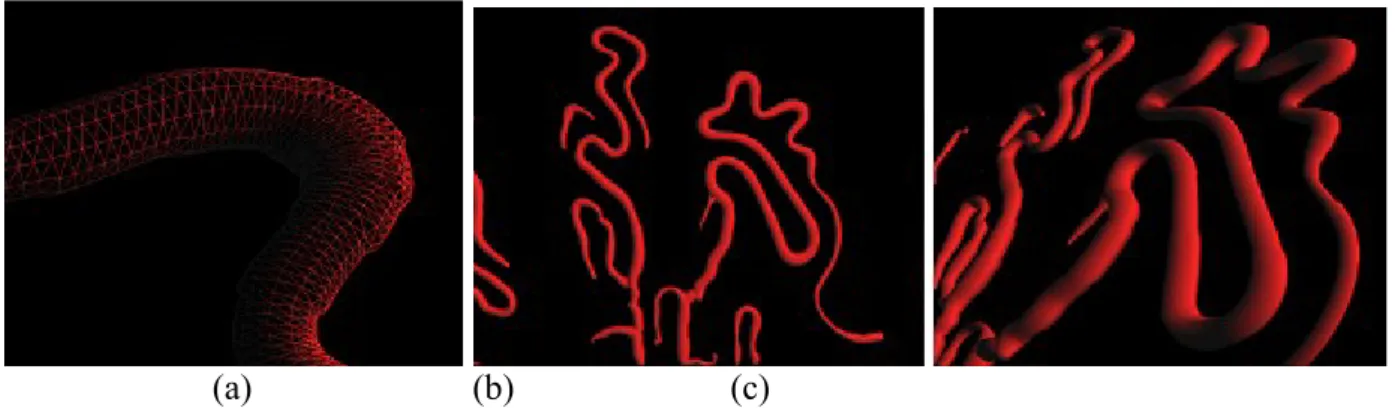
When STEP 3 is reached, the circle after expansion intersects with the boundary of the vessel. The pixel Pi located on the centerline and the corresponding radius r identified form an accurate description of the vascular cross-section. The meshes formed on the vascular surface can be determined by connecting the vertices along adjacent vascular cross-sections, as shown in Fig. 7(a).
In this way, the pseudo three-dimensional microvascular structure can be formed, as illustrated in Figs. 7(b) and 7(c).
(a) (b) (c)
Fig. 7. (a) The corresponding pseudo three-dimensional microvascular surface meshes and its (b) front and (c) perspective views.
2-2 Morphological Features
Nail-fold capillary abnormalities are significant pathological symptoms of microcirculation diseases. In order to extract the morphological features for each capillary separately, the connected-component labeling technique is employed to classify vascular regions according to the connectivity criterion. The connected-component labeling is an operation to transform a binary image into a symbolic counterpart in that connected components are assigned a unique label (Gonzalez and Woods, 2002). In Fig. 5(h), the connected regions of capillaries corresponding to the centerline set in Fig. 5(g) are identified and labeled by different colors. After identifying the connected regions within the capillaries, the morphological and hemodynamic features can be extracted on a per capillary basis. The procedures for extracting relevant morphological features are delineated below.
Number of capillaries: The number of capillaries is subjected to abnormal increasing in the face of anoxia and decreasing for shock. The number of capillaries is equal to the maximum index of labels of connected component assigned, e.g., the number of capillaries is 6 in Fig. 5(h).
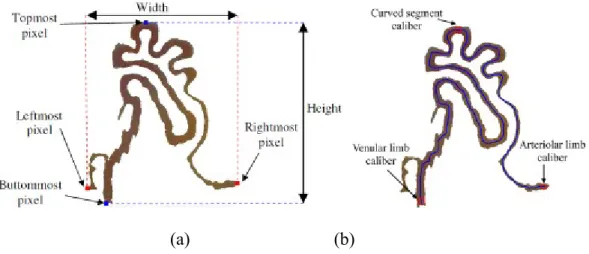
Width/Height of a capillary: The width and height of a capillary reflects the health condition of a person. A person with an over-long capillary usually suffers hypertension and arteriosclerosis, while a shorter one often comes with cardiac insufficiency. The width W of a capillary is calculated
by W=XRmost-XLmost, where XRmost and YLmost denote the x-coordinate of the rightmost and leftmost pixel, respectively. The height H is equal to YBmos-YTmos, where YBmost is the y-coordinate of the buttommost pixel and YTmos that of the topmost one, as shown in Fig. 8. The basin area of a capillary is defines as W x H.
(a) (b)
Fig. 8. (a) The width/height of a capillary. (b) Arteriolar limb/curved segment/venular limb caliber of capillary.
Density: A decreasing density of capillary can be found in patients with sclerodactyly, digital ulcers, tuft resorption and telangiectasia (Houtman et al., 1985). Capillary rarefaction was also reported in hypertensive patients (Antonios et al. 1999, Serné et al. 2001, Struijker-Boudier et al. 2007). The density of capillary is calculated by dividing the number of capillaries N with the observable microscopic range A.
Calibers of arteriolar limb, curved segment, and venular limb: The caliber of a capillary is a significant pathological indicator. An abnormal dilating of calibers often appears in patients with hypertension and coronary heart disease, while abnormal shrinking with hypotension and nephrosis. The radii of pixels on the centerline are derived by the aforementioned MAT and circular expansion procedures. The diameters associated with the two end pixels and topmost pixel correspond to the calibers of the arteriolar limb, venular limb and curved segment, as shown in Fig. 9. The end pixel with larger diameter is usually associated with venular limb and the smaller one arteriolar limb.
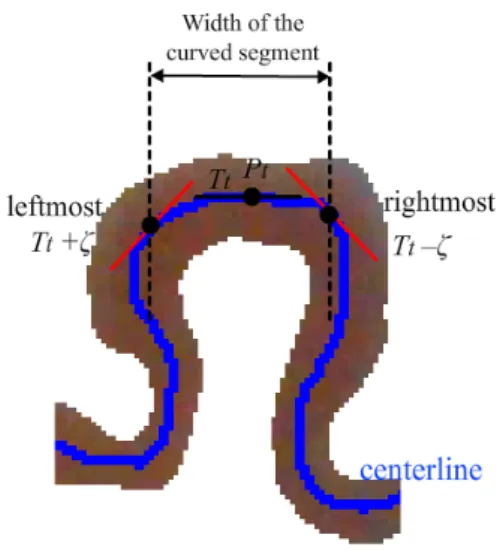
Fig. 9. The width of the curved segment of a capillary.
Width of the curved segment of a capillary: The capillary with an over-wide curved segment is an evidence of the blood stasis syndrome in microcirculation. Pixels along the same curved segment of a capillary possess approximately the same slope of tangent line. Following this line of thought, let the tangent slope for the topmost pixel Pt on the capillary centerline be Tt. The set of connected neighboring pixels {Pn} of Pt along the centerline with tangent slopes between Tt –ζ and Tt +ζ forms the curved segment. The width of the curved segment of a capillary is the horizontal distance travelled between the rightmost and leftmost constituent pixels, as shown in Fig. 9.
Tortuosity of a capillary: The tortuosity of blood vessels, e.g., retinal and cerebral blood vessels, is a vital medical sign. Capillaries with a high degree of tortuosity have been found in patients withpsoriatic arthritis. Diabetic patients tend to possess more tortuous capillaries (Pazos-Moura et al., 1987). The microvascular centerline is divided into a plural number of constituent parts N, each sharing the same sign of curvature. The arc-chord ratio for the constituent part i is defined as Li/ Si, where Li is the length of the ith constituent part and Si the Euclidean distance between the two endpoints of Li. The tortuosity τ of a capillary can be estimated by the following equation (Enrico et al., 2003): 1 1 1 , N i i i N L L S
(3)where N indicates the number of constituent parts of a capillary and L the total length of N
constituent parts, i.e.,
1 N i i L L
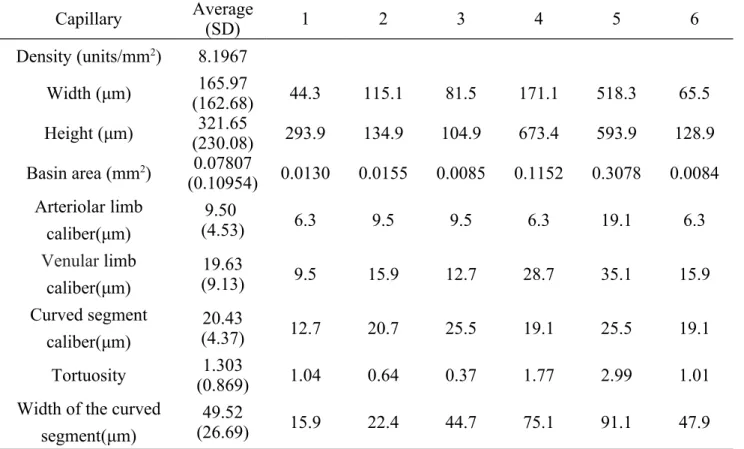
. Notice that the tortuosity of a straight line is 0.Table 1 demonstrates the morphological features extracted from the six capillaries of a normal subject shown in Fig. 5(h). As shown in this table, features of capillaries with different basin areas are quite different. Most bloods in the capillaries with larger basin areas flow in the plane parallel to the nail-fold surface, while the capillaries with smaller basin areas are suspected to flow in an oblique plane with respect to the nail-fold surface. The measured blood flowing velocity of the capillary situated in an oblique plane tends to be smaller than the real value. Hence, only the capillary with the maximum basin area of an individual was adopted for calculating features to be compared between normal subjects and diseased patients.
Table 1 The morphological features extracted for the six capillaries of a normal subject.
Capillary Average(SD) 1 2 3 4 5 6 Density (units/mm2) 8.1967 Width (μm) (162.68)165.97 44.3 115.1 81.5 171.1 518.3 65.5 Height (μm) (230.08)321.65 293.9 134.9 104.9 673.4 593.9 128.9 Basin area (mm2) 0.07807 (0.10954) 0.0130 0.0155 0.0085 0.1152 0.3078 0.0084 Arteriolar limb caliber(μm) 9.50 (4.53) 6.3 9.5 9.5 6.3 19.1 6.3 Venular limb caliber(μm) 19.63 (9.13) 9.5 15.9 12.7 28.7 35.1 15.9 Curved segment caliber(μm) 20.43 (4.37) 12.7 20.7 25.5 19.1 25.5 19.1 Tortuosity (0.869)1.303 1.04 0.64 0.37 1.77 2.99 1.01
Width of the curved segment(μm)
49.52
2-3 Hemodynamic Features
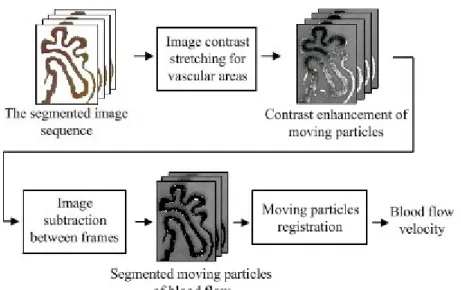
Blood flow velocity: Blood plasma is the yellow liquid component of blood in which the blood cells are suspended. It makes up about 55% of the total blood volume. It is mostly water (93% by volume) and contains dissolved proteins, glucose, clotting factors, mineral ions, hormones and carbon dioxide. The movement of suspended blood cells and dissolved particles between successive frames is used to estimate instantaneous and average blood flow velocity. However, the low-contrast blood cells and plasma pose a great challenge for automatic tracking. Contrast stretching and image subtraction are performed first to enhance the blood cells and plasma within a vessel, as shown in Fig. 10.
Contrast stretching is performed for the vascular areas on segmented image sequence, as shown in Figs. 11(a) and (b). Image subtraction between two adjacent frames is followed to identify moving particles within blood flow. In Fig. 11(c), the white sub-regions represent moving particles identified.
Fig. 10. Registration of the moving particles within vascular areas through contrast stretching and image subtraction.
Once moving particles are identified preliminarily through interframe subtraction, a pruning of sporadic noises is performed based on the size of the moving particles. The existing moving particles
might disappear and new ones might emerge from one frame to another as a result of occlusion and circulatory exchange between capillaries and surrounding tissues. The correspondence of moving particles between successive frames is subsequently followed. Three possible scenarios might occur: (1) a matching pair of moving particles is found, (2) an existing moving particle is disappeared, and (3) new moving particles emerge. Since the moving particle is not a rigid body, i.e., its shape might change from one frame to another, the particles cannot be identified through similarity of shapes. A distance-based criterion is employed to establish correspondence of moving particles between
neighboring frames. For every moving particle 1, i
t t
m identified after noise removal, as shown in Fig. 11(c), a matching procedure is performed within a pre-defined distance along the blood flow direction in the next interframe difference between frames t and t+1. If exactly one moving particle
, 1 j t t m is found, then ( 1, , , 1) i j t t t t
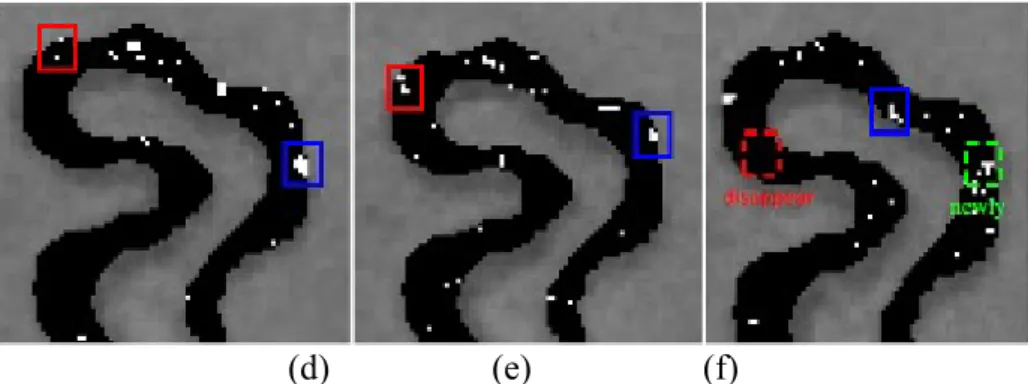
m m forms a matching pair. If more than one moving particles are found, then the closest one is chosen as the matching moving particle. However, if no moving particle existing within the pre-defined distance, it corresponds to the instance that an existing moving particle disappears. The remaining unassigned moving particles in the interframe difference between frames t and t+1 are regarded as the newly emerged ones. The identification of moving particles travelling within a capillary is shown in Figs. 11(d)-(f). The blue and red rectangles track the same moving particles present in different positions of successive frames. The red rectangle with dotted line shown in Fig. 11(f) corresponds to a disappeared moving particle, while the green dotted rectangle marks a newly emerging moving particle.
(d) (e) (f)
Fig. 11. (a) and (b) Contrast stretching of vascular areas in two successive frames. (c) The white dots correspond to identified moving particles. Detection and tracking of the moving particles in three successive frames from (d)-(f). Note the red rectangle with dotted line in (f) corresponds to the case that an existing moving particle disappeared, while the green rectangle with dotted line marks a newly emerging moving particle.
The distance propagated by a moving particle i between two successive frames t-1 and t can be
determined by comparing the centers of mass
1, 1, ( t i, t i)
p x y and p x y( t i,, t i,) in matching moving
particles, i.e., 2 2
, ( , 1, ) ( , 1, )
i t t i t i t i t i
d x x y y . Once all the interframe displacements between matching moving particles are derived, the instantaneous blood flow velocity Vt in a capillary is obtained by dividing the average distance travelled by all matching moving particles with the interframe duration Δt, as follows:
, 1 / , N i t i t d N V t
(4)where N is the total number of matching moving particles. In tracking the distance travelled by moving particles between successive frames, it starts from the moving particles defined in frame t, and then searches the matching moving particles in frame t-1. If the matching moving particles are found, the distance will be recorded. When a moving particle disappears in the next frame, this vanished particle is marked as missing. In the face of newly emerged moving particle, the procedure described above will be reapplied. Finally the average velocity of a capillary can be derived by dividing the accumulated distance travelled within the duration of the image sequence. Besides,
through the correspondence of moving particles between successive frames, the associated directions can also be detected as from arteriolar to venular limb, or vice versa. Figure 12 illustrates the instantaneous velocity of a capillary (Capillary #5 of Table 1) within a recording period of 5 seconds. Notice that the velocity of a sampling time indicates the average velocity of the matching moving particles in the capillary obtained from Eq. (4).
Fig. 12. The instantaneous average velocity of a capillary within a recording period of 5 seconds. A comparison of the velocities calculated using our proposed method and the optical flow estimation (Wu et al. 2009) for 3 capillaries is shown in Table 2. The calculated velocities are very similar without significant difference (t-test, p>0.9) between 2 methods with a root mean square difference (RMSD) of 2.74 μm/s (0.67%), 3.75 μm/s (0.64%), and 2.76 μm/s (0.99%), respectively, for 3 capillaries.
Table 2 A comparison of average blood flow velocity between the proposed method and optical flow estimation (OFE). Notice that the measured velocities between two methods are very similar without significant difference (t-test, p>0.05)
Average
velocity (μm/s) Capillary 1 2 3 4 5 6 Mean(SD)
Normal This method 392.6 486.5 434.9 349.3 341.3 463.1 411.28
V el oc ity ( μm /s ec ) Time (second)
(Branched type) (54.76) OFE 391.9 482.8 435.2 349.1 345.9 466.2 (53.57)411.85 Difference 0.7 3.7 -0.3 0.2 -4.6 -3.1 RMSD 2.74 (0.67%) Patient with anemia (Hairpin type) This method 641.2 549.5 537.9 434.2 744.2 X (104.55)581.40 OFE 645.8 544.7 539.2 433.9 739.3 X 580.58 (103.88) Difference -4.6 4.8 -1.3 0.7 4.9 X RMSD 3.75 (0.64%) Patient with hypertension This method 291.0 264.2 256.4 338.1 237.4 X 277.42 (34.88) OFE 294.2 267.3 253.2 340.2 239.3 X (35.65)278.84 Difference -3.2 -3.1 3.24 -2.1 -2.1 X RMSD 2.76 (0.99%)
Blood flow rate: The blood flow rate, defined as the blood flow volume per unit time, within a capillary should remain constant, irrespective of the diameter of the vascular cross-section. A faster blood flow will be observed in a cross-section with a smaller diameter, while a slower movement will be encountered in a wider one. The blood flow volume V of a cross-section can be traced by
following the motion of a plasma gap. Let a plasma gap travel from location
t
p
to1
t
p
in a unit time. At time t, the plasma gap resides in a cross-section with a radius r(t) having a cross-sectional area of πr2(t). The blood flow rate V is formulated as follows:t1 2
( ) .
tp p
V
r t dt
(5)The values of blood flow volume in different positions along the capillary can serve as a validity test of our method for deriving the blood flow velocity and the radius of the vascular cross-section. As indicated in the examples shown in Fig. 13, the instantaneous blood flow velocity and flow rate of three cross-sections with different sizes of radii located at arteriolar limb, curve segment, and venular limb, respectively, are calculated. As shown in Table 3, it can be found that the blood flow
rate keeps almost constant and is independent of the capillary positions at three different sections even their flow velocities and radii are quite different. Higher velocity occurs at the section with smaller radius, while the section with larger radius tends to have lower velocity. The flow velocity is generally different at different capillary positions, which makes it difficult to be adopted as a unified feature for characterizing the capillary hemodynamic property. In contrast, blood flow volume rate is a unified variable which can be measured at any capillary positions and is able to discriminate the hemodynamic property between normal subjects and diseased patients (t-test, p<0.001) no matter the capillary is simple hairpin type or more complicated branched type .
(a) (b)
(c)
Fig. 13. Three cross-sections located in arteriolar limb, curved segment, and venular limb with different radius sizes for a capillariy of (a) a normal subject (branched type), as well as capillaries of patients (b) with anemia (hairpin type) and (c) with hypertension, respectively.
Table 3 The instantaneous blood flow velocity, cross-sectional radius and blood flow volume per
unit time for arteriolar limb, curve segment and venular limb in 3 capillaries. Note: comparison between normal subjects and patients with *p<0.001 (t-test).
Capillary Position velocity (μm/sec)Instantaneous Radius(μm) (mmBlood flow rate3/sec x 106)*
Normal (Branched) Arteriolar limb 873.4 9.6 293 Curve segment 352.2 11.2 294 Venular limb 263.8 14.4 294 Mean (SD) 496.47(268.94) 11.73(2.00) 294 (0.6) Patient with Anemia (Hairpin) Arteriolar limb 684.2 6.3 128 Curve segment 520.6 8.0 126 Venular limb 481.3 9.6 124 Mean (SD) 562.03(87.86) 7.97(1.35) 126 (2) Patient with hypertension Arteriolar limb 861.2 14.4 399 Curve segment 587.8 22.4 403 Venular limb 186.3 36.8 402 Mean (SD) 545.10(277.18) 24.53(9.27) 401 (0.2)
For a hairpin capillary, it can be clearly divided into an arteriolar limb, a curved segment, and a venular limb with different velocities (Shih et al. 2011). However, multiple arteriolar limbs, curved segments, and venular limbs are generally observed for a branched capillary. In previous investigations, the capillaries used for hemodynamic analysis were mostly hairpin type that different flow velocities in different parts could be easily calculated (Wu et al. 2009, Shih et al. 2011). However, for the capillaries with types different from hairpin, i.e. branched type, average flow velocities need to be calculated for individual capillaries.
2-4 Pseudo Three-Dimensional Microvascular Model Reconstruction
After the derivation of the centerlines and diameters of every cross-section within vessels, the
pseudo three-dimensional microvascular model can be reconstructed, as shown in Figs. 7(b) and
7(c). The image sequence stabilized will be mapped to the pseudo three-dimensional microvascular models on a frame-by-frame basis to perform animated blood flow visualization, as shown in Figs. 14(a) and (b). The dynamics of the blood flow captured by the camera can be observed at any desirable orientations, magnifications, and viewpoints.
(a) (b)
Fig. 14. Pseudo 3D visualization of the dynamic blood flow of capillary vessels in (a) front view and (b) perspective view.
II. Results
Table 4 compares the morphological and hemodynamic features between the capillary of a normal subject and the capillaries of patients with anemia and with hypertension, respectively. It can be found that calibers of the arteriolar limb, curve segment, and venular limb are able to discriminate the normal subject from the hypertensive patient (t-test, p<0.05). However, only the average blood flow velocity can be used to discriminate the normal subject from the patients with either anemia or hypertension (t-test, p<0.001). Other features are incapable of discriminating the normal from the patients (t-test, p>0.05). Hence, only the features, including arteriolar limb caliber, venular limb caliber, curved segment caliber, average blood flow velocity, and blood flow rate, which show potential in discriminating the normal from the patient with hypertension were adopted for further study.
Table 4 Comparisons of morphological and hemodynamic features between a normal subject and
patients with anemia and with hypertension, respectively. Note: significance with *p<0.05 and **p<0.01 (t-test).
Capillary Normal (6 capill.) Anemia (5 capill,) Hypertension (5 capill.)
Density (units/mm2) 8.20 6.83 6.83
Width (μm) 165.97 (162.68) 71.58 (31.65) 181.66 (91.36) Height (μm) 321.65 (230.08) 366.62 (96.52) 370.14 (138.20)
Basin Area (mm2) 0.07807 (0.10954) 0.02858 (0.01906) 0.08863 (0.06827) Arteriolar limb
caliber (μm) 9.50 (4.53) 5.70 (2.15) 19.14 (9.10)
*
Venular limb caliber
(μm) 19.63 (9.13) 12.40 (3.24) 43.16 (9.73) * Curved segment caliber (μm) 20.43 (4.37) 18.16 (4.95) 35.46 (10.45) * Tortuosity 1.303 (0.869) 0.992 (0.261) 1.162 (0.358) Width of the curved
segment (μm) 49.52 (26.69) 37.74 (5.38) 116.70 (58.54) Average blood flow
velocity (μm/s) 411.28 (54.76) 581.40 (104.55)
** 277.42 (34.88)**
Tables 5 and 6 show the features obtained from 5 normal subjects and 5 patients with hypertension, respectively. After comparing the individual features using student’s t-test, it was found that only average blood flow velocity and blood flow rate are significantly different (p<0.01) between the normal subjects and the patients with hypertension. These two features demonstrate to have great potential in the diagnosis of hypertensive patients using microvascular nail-fold microscopic images.
Table 5 The morphological features extracted for capillaries of five normal subject, each contributes
a capillary with maximum basin area. Note: significant difference with * p<0.01 when compared with the hypertensive patients using student’s t-test.
Normal subject 1 2 3 4 5 Mean (SD)
Basin area (mm2) 0.1576 0.3078 0.3203 0.2792 0.1252 0.23802 (0.08066) Arteriolar limb caliber (μm) 9.3 19.1 11.5 19.5 6.3 13.14 (5.30) Venular limb caliber (μm) 15.5 35.1 18.9 22.7 28.7 24.18 (7.00) Curved segment caliber (μm) 23.7 32.5 29.4 22.5 19.1 25.44 (4.85)
Average blood flow
Blood flow rate
(mm3/sec x 106)* 342 294 240 267 312 291 (35.29)
Table 6 The morphological features extracted for capillaries of five patients with hypertension, each
contributes a capillary with maximum basin area. Note: significant difference with *p<0.01 when compared with the normal using student’s t-test.
Normal subject 1 2 3 4 5 Mean (SD)
Basin area (mm2) 0.1931 0.1146 0.1736 0.2658 0.1896 0.18734 (0.04832) Arteriolar limb caliber (μm) 12.7 21.8 27.2 12.5 19.2 18.68 (5.60) Venular limb caliber (μm) 47.9 40.2 26.8 19.8 43.8 35.70 (10.64) Curved segment caliber (μm) 44.7 40.9 25.8 26.9 18.7 31.40 (9.80)
Average blood flow
velocity (μm/s)* 256.4 227.8 229.3 296.6 320.9
266.20 (37.01)
Blood flow rate
(mm3/sec x 106)* 379 389 401 332 426 385.4 (30.97)
III. Discussions and Conclusions
As shown in Tables 5 and 6, the calibers of arteriolar limb, curved segment, and venular limb of
capillary for normal subjects are all smaller than the patients with hypertension. It can be explained
by that increased blood pressure tends to cause capillary dilation, which damages end-organ sites and
leads to hypertension, proteinuria, and edema (Jerath et al. 2009). Contrast to the capillary, inward
eutrophic remodeling of resistance vasculature of small arteries is manifested as reduced lumen, an
increase of ratio of media width to lumen diameter, and constant media cross-sectional area for
patients with essential hypertension (For review, see Feihl et al. 2008, Mulvany 2008, Rizzoni and
hypertensive patients (Lehmann and Schmieder 2011). Our data obtained from nail-fold capillaries
demonstrate a slight increase of capillary diameter for hypertensive patients; however, significant
difference between the normal subjects and hypertensive patients is not observed (t-test, p>0.05),
which is consistent to the result obtained by de Araújo Penna et al. (2008). Different muscular
characteristics between the subcutaneous small arteries and cutaneous capillaries might be the reason
causing such a variation.
The average blood flow velocity for the hypertensive patients is significantly lower than the
normal subjects (t-test, p<0.01), as indicated in Tables 5 and 6. This finding again is consistent to the
experimental result of de Araújo Penna et al. (2008). Recently, patients with systemic sclerosis were
also reported to have significant decrease in blood flow velocity compared to healthy controls
(Mugliet al. 2009). On the other hand, it was reported that after 3 months of active treatment of
anti-hypertension medication Enalapril, an angiotensin-converting enzyme inhibitor (ACE), for patients
with mild-to-moderate hypertension the blood flow velocity, the blood flow velocity increased
significantly (p<0.005) immediately after local cooling (Martina et al. 1999). It mimics the
effectiveness of the Enalapril in treating hypertention by improving the capillary hemodynamics.
The PTVNMHA proposed in this paper can automatically perform motion compensation, capillary identification, morphological/hemodynamic features extraction and pseudo three-dimensional blood flow visualization from a nail-fold microcirculation image sequence. The morphological/hemodynamic features derived are significant pathological indicators for many diseases, such as hypertension, anemia, diabetes and microcirculation lesion. Although Laser
Doppler flowmetry has been used to measure vasomotion from the flowmotion of blood, it is not vessel specific and cannot be used to detect vasomotions of individual arterioles (Salerud et al. 1983, Koutsiaris et al. 2010). Hence, compared with the laser Doppler velocimetry that can only estimate the average and instantaneous blood velocity and perfusion within the sampling area (Struijker-Boudier et al. 2007), PTVNMHA is capable of measuring the blood flow velocity and blood flow rate of every capillary located across the observed microscopic area separately with a higher precision and lower equipment setup cost. Pseudo 3D animated blood flow visualization is a powerful diagnostic tool allowing the observation of capillaries in any orientation, magnification and viewpoint desirable. The automatic extraction of structural and functional features of capillaries can provide objective and reliable morphological/hemodynamic information and have the potential to facilitate studies relevant to the temporal progression of microvascular diseases, e.g., microangiopathy, peripheral vascular disease (PVD) or diabetic neuropathy, or the finding of a significant index for a specific disease through the automatic analysis of a large amount of microvascular images. The proposed PTVNMHA can be easily adapted to derive a diversity of quantities such as aggregate capillary length, capillary hematocrit and red blood cell spacing, when the needs arise- a unique characteristic unmatchable by other existing methods or equipments. The precision of the features obtained will also keep improving as the resolution of the image capturing device increases. The limitation of this study is that only five patients with hypertension and one patient with anemia were recruited for the measurement of morphological and hemodynamic features. More patients with cardiovascular diseases are needed to be tested to confirm the findings of this study in the future.
In conclusion, the contributions of this study are as follows: (1) Contrast to the previous studies (Wu et al. 2009, Shih et al. 2011), the PTVNMHA system developed provides not only the functions to calculate hemodynamic features but also the operations to calculate morphological features. (2) As reported by de Araújo Penna et al. (2008), the evidence that average blood flow velocity of the hypertensive patients is significantly lower than the normal subjects has been further confirmed in
this study. (3) In addition to blood flow velocity, the blood flow rate has also been proposed and demonstrated to be a useful feature for discriminating the hypertensive patients from the normal. Contrast to the blood flow velocity, blood flow rate is very uniform in different positions of a capillary, which can be measured much easier than the blood flow velocity calculated in various capillary positions with different values (Shih et al. 2011) . Blood flow rate is superior to the blood flow velocity in the diagnosis of suspected patients with mild hypertension before deteriorating.
References
Antonios, T.F.T., Singer, D.R.J., Markandu, N.D., Mortimer, P.S., MacGregor, G.A., 1999. Rarefaction of skin capillaries in borderline essential hypertension suggests an early structural abnormality. Hypertension 34, 655-658.
Bertuglia, S., Leger, P., Colantuoni, A., Coppini, G., Bendayan, P., Boccalon, H., 1999. Different flowmotion patterns in healthy controls and patients with Raynaud's phenomenon. Technol. Health Care 7, 113–123.
Bonacci, E., Santacroce, N., D'Amico, N., Mattace, R., 1996. Nail-fold capillaroscopy in the study of microcirculation in elderly hypertensive patients. Arch. Gerontol. Geriatr. (suppl. 5), 79–83. Cesarone, M.R., Incandela, L., Ledda, A., De Sanctis, M.T., Steigerwalt, R., Pellegrini, L., Bucci,
M., Belcaro, G., Ciccarelli, R., 2000. Pressure and microcirculatory effects of treatment with lercanidipine in hypertensive patients and in vascular patients with hypertension. Angiology 51, 53–63.
Chang, C.H., Tsai, R.K., Wu, W.C., Kuo, S.L., Yu, H.S., 1997. Use of dynamic capillaroscopy for studying cutaneous microcirculation in patients with diabetes mellitus. Microvasc. Res. 53, 121–127.
de Araújo Penna, G.L., de Freitas Garbero, R., Neves, M.F., Oigman, W., Bottino, D.A., Bouskela, E., 2008. Treatment of essential hypertension does not normalize capillary rarefaction, Clinics 63(5), 613-8.
Eiju, T., Matsuda, K., Ohtsubo, J., Honma, K., Shimizu, K., 1981. Frequency sihfting of LDV for blood velocity measurement by a moving wedged glass, Applied Optics, Vol. 20, No. 22, 3833-3837.
Ellis, C.G., Ellsworth, M.L., Pittman, R.N., Burgess, W.L., 1992. Application of image analysis for evaluation of red blood cell dynamics in capillaries. Microvasc. Res. 44, 214–225.
Grisan, E., Foracchia, M., Ruggeri, A., 2003. A novel method for automatic evaluation of retinal vessel tortuosity. Proceedings of the 25th Annual International Conference of the IEEE EMBS, Cancun, Mexico.
0201180758).
Houtman, P.M., Kallenberg, C.G., Wouda, A.A., The, T.H., 1985. Decreased nailfold capillary density in Raynaud's phenomenon: a reflection of immunologically mediated local and systemic vascular disease?, Ann Rheum Dis. 44(9), 603-609.
Jerath, R., Barnes, V.A., Fadel, H.E., 2009. Mechanism of development of pre-eclampsia linking breathing disorders to endothelial dysfunction, Medical Hypotheses, 73, 163-166.
Koutsiaris, A.G., Tachmitzi, S.V., Papavasileiou, P., Batis, N., Kotoula, M.G., Giannoukas, A.D., Tsironi, E., 2010. Blood velocity pulse quantification in the human conjunctival pre-capillary arterioles, Microvascular Research, 80, 202-208.
Langeder, F., Zagar, B.G., 2009. Image processing strategies to accurately measure red blood cell motion in superficial capillaries. IEEE Conf. Systems, Signals and Devices, pp. 1-5.
Lehmann , M . V ., Schmieder , R . E ., 2011. Remodeling of retinal small arteries in hypertension, Am J Hypertens , 24(12), 1267-73.
Levy, B.T., Ambrosio, G., Pries, A.R., Struijker-Boudier., 2001. Microcirculation in hypertension: a new target for treatment, Circulation 104, 735-740.
Milner, S.M., Bhat, S., Gulati, S., Gherardini, G., Smith, C.E., Bick, R.J., 2005. Observations on the microcirculation of the human burn wound using orthogonal polarization spectral imaging. Burns 31, 316–319.
Martina, B., Frach, B., Surber, C., Drewe, J., Battegay, E., Gasser, P., 1999. Capillary Blood Cell Velocity in Finger Nailfold: Effect of Enalapril and Mibefradil in Patients with Mild to Moderate Hypertension, Microvascular Research 57, 94–99.
Mugii, N., Hasegawa, M., Hamaguchi, Y., et al., 2009. Reduced red blood cell velocity in nail-fold capillaries as a sensitive and specific indicator of microcirculation injury in systemic sclerosis, Rheumatology 48, 696-703.
Mulvany, M.J., 2008. Small artery remodelling in hypertension: causes, consequences and therapeutic implications, Med Biol Eng Comput 46, 461-467.
Otsu, N., 1979. A threshold selection method from gray-level histograms. IEEE Trans Sys Man Cyber 9, 62-66.
Pazos-Moura, C.C., Moura, E.G., Bouskela, E., Torres-Filho, I.P., Breitenbach, M.M., 1987. Nailfold capillaroscopy in diabetes mellitus: morphological abnormalities and relationship with microangiopathy. Braz J Med Biol Res 20, 777-780.
Riaño-Rojas, J.C., Prieto-Ortiz, F.A., 2007. Segmentation and Extraction Morphologic Features from Capillary Images. IEEE Conf. Sixth Mexican International ,148-159.
Rizzoni, D., Agabiti-Rosei, E., 2011. Structural abnormalities of small resistance arteries in essential hypertension, Intern Emerg Med, DOI: 10.1007/s11739-011-0548-0.
Salerud, E. G., Tenland, T., Nilsson, G.E., Öberg, P.E., 1983. Rythmical variations in human skin blood flow. Int. J. Microcirc. Clin. Exp, 2, 91-102.
flow velocity monitoring in the microcirculation. Conf. Proc. IEEE Eng. Med. Biol. Soc., pp. 2219–2222.
Seki, J., 1990. Fiber-optic laser-Doppler anemometer microscope developed for the measurement of microvascular red cell velocity. Microvasc. Res. 40(3), 302–316.
Sellke, F.W., 2006. The coronary microcirculation in disease states. In: Rose, B.D., editor. UpToDate. Wellesley: UpToDate; 2006.
Serné, E.H., Gans, R.O.B. ter Maaten, J.C., Tangelder, G.J., Donker, A.J.M., Stehouwer, C.D.A., 2001. Impaired Skin Capillary Recruitment in Essential Hypertension Is Caused by Both Functional and Structural Capillary Rarefaction, Hypertension 38:238-242
Shih, T.C., Zhang, G., Wu, C.C., Hsiao, H.D., Wu, T.H., Lin, K.P., Huang, T.C., 2011. Hemodynamic analysis of capillary in finger nail-fold using computational fluid dynamics and image estimation. Microvasc. Res. 81, 68–72.
Struijker-Boudier, H.A.J., Rosel, A.E., Bruneval, P., Camici, P.G., Christ, F., Henrion, D., Lévy, B.I., Pries, A., Vanoverschelde, J.L., 2007, Evaluation of the microcirculation in hypertension and cardiovascular disease. European Heart Journal 28, 2834-2840.
Ward, A.D., Hamarneh, G., 2010. The groupwise medial axis transform for fuzzy skeletonization and pruning, IEEE Transactions on Pattern Analysis and Machine Intelligence 32(6), 1084-1096. Wollersheim, H., Reyenga, J., Thien, T., 1988. Laser Doppler velocimetry of fingertips during heat
provocation in normals and in patients with Raynaud's phenomenon. Scand. J. Clin. Lab. Invest. 48, 91–95.
Wu, C.C., Zhang, G., Huang, T.C., Lin, K.P., 2009. Red blood cell velocity measurements of complete capillary in finger nail-fold using optical flow estimation. Mircrovasc. Res. 78, 63–68. Ying, X., Xiu, R., 1994. Dynamic and still microcirculatory image analysis for quantitative
microcirculation research. Proc. SPIE 2168, 98–108.
Yu, H.S., Chang, C.H., Ang, G.S., Yang, S.A., Yu, C.L., 1995. Study of dynamic microcirculatory problems in blackfoot disease-emphasizing its differences from arteriosclerosis. J. Biomed. Sci. 2, 183–188.