利用周邊蒸鍍方法提升釔鋁石榴石晶體光纖 之四價摻鉻離子濃度之研究
105
0
0
全文
(2)
(3)
(4)
(5) 致謝 當夕陽灑盡餘暉,告別海平面的那一刻,粼粼的波光此起彼落,猶如遊子揮 手告別這依山傍水的美好學校「中山大學」 。五年了!一個不算短的日子。在這 校園裡的每一角落,有我無盡的回憶!還記得嗎?實驗室的挑燈夜戰,運動場上 的團結合作,再再豐富了我的求學生活。 謝謝指導老師黃升龍教授引領我進入摻鉻光纖的領域。從一無所知到瞭解原 理,老師總是以最大的耐性與包容,循循善誘。南北奔波的您,永遠找不出一絲 倦容。積極樂觀的笑容裡,讓我學到何謂樂於工作與如何善用時間。嚴謹的研究、 宏觀的思維與謙卑的態度是我學習的榜樣。相信在老師的帶領下,實驗團隊必可 在科學研究領域上再次引領風騷。 謝謝林彥勝教授提供微結構材料的分析。您的督促,總是讓我鬆弛的發條再 次旋緊,也讓我勇於面對各個研討會的挑戰。 親如兄弟的晏聖。我永遠不會忘記,家父在榮總加護病房時,您全力配合我 的實驗時間。謝謝您在我的博士生涯起伏過程中,陪我同喜同悲。給予我的各項 幫忙,我點滴在心頭。 感謝碧玲、瑞昀學姊在鍍膜方面的啟發。家堯學長對於後進的教導、提拔, 我深蒙其利。「點子王」建誠學長,謝謝您在我研究方面的教導,為學的靈活與 帶動實驗室氣氛的功力,總是讓實驗室的成員有各種活動,豐富求學生活。立民 學長、平夷大隊長、漢鐘老師,謝謝您們對我的照顧。光瑤的 ASE 模擬與長晶、 建智的微結構分析都幫助此論文得以順利完成。謝謝耿瑜、晏聖、國偉、博駿在 修課時的幫忙。感激偉智、彭昕、立宣、仁親、孟璋、德峰、盟仁等對我材料提 供的準備。 「人生無常、世事難料」 ,在我求學的最後一年,竟然因脊椎病變而開 刀,謝謝文俊、志威、寬東、世昌、思榮、承廷對我的照料。我會記得因為有您 們的參與,2004 年大專光電盃壘球比賽, 「中山」囊括第一。2005、2006、2007 年,中山光電所「所長盃」,「超快實驗室」共得到冠軍、冠軍、亞軍等佳績。 最後謹將此論文獻給我敬愛的父母與家人。謝謝您們一路默默的支持與鼓 勵。謝謝雪鳳將家裡照顧得讓我無後顧之憂,謝謝承恩、宛蓉未增加爸爸的負擔。 這半年來的身體不適,讓父母擔憂,也加重太太、姊姊、妹妹、弟弟的負擔,感 激您們。也祝福各位:身體健康。謝謝您們! 蔡政男 2008 年 7 月 21 日于超快雷射實驗室.
(6) 中文摘要 摻鉻釔鋁石榴石晶體光纖擁有近紅外光的螢光頻譜,波長範圍涵蓋從 1.2 到 1.6 微米,適合於發展可調波長固態雷射與光纖通訊的自發輻射光源及光放大 器。本論文研究摻鈣或鈣/鎂的摻鉻釔鋁石榴石晶體光纖,經由加熱基座成長法 與 1500 ℃的退火處理下,分析鉻的離子價態,在經氧與氮環境退火後,鉻的三 價與四價在八面體與四面體的濃度分佈首次被探討。 八面體的四價鉻離子能遷移至四面體約有 4%,發現的遷移溫度發生於 700 ℃以上,它們的相對穩定能經氧退火與氮退火處理後,在摻鈣/鉻的釔鋁石榴石 晶體分別為 0.25 和 0.3 電子伏特;在摻鎂/鈣/鉻的釔鋁石榴石晶體則為 0.47 和 0.49 電子伏特。在摻鈣/鉻的釔鋁石榴石晶體光纖(Ca/Cr=113.1%)於氧環境下退 火,約有 35%與 2.5%的鈣離子能電荷補償成位於八面體與四面體的四價鉻離子。 而鈣離子的摻雜也產生了氧空缺。經由實驗計算得出,在氧環境與氮環境退火 下,未反應的氧空缺與全部氧空缺的比值分別為 63%與 88%。因此可說明釔鋁石 榴石晶體中未能大幅提升四面體的四價鉻離子的主因為未反應的氧空缺之存在。 而且,在加熱基座成長法抽拉釔鋁石榴石晶體光纖過程中,可以發現在每次 降低直徑時,鈣離子有向外擴散且造成四價鉻離子數量的明顯衰減。因此,在加 熱基座成長法實施前,利用電子鎗將三氧化二鉻(Cr2O3)與氧化物(氧化鈣或 氧化鎂)蒸鍍於晶體周邊來提升四價鉻子濃度。由實驗發現,摻雜鈣離子的效率 較佳於摻雜鎂離子,因為鈣離子較易溶入釔鋁石榴石晶體且有較少的缺陷出現。 氧化鈣蒸鍍於釔鋁石榴石晶體並於 1350 ℃ 的氧環境下退火,四價鉻離子濃度 有效地提升了 110%。且四價鉻離子數達到每立方公分 1.76 × 10¹⁸ 個,四價鉻離子 與全部鉻離子之比值為 5.5。. i.
(7) Abstract Cr4+ doped Yttrium aluminum garnet (YAG) has a strong spontaneous emission that can generate near-infrared emission from 1.2 to 1.6 µm. This broadband emission have aroused great interest in developing tunable wavelength lasers and amplified spontaneous emitter (ASE). In this dissertation, The valence states of Cr ions in Ca or Ca/Mg co-doped Cr:YAG single-crystal fibers are studied. The fibers were grown using the laser-heated pedestal growth (LHPG) method, followed by annealing treatments up to 1500 oC. The concentrations of the Cr3+ and Cr4+ ions in octahedral and tetrahedral sites in oxygen or nitrogen environments were characterized for the first time to our knowledge. Above 700 oC, migration of Cr4+ between octahedral and tetrahedral sites takes place, the ratio of tetrahedral Cr4+ ions to octahedral Cr4+ ions is about 4%; its relative stabilization energy was estimated. For Ca,Cr:YAG annealed in an oxygen or nitrogen environment, it was 0.25 and 0.3 eV, respectively. For Mg,Ca,Cr:YAG annealed in oxygen or nitrogen, it was 0.47 and 0.49 eV, respectively. For the Ca,Cr:YAG crystal fiber (Ca/Cr=113.1%) with oxygen annealing, about 35% and 2.5% of Ca ions took part in charge compensation for Cr4+ in the octahedral and tetrahedral sites, respectively. The density of oxygen vacancies depends on the concentration of Ca ions. The estimated ratios of the unreacted oxygen vacancies to total oxygen vacancies were about 63% and 88% for oxygen and nitrogen annealing, respectively. The main limitation on the concentration of Cr4+ in the tetrahedral site of YAG is the presence of unreacted oxygen vacancies. Furthermore, chromium ions tend to diffuse outward during the LHPG of YAG crystal fiber, in which the average Cr4+ ion concentration decreases significantly after each diameter-reduction step. The Cr4+ ions are replenished using an electron gun to deposit Cr2O3 and divalent-ion oxide (CaO or MgO) on the source rod circumference before growth. It was observed that Ca2+ has better efficiency to diffuse into the source rod more efficiently than Mg2+generating fewer defects and stacking faults. By CaO deposition and post growth annealing at 1350 oC under an oxygen environment, a 110% increase in Cr4+ concentration was obtained. The achieved Cr4+ concentration and the ratio of Cr4+ to total Cr were 1.76 × 1018 cm-3 and 5.5, respectively. ii.
(8) Table of Contents 中文摘要……………………………………………………………………….. i Abstract ……………………………………………………………………….. Table of Contents ……………………………………………………………... List of Tables…………………………………….…………………………….. List of Figures…………………………………………………………….……. ii iii v vi. Chapter 1 Introduction……………………………………………………….. 1 Chapter 2 Cr ion oxidation states in Cr:YAG crystal fiber ………………... 2.1 Structure of YAG…………………………………. …………………….. 2.2 The valence states of Cr in divalent ions co-doped Cr:YAG……………. 2.2.1 Oxidation state of Cr3+ ions in octahedral sites………………………... 2.2.2 Oxidation state of Cr4+ ions in tetrahedral sites……………………….. 2.2.3 Oxidation state of Cr4+ ions in octahedral sites………………………... 2.2.4 Oxidation state of Cr6+ ions in tetrahedral sites………………………... 6 6 9 9 13 21 23. Chapter 3 Fabrication and measurement of Cr:YAG crystal fiber.……… 26 3.1 LHPG system and fabrication processes………………………………… 26 3.1.1 LHPG apparatus……………...…………………………………....... 26 3.1.2 Fabrication processes of the Cr4+ single crystal fiber.…………………… 28 3.2 Laser scanning confocal microscopy and fluorescence mapping………… 34 3.2.1 Measurement of concentrations of octahedral Cr3+ ions…...…………….. 34 3.2.2 Measurement of concentrations of tetrahedral Cr4+ ions………...….…… 37 Chapter 4 Evolution of Cr ion oxidation states in Ca or Ca/Mg co-doped Cr:YAG crystal fibers with annealing treatment………...……... 4.1 Composition and fluorescence measurements…………………………... 4.2 Cr3+ and Cr4+ fluorescence spectra………..……………………………... 4.3 The influence of nitrogen and oxygen annealing treatments…..………... 4.4 Discussion and analysis………………………………………………….. 44 45 47 49 52 4.4.1 Analysis of Cr ion oxidation states and the relative stabilizing energy….. 52 4.4.2 Reduced charge compensation efficiency due to oxygen vacancies…….. 57. Chapter 5 Cr4+ enhancement by perimeter deposition and annealing treatment…………………………………………………………... 58 5.1 Sample preparation……………………….……………………………... 61 5.2 CaO, MgO, and Cr2O3 concentration profiles in the crystal fibers after 64 perimeter deposition……………………………………………………... iii.
(9) 5.3 Effects of annealing treatment, Cr contents and divalent co-dopant on the Cr4+ fluorescence intensity…………………………………..….......... 64 5.4 The defect analysis of crystal fiber after perimeter deposition………….. 70 5.5 Simulated ASE power and required Cr4+:YAG crystal fiber length...…… 74 Chapter 6 Conclusions………………………………………………………... 76 References ………………………………………………..………………….... 79 Biography ………………………………………………..……………………. 88 Publication List……………………………………………..………………… 89. iv.
(10) List of Tables Table 2.1. Structure, atomic position, and physical properties of YAG……….. Table 2.2. Comparison of ionic radii mismatch between dopant and host cations………………………………………………………………. 14. Table 2.3. Characteristics of Cr:YAG and Ca,Cr:YAG crystal fiber…………... 15. Table 2.4. Optical properties of Cr4+:YAG…………………………………….. 20. Table 2.5. Absorption and emission band of different Cr oxidation states…….. Table 4.1. The concentrations of divalent dopant (Me), Croct3 + , Cr , Cr ions to the total Cr ions, and the relative stabilizing energy (ECrAl) for Ca,Cr:YAG (sample #1) and Mg,Ca,Cr:YAG (sample #2) single o crystal fibers. The annealing temperature was 1500 C at 1 atm…... 54. Table 4.2. 4+ 4+ The percentages of Crtetr and Croct to the divalent dopants and total Cr ions, and the percentage of non-reaction oxygen vacancies to the total oxygen vacancies………………………………………. 57. Table 5.1. Summary of the dopant concentrations of 70 µm Ca,Cr:YAG crystal fibers. The growth speed was 7.5 mm/min. The Cr2O3 concentration was 0.09 wt.%, which underwent negligible change with perimeter deposition…………………………………………. 61. Table 5.2. Summary of the dopant concentrations of 70 µm Mg,Ca,Cr:YAG crystal fibers. The growth speed was 2 mm/min…………………… 62. Table 5.3. The comparison of lattice mismatch between host ions and charge compensators………………………………………………………. 71. 4+ oct. v. 8. 25. 4+ tetr.
(11) List of Figures Fig. 1.1. PDFA, TDFA, EDFA and HDFA denote praseodymium, thulium, erbium and holmium-doped fiber amplifiers. These amplifiers can produce gains in the O band, S band, C band and U band, respectively. The scripts, -F, -T, and -S, denote fluoride, tellurite, and silica-based fiber amplifiers, respectively. CDFA can fully cover the whole bands………………………………………………. 2. Fig. 1.2. Schematic illustration of the LHPG method using a deposited undoped YAG rod as the source material. First CaO and then Cr2O3 are deposited………………………………………………… 4. Fig. 2.1. Al2O3-Y2O3 binary phase diagram...................................................... Fig. 2.2. Motif of garnet crystal structure……………………………………. 7. Fig. 2.3. (a) The relative energies of the five d orbitals in octahedral (O) and tetrahedral (T) symmetries. (b) The electron density distribution of the five d orbitals………………………………………………….... 10. Fig. 2.4. Configuration coordinate diagram of the ground state 4A2 and the excited state 4T2 of Cr3+-doped solids in the intermediate interaction field…………………………………………………….. 11. Fig. 2.5. Energy-level diagram as a function of a ligand field strength in units of Racah parameter B for the octahedrally coordinated d3 system (such as Cr3+)……………………………………………….. 12. Fig. 2.6. The fluorescence spectrum of Cr3+ in YAG……………………….... Fig. 2.7. Various dopant concentrations can present different color in the Ca,Cr:YAG crystal fiber…………………………………………… 16. Fig. 2.8. Tanabe–Sugano diagram for tetrahedrally coordinated Cr4+:YAG. The vertical line indicates the appropriate crystal-field strength of Dq/B = 1.78 for Cr:YAG…………………………………………… 17. Fig. 2.9. Electronic energy levels of Cr4+ ion in Td symmetry, showing the splitting introduced by a D2d distortion and spin-orbital coupling…. 17. Fig. 2.10. Room temperature absorption spectrum of Cr4+:YAG……………... 19. Fig. 2.11. Energy level diagram of Cr4+:YAG crystal…………………………. 7. 13. 19. 4+. Fig. 2.12. Room temperature emission spectrum of Cr :YAG……………….. 20. Fig. 2.13. Percentage of Cr4+ to total Cr as a function of Ca/Cr………………. 21. Fig. 2.14. (a) Absorption spectra of the Mg,Cr:YAG crystal registered in as-grown sample (1), after reducing annealing in H2 flow at 1200 o C during 10 h (2) and after annealing in air at 1400 oC during 2 h (3) samples (curves between 1 and 2 represent change of absorption spectrum of the Mg,Cr:YAG crystal during isothermal vi.
(12) reducing in H2 flow at 875 oC); (b) Additional absorption of the as-grown crystal relative to reduced one: experimental data (4) and their approximation (5) by set of Gaussian lines (elementary lines are represented by dashed lines)……………………………………. 22 Fig. 2.15. Dependence of normalized absorption of separate bands during isothermal reducing annealing of the as-grown Mg,Cr:YAG crystal in H2 flow at 875 oC………………………………………………... 23. Fig. 2.16. Absorption spectra of Ca,Cr:YAG. (a) Ca/Cr is 0.29, Cr concentration is 1.42×1019 cm-3; (b) Ca/Cr is 1.1, Cr concentration is 0.63×1019 cm-3; (c) Ca/Cr is 13, Cr concentration is <0.1×1019 cm-3…………………………………………………………………. 24. Fig. 3.1. The LHPG system…………………………………………………... 27. Fig. 3.2. Growth chamber…………………………………………………….. 27. Fig. 3.3. Illustration of single crystal growth by the LHPG method…………. 28. Fig. 3.4. (a) Photograph of line scanning marks on the cross section of crystal fiber. (b) The distribution of Y2O3 and Al2O3 in the YAG crystal fiber…………………………………………………………. 29. Fig. 3.5. Doping profiles of (a) Cr2O3 and (b) CaO with multiple regrowths... Fig. 3.6. Side view of Cr:YAG fibers under reflective light showing micrometer-sized particles formed at the surface of the fiber grown at (a) 2mm/min but not at (b) 3.75 mm/min………………………... 32. Fig. 3.7. SEM side view (scanning electron image, SEI) and EDX mapping of Cr:YAG fiber grown at 2 mm/min showing wide distribution of micrometer-sized Cr-rich particles on the surface………………….. 32. Fig. 3.8. (a) SEM (SEI) image of the section of the Cr:YAG fiber grown at 2 mm/min showing micrometer-sized crystallites deposition on the side surface, (b) EDX analysis at the crystallite indicated by a circled cross………………………………………………………… 33. Fig. 3.9. Measurement of Cr3+ by Laser scanning confocal microscopy setup. 31. 34. 3+. Fig. 3.10. (a) The Cr fluorescence spectrum and (b) the transmittance spectrum of dichroic beam splitter…………………………………. 35. Fig. 3.11. Cr3+ fluorescence mapping of crystal fiber with 0.92 and 0.3 mm in diameter…………………………………………………………….. 36. Fig. 3.12. Comparison between LSCM and EPMA measurements for (a) 0.92 mm and (b) 0.3 mm crystal fibers………………………………….. 36. Fig. 3.13. Cr3+ concentration across fiber with different diameter measured by LSCM………………………………………………………………. 37. Fig. 3.14. Setup of Cr4+ by laser scanning confocal microscopy…………….... Fig. 3.15. (a) The Cr. 4+. fluorescence spectrum and (b) the transmittance vii. 38.
(13) spectrum of dichroic beam splitter………………………………….. 38. Fig. 3.16. Cr4+ fluorescence mappings of crystal fibers with 0.92 and 0.3 mm in diameter………………………………………………………….. 39. Fig. 3.17. The absorption spectrum of Cr4+:YAG with α of 4.5 cm-1 at 1064 nm…………………………………………………………………... 40. Fig. 3.18. The distribution of Cr4+ concentration with different diameter in Cr4+:YAG c1rystal fiber…………………………………………….. 40. Fig. 3.19. Relation between the Cr4+, CaO, and Cr2O3 concentrations in (a) 0.92 mm and (b) 0.66 diameter crystal fiber. Cr4+ concentration is calibrated from fluorescence measurement………………………… 42. Fig. 3.20. The dependence between normalized Cr4+ and Ca2+ concentrations.. 43. Fig. 4.1. There are several Cr oxide states in divalent ions co-doped Cr:YAG……………………………………………………………... 45. Fig. 4.2. Scanned across the cross section of Cr,Ca:YAG by EPMA method... 46. Fig. 4.3. EPMA measured dopant profiles of a 70-µm Ca,Cr:YAG fiber……. 46. Fig. 4.4. 4+ from the The reflected fluorescences of (a) Croct3 + and (b) Crtetr Ca,Cr:YAG, Mg,Ca,Cr:YAG in as-grown samples, and o Mg,Ca,Cr:YAG with oxygen annealing treatment at 1350 C……... 48. Fig. 4.5. 4+ (a) Crtetr and (b) Croct3 + fluorescence intensities of the Ca,Cr:YAG single crystal fibers under nitrogen and oxygen annealing environments……………………………………………………….. 50. Fig. 4.6. 4+ (a) Crtetr and (b) Croct3 + fluorescence intensities of the Mg,Ca,Cr:YAG single crystal fibers under nitrogen and oxygen annealing environments……………………………………………. 51. Fig. 4.7. The relative stabilizing energies of (a) Ca,Cr:YAG, and (b) Mg,Ca,Cr:YAG single crystal fibers under oxygen and nitrogen annealing…………………………………………………………… 56. Fig. 5.1. The photo of the electron gun coater use for this work…………….. Fig. 5.2. Schematic diagrams of (a) perimeter deposition by electron gun coater, and (b) the LHPG growth…………………………………... 59. Fig. 5.3. Environment furnace………………………………………………... 60. Fig. 5.4. Annealing sequences………………………………………………... 60. Fig. 5.5. Correlation between perimeter deposition thickness and dopant concentration. Samples A1-A5 and B1-B5 undergo perimeter depositions with CaO and MgO, respectively……………………… 62. Fig. 5.6. (a) Large cracks on the surface of Mg co-doped Ca,Cr:YAG crystal fiber. (b) Enlarged view of the center area of (a)…………………... 63. Fig. 5.7. Distributions of perimeter deposition content and Cr4+ fluorescence intensity with and without oxygen annealing in the Ca,Cr:YAG for viii. 59.
(14) samples (a) A1and (b) A5…………………………………………... 65. Fig. 5.8. The dependence between normalized Cr4+ and Ca2+ concentration of samples A1-A5 with and without oxygen annealing treatment…. 66. Fig. 5.9. Distributions of perimeter deposition content and Cr4+ fluorescence intensity with and without oxygen annealing in the Mg,Ca,Cr:YAG for sample B5………………………………………………………. 67. Fig. 5.10. Relation between (a) Ca2+ and (b) Mg2+ concentrations and Cr4+ content……………………………………………………………… 69. Fig. 5.11. The SEM image of the surface of sample A1 after HF etching. Red circles represent the locations of etching pits………………………. 70. Fig. 5.12. SEM images of etch pits in (a) Ca,Cr:YAG for sample A5, and in Mg,Ca,Cr:YAG for samples (b) B2 and (c) B5. In (a) and (b), the dark and white dots represent deep and shallow pits, respectively… 72. Fig. 5.13. (a) HRTEM image of a Ca,Cr:YAG crystal fiber along the [011] zone axis. The sharp contrast areas indicate misfit dislocations. (b) Fourier filtered image of (a). White circles represent the locations of misfit dislocations……………………………………………….. 73. Fig. 5.14. (a) ASE power as a function of pump power and (b) simulated ASE power and required Cr4+:YAG crystal fiber length as function of Cr4+ concentration………………………………………………….. 75. ix.
(15) Chapter 1 Introduction Optical fibers with very broad-band gain have aroused great interest in developing tunable miniature lasers and amplifiers, which can be used in telecommunications with wider gain bandwidth than commercial erbium-doped fiber amplifiers and others reported rare earth (RE)-doped fiber devices. During the past decade, the fast increasing demand of communication capacity results in the emergence of wavelength division multiplexing (WDM) technology. In consequence, it arises the stringent requirement of spectral characteristics of all the optical components used in the optical fiber networking systems. Cr4+ doped Yttrium aluminum garnet (YAG) has a strong spontaneous emission that can generate near-infrared emission from 1.2 to 1.6 µm. This broadband emission just covers the low-loss window of low-water-peak optical fiber through out optical communication bands. Such broadband characteristics offer unprecedented one-for-all convenience, flexibility, and simplicity to multi-band component manufacturing as ultra broadband laser source, amplifier, etc [1.1-1.7]. For example, the wavelength of room temperature tunable lasers cover the visible and mid-IR spectra range, including Ti:sapphire (790-1100 nm), Cr:alexandrite (600-810 nm), Cr:LiSAF or Cr:LiCAF (750-950 nm), Cr4+:Mg2SiO4 (forsterite) (1100-1300 nm), Cr4+:YAG (1200-1600 nm). Various types of Cr4+-doped garnet span the spectral range of 1200-1800 nm [1.8]. For optical fiber amplifier, silica-based erbium-doped fiber amplifier (EDFA) provides gain in the C-band (1530-1565 nm) [1.9-1.10] and L-band (1570-1605 nm) [1.4] even in the S-band (1450-1520 nm) [1.11]. The other types of EDFAs are fluoride- [1.12] and tellurite- [1.13] based EDFAs. Thulium-doped fiber amplifiers can give gain in the S-band. The thulium ions can be doped in fluoride [1.14-1.15], tellurite [1.16] or silica glass [1.17]. Praseodymium-doped fiber amplifiers can be operated in the O-band [1.18]. Among them, the gain bandwidth of Cr4+-doped fiber amplifier (CDFA) can fully cover the whole ranges as shown in Fig. 1.1. Therefore, Cr4+:YAG crystal was selected for study in this dissertation. Pulling bulk crystal into a fiber with a diameter of several dozen µm is useful in optical communications, which is due to its structure similarity to that of silica fiber [1.19]. Moreover, fiber 1.
(16) configuration can confine pump light into a small cross-section area with a high energy density for a long distance.. O. 40. S. C L. U. 1.0 Fluoride PDFA. 20. Tellurite EDFA. Silica EDFA Fluoride HDFA. Fluoride TDFA CDFA. 0.8 0.6 0.4. 10. 0. 0.2. 1200. 1300. 1400. 1500. Wavelength (nm). 1600. Silica fiber loss (dB/km). 30. Gain (dB). E. 0 1700. Fig. 1.1. PDFA, TDFA, EDFA and HDFA denote praseodymium, thulium, erbium and holmium-doped fiber amplifiers. These amplifiers can produce gains in the O band, S band, C band and U band, respectively. The scripts, -F, -T, and -S, denote fluoride, tellurite, and silica-based fiber amplifiers, respectively. CDFA can fully cover the whole bands.. It is well-known that when Cr ions are doped into YAG crystal with a dominant ionic state of +3, Cr3+ can substitute Al3+at the octahedral sites. Selected divalent cations were evaluated for their effectiveness as co-dopant ions in Cr:YAG to enhance the Cr4+ concentration. The most suitable co-dopants are Ca2+ and Mg2+, which divalent ions can serve as efficient charge compensators. Cr4+:YAG rod have been grown by Czochralski method [1.20-1.21], floating-zone growth [1.20], pulsed laser deposition [1.22], and the laser-heated pedestal growth (LHPG) method [1.23]. For Cr4+:YAG crystal fiber, the LHPG 2.
(17) method was adopted in my dissertation. There are many advantages of LHPG method [1.24], including crucible free, high-speed growth, and small core diameter. It is easy to adjust the growth conditions and dopant concentrations for use as an ultra broadband amplified spontaneous emission (ASE). Because of the out-diffusion and evaporation of Cr2O3 during LHPG process, the Cr4+ concentration decreases substantially, which results in reduced signal gain and ASE power. For this reason, improving the Cr4+ charge compensation efficiency is first challenge for ASE power. Sugimoto, et al. have been shown that as much as 6% of Cr ions can exist in a tetravalent coordination state with bulk crystal by Czochralski method [1.25]. But after diameter-reduction in 70 µm during LHPG method, the ratio of Cr4+ to Cr is decreased to less than 1% [1.26]. Therefore, enhancement of Cr4+ concentration is very important for ASE. Ishibashi, et al. adopted a new experimental method to adjust the dopant concentration in the YAG crystal. They investigated that using electron beam gum to perimeter deposit Cr2O3 and CaO on 700-µm-diameter YAG crystal fiber as shown in Fig. 3.21 [1.23]. The experimental result showed that there is a small correlation between the deposited thickness and the ions concentration for calcium. The correlation is unclear for chromium. They suppose that most Cr ions are vaporized from the surface of the source rod by condition heat and then incorporated into the molten zone of the crystal. Under such conditions, small change in gas flow or focus laser power would make large differences in the resulting dopant concentrations.. 3.
(18) Fig. 1.2. Schematic illustration of the LHPG method using a deposited undoped YAG rod as the source material. First CaO and then Cr2O3 are deposited [1.23].. In this dissertation, we use electron gun to deposit CaO/Cr2O3 or MgO/Cr2O3 on the source rod circumference of the Ca,Cr:Y3Al5O12 single crystal fiber to replenish the divalent ions. They were then grown to 70 µm in diameter, and followed by post-growth thermal annealing during oxygen atmosphere for enhancing the Cr4+ concentration. This dissertation contains four main chapters. In chapter 2, the properties of Cr4+:YAG will be introduced. The charge compensation efficiency and the evolution of several Cr oxidation states will also be described. In chapter 3, the fabrication processes and optical characterization of Cr4+:YAG by the LHPG method will be discussed. The laser scanning confocal microscopy (LSCM) will be used to measure 3+ the concentrations and distributions of octahedral Cr3+ ( Croct ) and tetrahedral Cr4+ ions. 4+ ( Crtetr ) in Cr:YAG crystal fibers. In chapter 4, for Ca,Cr:YAG or Mg,Ca,Cr:YAG. crystal fibers, there are several Cr oxidation states in YAG structure, including Cr3+ in 4+ octahedral sites, Cr4+ in octahedral ( Croct ) and tetrahedral sites. After Ca,Cr:YAG or. Mg,Ca,Cr:YAG crystal fibers were grown with oxygen or nitrogen annealing treatment, the Cr4+ ion concentration in tetrahedral site is analyzed. The LSCM was 4.
(19) 3+ 4+ employed for identifying Croct and Crtetr ions. We characterized the concentrations. of Cr oxidation states, analyzed the Cr valence change, and the main reasons why 4+ Crtetr concentrations are usually limited to below 7% of the total Cr ions.. Since the concentration of Cr4+ ions in 66-µm Cr4+:YAG crystal fiber is 10-fold decreased than that in bulk crystal, in chapter 5 the enhancement of Cr4+ concentration was demonstrated by electron gun deposition of divalent-ion oxide (CaO or MgO) on the source rod circumference of the Ca,Cr:YAG crystal fiber followed by re-growth. And the perimeter deposited charge compensators of Ca2+ and Mg2+ ions were compared to see which one is better for increasing the concentrations of Cr4+ ion in oxygen atmosphere environment. Scanning electron microscopy (SEM), and high-resolution transmission electron microscopy (HRTEM) were employed to study the defects in Ca,Cr:YAG or Mg,Ca,Cr:YAG crystal fibers. The qualities of Ca2+ or Mg2+ enhanced Ca,Cr:YAG single crystal fiber were analyzed to find which one causes less propagation loss and is more suitable for developing amplified spontaneous emitter.. 5.
(20) Chapter 2 Cr ion oxidation states in Cr:YAG crystal fiber Yttrium aluminum garnet (YAG) is the most widely used solid-state laser gain medium because of its superior optical, thermal, and mechanical properties. Due to the fact that Cr4+ doped YAG crystal can generate near-infrared emission from 1.2 to 1.6 µm, it can be applied widely in tunable and mode-locked solid-state lasers and as an ultra-broadband amplified spontaneous emitter in optical communications. It is well known that the ASE is corresponding to the concentration of Cr4+ ions; therefore, enhancement of Cr4+ concentration in YAG is an important issue. In this chapter we shall dwell in more details upon the valence states of Cr ions in charge compensator co-doped Cr:YAG crystal fiber during annealing treatment, including Cr3+ in octahedral sites, Cr4+ in octahedral and tetrahedral sites, and Cr6+ in tetrahedral sites.. 2.1 Structure of YAG YAG has the chemical formula of Y3Al5O12, which characterizes itself as a very hard, isotropic crystal and has a good thermal conductivity, which permits laser operation at high average power levels. According to the phase diagram, YAG is formed by melting with Y2O3 and Al2O3 in the ratio 3:5 and solidification under 1970 °C as shown in Fig. 2.1, which shows the binary phase diagram of the system Al2O3-Y2O3. YAG belongs to the garnet family and crystallizes in the cubic space group Ia-3d ( Oh10 Schoenfies notation). The garnet formula is A3B2C3O12, where A, B, and C denote different lattice sites with respect to their oxygen coordination (dodecahedral, octahedral, and tetrahedral, respectively) as shown in Fig. 2.2 [ 2.1-2.2], the A-sites are occupied by rare-earth ions such as Y3+, Gd3+, Nd3+, La3+, or Lu3+, the B-site ions by Al3+, Sc3+, Ga3+, and the C-site by Ga3+, Al3+ ions, constitute a large class of compounds having unique properties. Table 2.1 lists YAG structural information and atomic location parameters [2.3- 2.4].. 6.
(21) 2400. Temperature (℃). 2200. Liquid. 2000 1800. YAG YAM Liquid. Liquid. + Al2O3. +YAG. YAP. Al2O3+YAG. 1600. Al2O3. 20. Liquid+Y2O3. Y2O3+YAM. 60 40 Y2O3 (mol% ). 80. Fig. 2.1. Al2O3-Y2O3 binary phase diagram.. O2B C A. Fig. 2.2. Motif of garnet crystal structure.. 7. Y2O3.
(22) Table 2.1. Structure, atomic position, and physical properties of YAG. Atom Valence Cation Atomic position coordination x y Al Al Y O Lattice parameters Cation-O bond length. Space group Melting point Molecular weight Density Hardness (Mohs scale) Refractive index. +3 +3 +3 -2. 6 4 8 -. 0.0 0.0 0.375 0.0 0.125 0.0 -0.02985 0.05056 a=b=c=12.008 Å α=β=γ=90° Al-O 1.937 Å Al-O 1.761 Å Y-O 2.303 Å Y-O 2.432 Å. Ia-3d (garnet) 1970 oC 593.59 4.55 g/cm3 8.25-8.5 1.81523. 8. z 0.0 0.25 0.25 0.14878.
(23) 2.2 The valence states of Cr in divalent ions co-doped Cr:YAG crystal The Cr valence states of divalent ions co-doped Cr:YAG are subjected to reduction and oxidation annealing treatment. In this chapter, the valence states and the transformation by the basic reactions will be discussed.. 2.2.1 Oxidation state of Cr3+ ions in octahedral sites When Cr is doped into YAG crystal, Cr3+ is the dominant species which is hardly found in tetrahedral coordinated sites and is substituted for Al3+ at the octahedral site [1.6, 2.5]. No other valence states were found, even if the crystal grows under oxygen annealing treatment. The spectroscopic properties of Cr3+-free ions or doped systems have been studied extensively and summarized in numerous publications [2.6-2.7]. Cr3+ and Cr4+ ions belong to the transition-metal ions, whose lasing occurs as a result of transitions between the electronic levels of the 3d electrons. It results in the strong coupling between the vibrational energy states of the host media and electronic energy states of the active ions, giving rise to broad emission spectra. In a doped system, the Cr ion is surrounded by anion lattice points (also called ligands). When the Cr3+ is in octahedral symmetry, the t2g electrons (located in the dxy, dyz, and dzx orbitals) are directed between the point charges of the ligands, while the eg electrons ( d z 2 ; d x 2 − y 2 orbitals). are directed toward the negative lattice point charges [2.8]. Figure 2.3 presents the electron density distribution of the 5 d orbitals and the relative energy levels of t2g and eg orbitals in various symmetries. As a result of the electrostatic repulsive forces, eg orbitals are of higher energy than the t2g orbitals. This fact explains the broadening of octahedrally coordinated Cr3+ emission and its tunability. In tetrahedral symmetry, the t2g orbitals point directly to the negative ligands, and therefore, the three t2g orbitals have higher energy than the two eg orbitals.. 9.
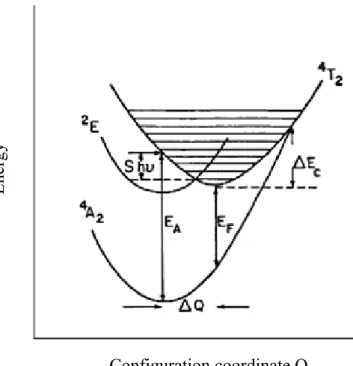
(24) eg. Energy. t2. e. t2g. T. Free ion (a). O. dx2-y2. dz2. dxy. dyZ. dzx. (b) Fig. 2.3. (a) The relative energies of the five d orbitals in octahedral (O) and tetrahedral (T) symmetries. (b) The electron density distribution of the five d orbitals. Figure 2.4 shows the configuration diagram of Cr3+-doped systems in the spin-forbidden transition 2 E→ 4 A 2 . The transition is between t2g orbitals, which are pointed between the ligands in octahedral coordination. Therefore, the excited state 2E is stabilized, and is not coupled with the vibrational modes of the crystalline host. There is almost no change in the equilibrium distance of the ion–ligand both in the ground and excited states, and the. 2. E→ 4 A 2 emission has a long lifetime and. consists of a strong zero phonon transition and weaker vibronic sideband. Their transition shows sharp line. In the spin-allowed transition, 4 T2 → 4 A 2 , the 4T2 state contains components of eg orbitals that point toward the ligands, and form the. 10.
(25) unstable anti-bonding molecular orbitals. The Cr-ligand interaction of the electronic orbitals in the 4T2 excited state causes distortion in the crystalline structure due to electronic repulsion, as well as increase in the Cr-ligand inter-nuclear distance. In other words, a strong electron phonon is coupling and broadening of this transition. Energy. which has a short lifetime with little zero phonon intensity.. Configuration coordinate Q Fig. 2.4. Configuration coordinate diagram of the ground state 4A2 and the excited state 4T2 of Cr3+-doped solids in the intermediate interaction field. The electron-phonon coupling of the 4T2 state is much more sensitive to the crystal field strength than the 2E state. This condition can also be observed from the Tanabe-Sugano correlation diagram presented in Fig. 2.5. [2.9-2.10]. The diagrams are based on the quantum mechanical treatment of the energy levels of a dn system (n is the number of electrons). Those are under two fields: inter-electronic repulsions and medium crystal field strength. In medium crystal field strength, the splitting of each state of d depends on the field strength measured by Dq or ∆ and also on the electronic repulsion parameters, also known as Racah parameters, denoted by B and C. In the Tanabe-Sugano theory, it is assumed that C is proportional to B and that the proportionality constant has a fixed value for each diagram. However, the diagrams 11.
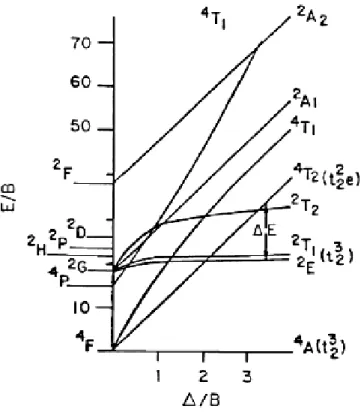
(26) are independent of B since both the energy of each state (E) and the crystal field strength (Dq or ∆) are normalized to B [2.11].. Fig. 2.5. Energy-level diagram as a function of a ligand field strength in units of Racah parameter B for the octahedrally coordinated d3 system (such as Cr3+).. By a proper choice of the solid-state host composition, we can control the crystal field strength and hence the energy levels of the 4T2 state relative to 2E. The energy separation has a decisive effect on the Cr3+ emission. In Fig. 2.5, it is observed that, in a low crystal field, the 4T2 level is below 2E and Cr3+ luminescence occurs from the spin-allowed. 4. T2 → 4 A 2 transition and is characterized by a broad band with a short. lifetime. In a strong crystal field, the 4T2 state will be above 2E, the Cr3+ luminescence arises from the spin-forbidden. 2. E→ 4 A 2 transition and is characterized by sharp zero. phonon R-lines, phonon sideband, and relatively long lifetime [2.12-2.13]. Cr3+ had two absorption bands at 434 and 594 nm which can be assigned to be 4. A 2 → 4 T2 and 4 A 2 → 4 T1 transitions [1.25, 2.14-2.15]. No apparent peak was. observed in other wavelength regions. The Cr3+:YAG fluorescence ranges from 650 to 750nm, which is dominated by a sharp R-line (689 nm from 2E→4A2 transition) of 12.
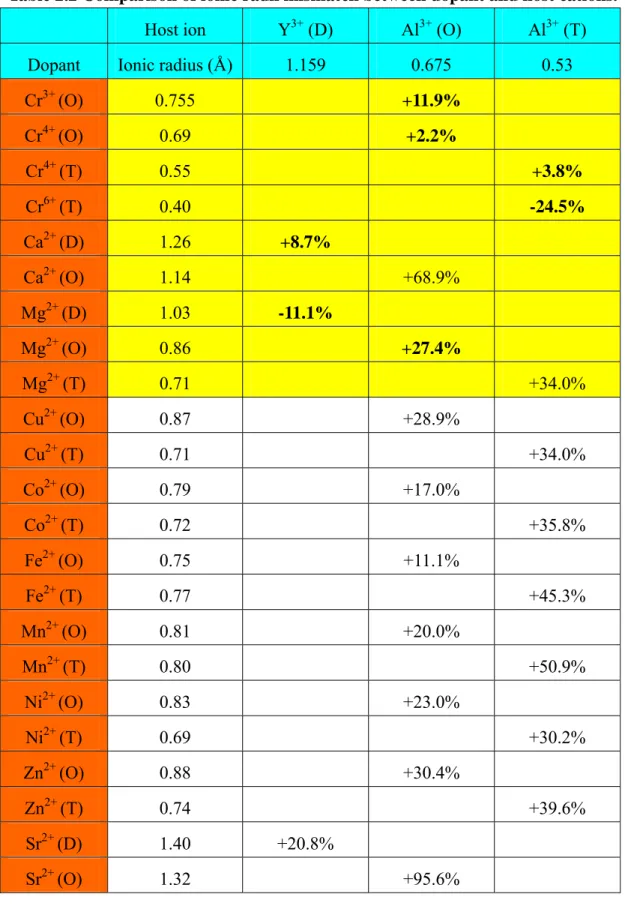
(27) high crystal field Cr3+ sites associated with three phonon sidebands (675, 707, and 726 nm), as shown in Fig. 2-6[2.16].. Fluorescence intensity (a.u.). 1.0. Cr3+ fluorescence spectrum. 0.8 0.6 0.4 0.2 0.0 625. 650. 675. 700. 725. 750. Wavelength (nm). 775. 800. Fig. 2.6. The fluorescence spectrum of Cr3+ in YAG... 2.2.2 Oxidation state of Cr4+ ions in tetrahedral sites Selected divalent cations were evaluated for their effectiveness as co-dopant ions in Cr:YAG to increase the Cr4+ concentration [1.23, 2.17-2.19]. Markgraf, et al. had examined several divalent ions, including Ca2+, Mg2+, Cu2+, Co2+, Fe2+, Mn2+, Zn2+, Ni2+, and Sr2+ [2.18]. Several divalent species were not examined due to safety concerns, such as Be2+, Pb2+, and Cd2+. The most suitable co-dopants are Ca2+ and Mg2+, who can serve as charge compensators, and Cr4+ for NIR emission can be generated. The lack of success in other transition metal dopants (Co, Cu, Fe, Mn, Zn, Sr) were attributed to the large crystal field stabilization energy for Cr3. +. in an. octahedral site. The ionic radii mismatch of Sr2+ is much larger in Y3+ or Al3+, and it is not surprising that it was not incorporated in sufficient quantities to promote Cr4+. Table 2.2 summarizes the ionic radii mismatch between the dopants and host cations [2.20]. In general, the use of Ca2+ ion as co-dopant in YAG is based on size considerations. The ionic radius mismatch of Ca2+ for replacing Y3+ is +8.7%, while the Mg2+ ions mainly substitute for Al3+ at the octahedral sites with a radius mismatch of +27.4%, and occasionally substitute for Y3+ at the dodecahedral sites with a lattice mismatch of -11.1% [2.21-2.22]. 13.
(28) Table 2.2 Comparison of ionic radii mismatch between dopant and host cations.. Host ion. Y3+ (D). Al3+ (O). Al3+ (T). Dopant. Ionic radius (Å). 1.159. 0.675. 0.53. Cr3+ (O). 0.755. +11.9%. Cr4+ (O). 0.69. +2.2%. Cr4+ (T). 0.55. +3.8%. Cr6+ (T). 0.40. -24.5%. Ca2+ (D). 1.26. Ca2+ (O). 1.14. Mg2+ (D). 1.03. Mg2+ (O). 0.86. Mg2+ (T). 0.71. Cu2+ (O). 0.87. Cu2+ (T). 0.71. Co2+ (O). 0.79. Co2+ (T). 0.72. Fe2+ (O). 0.75. Fe2+ (T). 0.77. Mn2+ (O). 0.81. Mn2+ (T). 0.80. Ni2+ (O). 0.83. Ni2+ (T). 0.69. Zn2+ (O). 0.88. Zn2+ (T). 0.74. Sr2+ (D). 1.40. Sr2+ (O). 1.32. +8.7%. +68.9% -11.1% +27.4%. +34.0% +28.9% +34.0% +17.0% +35.8% +11.1% +45.3% +20.0% +50.9% +23.0% +30.2% +30.4% +39.6% +20.8% +95.6%. D, O, and T denote ions in dodecahedral site, octahedral site, and tetrahedral site, respectively.. 14.
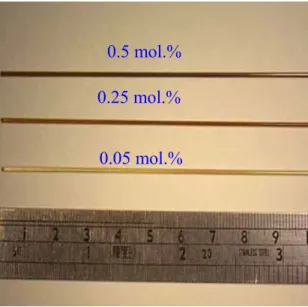
(29) Table 2.3 presents the growth conditions and colors of Cr:YAG and Ca,Cr:YAG single crystal fibers grown by the LHPG method. It can be seen that the Cr:YAG crystals are colorless without Ca2+ doping. When the concentrations of Cr were increased, the Cr:YAG crystals became light green because of the Cr3+ in octahedral sites. In both cases, NIR emission was not detected. The Ca,Cr:YAG crystal became brown, even black with strong NIR detection as Cr and Ca2+ are co-doped in YAG, as shown in Fig. 2.7. So we can conclude that doping with Ca2+ ions into Cr:YAG for charge compensation is necessary to get tetravalent Cr ions [2.17].. Table 2.3 Characteristics of Cr:YAG and Ca,Cr:YAG crystal fiber [2.17].. Cr conc. (mol %). Ca2+ conc. (mol %). Growth atmosphere. Color. NIR emission. 0.05. N2. colorless. not detected. 0.05. Air. colorless. not detected. 0.05. O2. colorless. not detected. 0.2. N2. light green. not detected. 0.2. Air. light green. not detected. 0.2. O2. light green. not detected. 0.05. 0.05. N2. light brown. strong. 0.05. 0.05. Air. light brown. strong. 0.05. 0.05. O2. light brown. strong. 0.2. 0.2. N2. brown. strong. 0.2. 0.2. Air. brown. strong. 0.2. 0.2. O2. brown. strong. 1.0. 1.0. N2. almost black. strong. 15.
(30) 0.5 mol.% 0.25 mol.% 0.05 mol.%. Fig. 2.7. Various dopant concentrations can present different color in the Ca,Cr:YAG crystal fiber. Figure 2.8 shows the Tanabe–Sugano correlation diagram for a d2 system such as a tetrahedral Cr4+ ion, which can generate NIR emission from the. 3. T2 → 3 A 2. transition. The lowest free-ion level Cr4+ ion 3F splits into three components in an ideal Td (tetrahedral) site:. 3. F ≡ 3A2+3T2+3T1, with the energy of the levels. being 3 A 2 < 3 T2 < 3 T1 . In a distorted tetrahedron (D2d symmetry), it results in further orbital splitting: 3T2 splits into 3B2 and 3E, 3T1 splits into 3A2 and 3E, and 3A2 (ground level) becomes 3B1. However, the room temperature absorption spectra of various Cr4+-doped garnets (YAG, LuAG, YGG, GGG, etc.) or mixed scandium based garnets (GSAG, YSGG, GSGG, mixed YSAG) [2.23, 2.24] indicate that there are optical transitions in the UV and visible part of the spectra. They observed several groups of absorption 3. peaks,. namely,. 300–500. nm. 3. B1(3A2)-3T1(3P),. 550–700. nm. B1(3A2)-3T2(3F), and 700–1000 nm 3B1(3A2)-3T1(3F). The magnetic-dipole allowed. transition 3A2-3T2 (or more precisely, into the 3E and 3B2 crystal field components) to have an absorption peak about 1100–1200 nm and is therefore very weak. The energy-level scheme of Cr4+-doped garnets is presented in Fig. 2.9.. 16.
(31) Fig. 2.8. Tanabe–Sugano diagram for tetrahedrally coordinated Cr4+:YAG. The vertical line indicates the appropriate crystal-field strength of Dq/B = 1.78 for Cr:YAG... Fig. 2.9. Electronic energy levels of Cr4+ ion in Td symmetry, showing the splitting introduced by a D2d distortion and spin-orbital coupling. 17.
(32) As noted previously, the relative positions of the energy levels of transition metal ions depend on the crystal field strength. The metastable level can be either 1E or 3T2, depending on the strength of the crystal field in the tetrahedral site. The high or low crystal field is the field above or below the cross-over point of the two states, respectively. In a low crystal field, the transition is expected to be between 3. T2 → 3 A 2 states, with a short fluorescence lifetime (spin-allowed transition) and. broadband emission due to strong electron–phonon coupling. In a high crystal field, where the electron–phonon coupling is weak and the transition is spin forbidden, we expect a long lifetime and narrow band emission due to the 1 E→ 3 A 2 transition. The crystal field strength parameter Dq/B was calculated for several crystals. The value of Dq/B in YAG and Mg2SiO4 are 1.78 [2.23] and 1.99 [2.25-2.26], respectively. These values correspond to the relatively strong crystal fields where we have intermediate states that are very close to the cross-over points between 3T2 and 1E levels in the Tanabe–Sugano diagram, or even mixed states of 3T2 and 1E states. However, the strong orbital splitting of 3T2 into 3E and 3B2 brings the 3B2 level below the 1E level, and this makes the Cr4+ behave as a low crystal field system. Cr4+ doped YAG has a strong coupling between the vibrational energy states of the host crystal and the electronic energy states of the active ion, resulting in broad absorption and emission linewidths. The room temperature absorption spectrum of Cr4+:YAG crystal in Fig. 2.10 shows three broad bands at 1 µm, 0.64 µm and 0.48 µm [2.27]. The 0.48-µm absorption band may be due to Cr4+ in octahedral sites, a charge transfer or a color center. The visible absorption band between 0.6 and 0.7 µm is assigned to the 3B1 (3A2) →3E (3T1) transition, and the strong NIR absorption band center at around 1 µm is assigned to the 3B1 (3A2) → 3A2 (3T1) transitions. The energy level diagram of Cr4+:YAG crystal is schematically shown in Fig. 2.11 [2.28]. The Cr4+ fluorescence emission in the 1.38-µm region occurs as a result of the transition from the 3B2 (3T2) → 3B1 (3A2) transition in tetrahedral symmetry. The emission of Cr4+ is broad due to strong electron–phonon coupling which results from the t2g nature of the 3T2 excited levels. Figure 2.12 shows the NIR fluorescence spectrum of Cr4+:YAG [2.27]. The fluorescence peaks at 1.38 µm cover a wide range from 1.2 to 1.6 µm. Some of the important optical properties are listed in Table 2.4. 18.
(33) Absorption coefficient (cm-1). 10 8 6 4 2 0. 300. 900 600 Wavelength (nm). 1200. Fig. 2.10. Room temperature absorption spectrum of Cr4+:YAG.. Td. D2d 3. 3. T1. E. Pump ~0.6 µm 3. 3. 3. T2. A2. 3. 3. Pump ~1µm. A2. E. B2. Emission ~1.38 µm 3 B1. Fig. 2.11. Energy level diagram of Cr4+:YAG crystal.. 19.
(34) Intensity (a.u.). 1000. 1200. 1400 1600 Wavelength (nm). 1800. Fig. 2.12. Room temperature emission spectrum of Cr4+:YAG.. Table 2.4 Optical properties of Cr4+:YAG. Tunable range. 1.34~1.58 µm. Absorption cross section. 1.12×10⁻¹⁸ cm2. Emission cross section. 4.6 ×10⁻²⁰ cm2. ESA cross section. 0.96 ×10⁻²⁰ cm2. Absorption coefficient. 0.5~4.5 cm-1 (at 1064 nm). Absorption bandwidth. 0.9~1.1 µm. Spontaneous fluorescence lifetime. 4.5 µs (at 300K). Figure 2.13 shows that single crystals of Ca,Cr:YAG with different Cr and Ca concentration were grown by the Czochralski method and floating-zone growth. The analysis of both as-grown and oxygen-annealed crystal in relation to concentration ratio of Ca and Cr (Ca/Cr) showed that Cr4+ concentration ratio to total Cr concentration increased up to about Ca/Cr = 6, and then it became constant. Compared to the as-grown sample, the Cr4+ percentage increased by 30% - 50% with oxygen annealing treatment [1.25].. 20.
(35) Cr4+ / total Cr (%). 7. 6. 6. 5. 5. 4. 4. 3. 3. 2. 2. 1. 1. 0. 0 40. 0. After annealing (%) Cr4+ / total Cr. 7. 20 30 Ca / Cr 4+ Fig. 2.13. Percentage of Cr to total Cr as a function of Ca/Cr [1.25]. 10. 2.2.3 Oxidation state of Cr4+ ions in octahedral sites The influence of reducing and oxidizing annealings on optical absorption spectra of the YAG single crystal co-doped with Mg and Cr was investigated using step-by-step isothermal and isochronous thermal treatment in H2 or air flow. The experimental results indicate that there are the presence of Cr3+ ions in octahedral sites 3+ 4+ 4+ ( Croct ), Cr4+ ions both in tetrahedral ( Crtetr ) and in octahedral ( Croct ) sites [2.29].. Figure 2.14a shows that the absorption spectrum of the as-grown Mg,Cr:YAG crystal is presented by the curve 1 as well as its spectra after reducing (curve 2) and oxidizing (curve 3) annealing [2.30]. The characteristic changes of absorption spectra of Mg,Cr:YAG after reducing and oxidizing are well coinciding. Curve 2 shows the completely reduced sample which contains two characteristic absorption bands at 23040 cm-1 (434 nm) and 16450 cm-1 (607 nm) connected with the octahedral Cr3+ transitions; The absorption bands at 16200 cm-1 (617 nm) and 15300 cm-1 (666 nm) originate from transitions of tetrahedral Cr4+ ions [2.24, 2.31] as well as absorption in the NIR region with maximum at 9400 cm-1 (1064 nm); The octahedral Cr4+ ions contain two absorption bands with maxima at 24100 cm-1 (415 nm) and 20100 cm-1 (498 nm). The changes in the spectra were analyzed using decomposition on elementary absorption bands of Gaussian shape as shown in Fig. 2.14b.. 21.
(36) Absorption (cm-1) Additional absorption (cm-1). Wavenumber (cm-1) Fig. 2.14. (a) Absorption spectra of the Mg,Cr:YAG crystal registered in as-grown sample (1), after reducing annealing in H2 flow at 1200 oC during 10 h (2) and after annealing in air at 1400 oC during 2 h (3) samples (curves between 1 and 2 represent change of absorption spectrum of the Mg,Cr:YAG crystal during isothermal reducing in H2 flow at 875 oC); (b) Additional absorption of the as-grown crystal relative to reduced one: experimental data (4) and their approximation (5) by set of Gaussian lines (elementary lines are represented by dashed lines) [2.30].. It was found that irradiation of crystals prepared under reducing conditions forms color centers with Cr4+ ions in octahedral positions, having absorption in the UV and visible wavelength range. Oxidizing anneals form centers with Cr4+ at tetrahedral sites, which cause strong absorption in 1-1.2 µm wavelength range. Dependencies of the absorption spectrum components’ intensity during isothermal reducing annealing at 875 °C is plotted in Fig. 2.15 as normalized to the initial absorption of each Cr4+ connected band of as-grown Mg,Cr:YAG crystal. It is clearly seen that two types of the bands' behavior can be distinguished: the absorption bands conforming to the octahedral Cr4+ ions start to decrease immediately from the beginning of annealing 22.
(37) 4+ absorption and is slowly continuing for at least four hours. In contrast, the Crtetr. bands begin much later (in second half of hour) and practically stop after 2 hours of. Normalized absorption (a.u.). annealing.. Time (min) Fig. 2.15. Dependence of normalized absorption of separate bands during isothermal reducing annealing of the as-grown Mg,Cr:YAG crystal in H2 flow at 875 oC [2.30]. Therefore, it was analyzed that the electronic recharging and charging process 4+ 3+ taking place in the octahedral sites of garnet lattice have lower Croct ↔ Croct 4+ 4+ activation energy from the chromium migration process Crtetr ↔ Croct happening at 4+ 4+ higher temperatures or longer exposure. The ratio Crtetr Croct is about 4% at 1700 k. and the relative stabilizing energy ECrAl was found to be 0.11 eV [2.32].. 2.2.4 Oxidation state of Cr6+ ions in tetrahedral sites Sugimoto, et al. have shown that the as-grown absorption spectra of Ca and Cr doubly-doped crystals had three absorption bands in the visible and near infrared region which is produced by octahedral Cr3+ and tetrahedral Cr4+ ion as shown in Fig. 2.15. The intensity of 1 µm absorption peak of Cr4+ increased after annealing in the sample with Ca/Cr=0.29 and 1.1 as shown in Figs. 2.15a, b. But the Ca concentration to the Cr concentration ratio is increased to 13, the 1 µm absorption peak decreased after annealing, the sample color changed from brown to yellowish-brown. The 23.
(38) results indicate that when Ca,Cr:YAG crystals are annealing in oxygen atmosphere; it is possible that not only octahedral Cr3+ switches to tetrahedral Cr4+ but also tetrahedral Cr4+ switches to tetrahedral Cr6+ [2.18].. Fig. 2.15. Absorption spectra of Ca,Cr:YAG. (a) Ca/Cr is 0.29, Cr concentration is 1.42×1019 cm-3; (b) Ca/Cr is 1.1, Cr concentration is 0.63×1019 cm-3; (c) Ca/Cr is 13, Cr concentration is <0.1×1019 cm-3 [2.18].. 24.
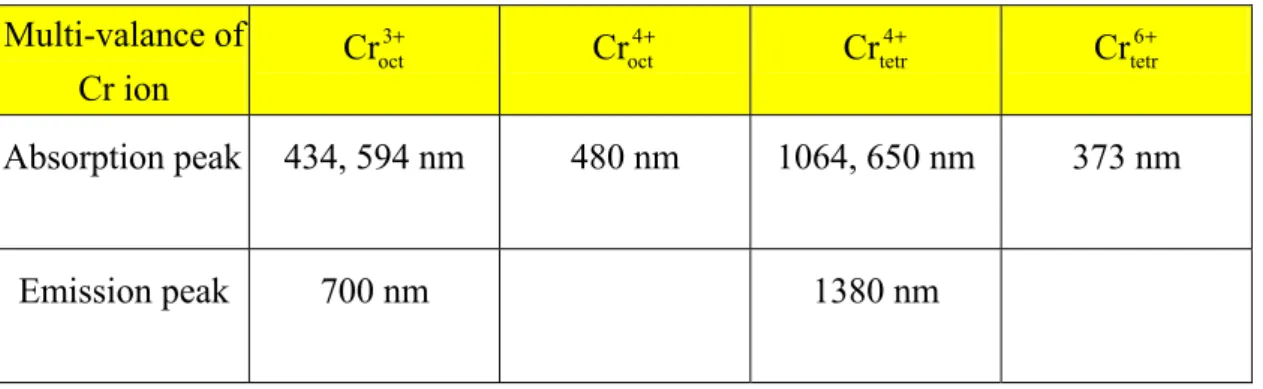
(39) Among them, the absorption and emission band of different Cr oxidation states were summarized in Table 2.5. The concentrations of tetrahedral Cr4+ and Cr6+ ions are strongly dependent on divalent co-doped ions (Ca or Mg).. Table 2.5 Absorption and emission band of different Cr oxidation states.. Multi-valance of Cr ion. 3+ Croct. 4+ Croct. 4+ Crtetr. 6+ Crtetr. Absorption peak. 434, 594 nm. 480 nm. 1064, 650 nm. 373 nm. Emission peak. 700 nm. 1380 nm. 25.
(40) Chapter 3 Fabrication and measurement of Cr:YAG crystal fiber Cr4+:YAG can be grown by several methods [1.20-1.23]. The LHPG method is speedy and economical; therefore, it is widely used to examine the growth of new methods. For the production of crystal fiber with less than 100 µm in diameter, it can be achieved by the LHPG method [1.23]. In this Chapter, the LHPG system and fabrication processes of crystal fibers will be described. The concentrations and fluorescence Cr3+ and Cr4+ will also be characterized and discussed.. 3.1 LHPG system and fabrication processes In this section, we will describe the LHPG apparatus and explain the fabrication process of the Cr4+:YAG crystal fibers. The dopant profiles in the YAG crystal fiber will be discussed.. 3.1.1 LHPG apparatus A schematic of our LHPG system is shown in Fig. 3.1. The heat source is a 100-W polarized CO2 laser (Spectron Laser System) with wavelength of 10.6 µm. The laser power can be adjusted by a zinc selenide (ZnSe) Polarizer-Analyzer-Attenuator (ΙΙ-VI Inc.). The CO2 laser system has a collinear He-Ne reference beam with a wavelength of 632.8 nm to indicate where the CO2 laser beam (invisible) will travel. After passing through a ZnSe beam-expansion telescope, the CO2 beam shines into the growth chamber. The telescope expands the CO2 beam size to three centimeters in diameter. The whole system is controlled by a LabVIEW program. Within the growth chamber, the incident Gaussian shape of CO2 laser is converted to a uniform donut-shape beam to heat the crystal as shown in Fig. 3.2. The pulling and feeding mechanisms are outside the chamber, and consist of computer-controlled linear stage driven by stepping motor with gearbox to reduce vibration. The maximum pulling length is above 50 cm with the pulling speeds from 0.375 to 37.5 mm/min.. 26.
(41) Mirror 1 100-W CO2 laser. Power detector. Growth chamber Mirror 2. Power Beam splitter attenuator. ZnSe telescope. PC. Fig. 3.1.The LHPG system.. Paraboloid mirror. CO2 laser beam. Planar mirror. Reflaxicone. inner cone outer cone. Fig. 3.2. Growth chamber.. 27.
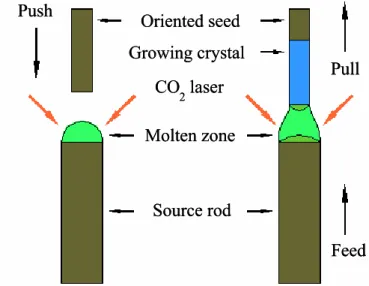
(42) 3.1.2 Fabrication processes of the Cr4+ single crystal fiber Source material can be prepared in the forms of either round or square cross-section rods from a single crystal, polycrystalline, and sintered or pressured powder material. The crystal growth process is shown in Fig. 3.3. A seed rod is used to determine the crystallographic orientation of the fiber to be grown. The growth starts from using a tightly focused CO2 laser to heat and melt the top end of the source rod, and then the seed rod is dipped into the molten zone. Finally, a single-crystal fiber is grown by pulling the seed rod and feeding the source rod upward simultaneously at a constant growth ratio. By repeating this growth processes, the crystal fibers can be achieved with diameters from millimeter to about 20 µm. Push. Oriented seed Growing crystal CO2 laser. Pull. Molten zone. Photograph of molten zone. Source rod Feed. Fig. 3.3. Illustration of single crystal growth by the LHPG method. The whole system is controlled by a LabVIEW (7.0, National Instruments) program, including motion control and laser power feedback. Since the power fluctuation of CO2 laser will affect the diameter variation of the crystal fiber, the laser power feedback program was utilized to decrease the power fluctuation. By detecting the laser power through the thermal pile photodetector (PD) (818T-30, NewPort) and controlling the angle of Polarizer-Analyzer-Attenuator, the fluctuation of CO2 laser drops from ±3% down to ±0.1% [3.1]. The fiber-to-source rod diameter ratio can be controlled by setting the pull/feed speed ratio. At steady state, the volume of molten zone is constant due to conservation of mass. The volume of crystal added to the fiber must equal the volume of the source 28.
(43) rod melted. Therefore, the ratio of fiber diameter to source rod diameter is given by. Df = Ds. vs vf. (3.1). where Df and Ds are diameters of the fiber and source rod, respectively. Vf and Vs are speeds of pulling and feeding, respectively. In the left part of Fig. 3.3, a stable molten zone in YAG was formed by the laser power; the solid-liquid growth interface is evident as the slightly darker bowl-shaped region at the top of the molten zone. The curvature of this isothermal surface reflects the radial temperature gradients. Typically, the axial temperature gradients are very steep at the growth interface (~103 °C/cm) and this permits faster growth rates (~ a few mm/min) compared with bulk crystal growth process (~ 0.5 mm/hour). Figure 3.4 (a) shows a typical line scanning with marks on the cross section of crystal fiber by electron beam. The composition of perfect YAG crystal comprises three Y2O3 and five Al2O3 in mole percentage, which are equivalent to 57.06 and 42.94 in weight percentage (wt.%), respectively. In Fig. 3.4 (b), the distributions of Y2O3 and Al2O3 show the average concentrations of 57.05 wt.% and 42.71 wt.% in YAG crystal fiber. It shows that YAG is a congruent material that maintains its composition right up to the melting point; the tiny variation is attributed to the doping ions of Cr2O3 and CaO in YAG crystal fiber.. Concentration (wt.%). 100. Y2O3 (57.05 wt.%). 80. Al2O3 (42.71 wt.%). 60. 40. 20. 0. 0. 10. 20. 30. 40. 50. 60. 70. 80. 90. 100. Percent diameter (%). (a). (b). Fig. 3.4. (a) Photograph of line scanning marks on the cross section of crystal fiber. (b) The distribution of Y2O3 and Al2O3 in the YAG crystal fiber.. 29.
(44) In the molten zone region, the temperature is above 1900 oC, which strongly influence the distribution of doping ions concentration and evolution of Cr ion oxidation states. Cr4+ can be generated with doped Cr2O3/CaO or Cr2O3/MgO in YAG. Therefore, it is necessary to monitor that the doping concentration variation after each diameter-reduction step, which will influence the device performance. Figure 3.5 shows the doping profiles after multiple regrowths. Starting from a 2-mm-diameter raw material (α = 4.5 cm-1), multiple regrowths at 3 mm/min were performed. We can see that the doping concentrations of Cr2O3 and CaO in raw material are uniform. After diameter-reduction step, the doping concentrations of Cr2O3 show gradients for diameters of 0.92, 0.53, and 0.32 mm. The doping concentration of chromium ions at the fiber center is lower than that of at the edge. Contrary to the doping concentration of chromium ions, calcium ion concentrations become higher near the center portion. This phenomenon is attributed to the signs of the segregation coefficients. Keep on reducing fiber diameter, the doping profiles became uniform again. The experimental results show that once the fiber diameter is reduced, the average Cr2O3 concentration will be decreased quickly. But the average CaO concentration suffers only a slight decrease in YAG, typically less than 10%. Figure 3.6 (a) shows that the Cr:YAG fiber grown at a speed of 2 mm/min is brownish under naked eyes. It is about 2 mm in diameter. Its side view under reflective light, however, showed light scattering due to micrometer-sized particles, which were deposited on the side surface. The fiber grown at a higher speed of 3.75 mm/min is yellow. It is about 1 mm in diameter. Its side view does not show light scattering as shown in Fig. 3.6 (b). The experimental results indicate that the lower growth speed will lead to lower chromium concentration, since the chromium have longer diffusion time from the molten zone center to the circumference and then evaporating to the air. Figure 3.7 shows that the hillocks on the circumference of YAG are indeed Cr-rich with Al and Y counts from the YAG substrate as evidenced by SEM and point-count energy dispersive X-ray (EDX) spectrum in Fig. 3.8 [3.2].. 30.
(45) Cr2O3 concentration (wt.%). 0.25 0.20. 2 mm 0.92 mm 0.53 mm 0.32 mm 0.12 mm. 0.15 0.10 0.05 0.00. 0. 10 20 30 40 50 60 70 80 90 100 Percent diameter (%) (a). CaO concentration (wt.%). 0.06 2 mm 0.92 mm 0.53 mm 0.32 mm 0.12 mm. 0.05 0.04 0.03 0.02 0.01 0.00. 0. 10 20 30 40 50 60 70 80 90 100 Percent diameter (%) (b). Fig. 3.5. Doping profiles of (a) Cr2O3 and (b) CaO with multiple regrowths.. 31.
(46) (a). (b) Fig. 3.6. Side view of Cr:YAG fibers under reflective light showing micrometer-sized particles formed at the surface of the fiber grown at (a) 2mm/min but not at (b) 3.75 mm/min [3.2].. Fig. 3.7. SEM side view (scanning electron image, SEI) and EDX mapping of Cr:YAG fiber grown at 2 mm/min showing wide distribution of micrometer-sized Cr-rich particles on the surface [3.2]. 32.
(47) Fig. 3.8. (a) SEM (SEI) image of the section of the Cr:YAG fiber grown at 2 mm/min showing micrometer-sized crystallites deposition on the side surface, (b) EDX analysis at the crystallite indicated by a circled cross [3.2].. 33.
(48) 3.2 Laser scanning confocal microscopy and fluorescence mapping EPMA can be used to measure the dopant concentrations (Cr, Ca, Mg), but it cannot distinguish the Cr3+ and Cr4+ ions in the YAG. We utilized the different spectral characteristics of 3+ and 4+ oxidation states of Cr ions by employing a laser scanning confocal mapping (LSCM) to distinguish the Cr3+ and Cr4+ ions. The Cr3+ and Cr4+ fluorescence intensity profiles depend on the concentration distribution of the Cr3+ and Cr4+ ions in the YAG fiber cross section. The relation between fluorescence intensity and ion concentration will be discussed.. 3.2.1 Measurement of concentrations of octahedral Cr3+ ions Figure 3.9 shows the LSCM setup for measuring the Cr3+ fluorescence. A frequency doubled Nd:YVO4 laser with a green light (532 nm) was used to excite the Cr3+ fluorescence of the Cr:YAG samples. A dichroic beam splitter was designed to reflect the excitation laser (532 nm) and pass the Cr3+ fluorescence (600-900 nm) as shown in Fig. 3.10 (a). A band pass filter with a transparent window from 600 to 900 nm was set to increasing the signal-to-noise ratio as shown in Fig. 3-10 (b), followed by a 50-µm diameter pinhole for spatial filtering. Then, a silicon photodiode (DET 210, Thorlabs) and a fiber coupled spectrometer (86142A, HP) were used to measuring Cr3+ fluorescence intensity and spectrum [1.26]. Focal Silicon PD. Eyepieces. Objective lens. Prism Pinhole Optical spectrum analyzer. Band pass filter Dichroic. Frequency doubled. (600~900 nm). BS. Nd:YVO4 laser (532 nm). Objective lens 40×/0.65. Sample 2D-stepping. Fig. 3.9. Measurement of Cr3+ by Laser scanning confocal microscopy setup. 34.
(49) Fluorescence intensity (a.u.). 1.0. Cr3+ fluorescence spectrum. 0.8 0.6 0.4 0.2 0.0 625. 650. 675. 700. 725. 750. Wavelength (nm). 775. 800. (a). Transmittance (%). 100 80 60 40 20 0 500. 600. 700. 800. 900. 1000. 1100. Wavelength (nm). (b) Fig. 3.10. (a) The Cr3+ fluorescence spectrum and (b) the transmittance spectrum of dichroic beam splitter. The Cr3+ fluorescence mappings Cr:YAG samples with diameters of 0.92 and 0.3 mm are shown in Fig. 3.11. The Cr3+ fluorescence mappings reflect the concentration distribution of Cr3+ ions in the crystal fiber. In the 0.92 mm sample, we can easily find the stress striation in the fiber center. This stress striation was formed by three {211} facet planes [3.4-3.5], and it disappeared when the diameter of the crystal was reduced to before 0.3 mm. Therefore, after down-sizing the crystal fiber in diameter, the high-optical homogeneity crystal was obtained.. 35.
(50) 0.92 mm. 0.3 mm. 3+. Fig. 3.11. Cr fluorescence mapping of crystal fiber with 0.92 and 0.3 mm in diameter. EPMA can be used to measure the concentration of Cr ions; while LSCM can acquire the fluorescence intensity of Cr3+ ions. A comparison between LSCM and EPMA measurements is shown in Fig. 3.12. 0.20. 0.20. 0.15. 0.10. 0.10. 0.05. 0.05. 0.92 mm crystal fiber. 3+. Cr concentration (wt.%). EPMA: Cr2O3. 0.15. 0.00. 0. 20. 40. 60. 80. 0.00 100. EPMA measurement (wt.%). 3+. Cr fluorescence. Percent diameter (%) (a) 0.10. 3+. Cr fluorescence 0.08. 0.08. EPMA: Cr2O3. 0.06. 0.06. 0.04. 0.04. 0.02 0.00. 0.02. 0.3 mm crystal fiber 0. 20. 40. 60. 80. EPMA measurement (wt.%). Cr3+ concentration (wt.%). 0.10. 0.00 100. Percent diameter (%) (b) Fig. 3.12. Comparison between LSCM and EPMA measurements for (a) 0.92 mm and (b) 0.3 mm crystal fibers.. 36.
(51) For the 0.92-mm-diameter crystal fiber, the two curves are in good agreement as shown in Fig. 3.12 (a). It indicated that most Cr ions are Cr3+ ions. Figure 3.12 (b) shows that the signal-to-noise ratio of the LSCM data is higher than that of the EPMA measurement. The measured Cr3+ concentration by the LSCM was determined to be 1.6×1017 cm-3, which is equal to 4.4×10⁻⁴ wt.% with a 0.3-sec/pixel measurement rate. However, the Cr2O3 sensitivity of the EPMA measurement was determined to be 0.01 wt.% with a 240-sec-per-spot measurement time. The LSCM measurement exhibits much superior sensitivity and faster in acquisition speed than EPMA measurement. For the Cr3+ concentration ions across fiber after each diameter-reduction step, Figure 3.13 shows that the distribution of Cr3+ by the LSCM measurement is getting smoother from 0.92 to 0.066 mm. It is also verified from the distribution of Cr2O3 by. 3+. Cr concentration (wt.%). the EPMA measurement. 0.20 0.18 0.16 0.14 0.12 0.10 0.08 0.06 0.04 0.02 0.00. 0.92 920 mm µm 0.53 530 mm µm 0.30 300 mm µm 0.066 66 µmm m. 0. 10 20 30 40 50 60 70 80 90 100 Percent diameter (%). Fig. 3.13. Cr3+ concentration across fiber with different diameter measured by LSCM.. 3.2.2 Measurement of concentrations of tetrahedral Cr4+ ions Figure 3.14 shows the Cr4+ fluorescence measurement setup. Dichroic beam splitter was designed to reflect the excitation laser (1064 nm) and pass the Cr4+ fluorescence (1200-1700 nm) as shown in Fig. 3.15(a), a long pass filter was set for passing the wavelength longer than 1300 nm to measure the Cr4+ fluorescence as shown in Fig 3.15 (b). An InGaAs photodiode (G8370-05, Hamamatsu) and an optical spectrum analyzer (86142A, HP) were used for measuring the Cr4+ fluorescence intensity and spectrum. 37.
(52) InGaAs PD. Focal. (For Cr4+). lens. Eyepiece Objective lens Prism. Pinhole Long pass filter. Dichroic. 1300 nm. BS. Optical spectrum analyzer. Yb fiber laser (1064 nm). Objective lens 40X/0.65. Sample 2D-stepping motor. Fig. 3.14. Setup of Cr4+ by laser scanning confocal microscopy. Fluorescence intensity (a.u.). 1.0. Cr4+ fluorescence spectrum. 0.8 0.6 0.4 0.2 0.0 1100. 1200. 1300. 1400. 1500. 1600. 1700. Wavelength (nm). (a). Transmittance (%). 100 80 60 40 20 0 1000. 1100. 1200. 1300. 1400. 1500. 1600. 1700. Wavelength (nm). (b) 4+. Fig. 3.15. (a)The Cr fluorescence spectrum and (b) the transmittance spectrum of dichroic beam splitter. 38.
數據

+7


![Fig. 2.13. Percentage of Cr 4+ to total Cr as a function of Ca/Cr [1.25].](https://thumb-ap.123doks.com/thumbv2/9libinfo/8892796.256043/35.892.288.679.149.442/fig-percentage-cr-total-cr-function-ca-cr.webp)
相關文件
• helps teachers collect learning evidence to provide timely feedback & refine teaching strategies.. AaL • engages students in reflecting on & monitoring their progress
For example Competition Provisions in Hong Kong Chapter 106 Telecommunication Ordinances 7K : S.1 A licensee (entity) shall not engage in conduct which, in the opinion of
Teachers may consider the school’s aims and conditions or even the language environment to select the most appropriate approach according to students’ need and ability; or develop
Robinson Crusoe is an Englishman from the 1) t_______ of York in the seventeenth century, the youngest son of a merchant of German origin. This trip is financially successful,
fostering independent application of reading strategies Strategy 7: Provide opportunities for students to track, reflect on, and share their learning progress (destination). •
Strategy 3: Offer descriptive feedback during the learning process (enabling strategy). Where the
How does drama help to develop English language skills.. In Forms 2-6, students develop their self-expression by participating in a wide range of activities
An electronic textbook is a comprehensive and self-contained curriculum package with digital print-on demand contents and electronic features (e-features include multimedia
