On Balloon Drawings of Rooted Trees
Chun-Cheng Lin
1Hsu-Chun Yen
1,2,∗1Department of Electrical Engineering
National Taiwan University, Taipei, Taiwan 106, ROC [email protected] [email protected]
2Department of Computer Science Kainan University, Taoyuan, Taiwan 338, ROC
Abstract
Among various styles of tree drawing reported in the literature, bal-loon drawingenjoys a desirable feature of displaying tree structures in a rather balanced fashion. Each subtree in the balloon drawing of a tree is enclosed in a circle. Along any path from the root node, the radius of each circle reflects the number of descendants associated with the root node of the subtree. In this paper, we investigate various issues related to balloon drawings of rooted trees from the algorithmic viewpoint. First, we design an efficient algorithm to optimize the angular resolution and the aspect ratio for the balloon drawings of rooted unordered trees. For the case of ordered trees for which the center of the enclosing circle of a subtree need not coincide with the root of the subtree, flipping the drawing of a subtree (along the axis from the parent to the root of the subtree) might change both the aspect ratio and the angular resolution of the drawing. We show that optimizing the angular resolution as well as the aspect ratio with respect to this type of rooted ordered trees is reducible to the perfect matching problem for bipartite graphs, which is solvable in polynomial time. In addition, a related problem concerning the optimization of the drawing area can be modelled as a specific type of nonlinear programming for which there exist several robust algorithms in practice. With a slight modification to the balloon drawing, we are able to generate the draw-ings of galaxy systems, H-trees, and sparse graphs, which are of practical interest.
Article Type Communicated by Submitted Revised Regular paper P. Eades and P. Healy January 2006 January 2007
* Corresponding author. Research supported in part by NSC Grant 94-2213-E-002-086, and Research Grant 95-EC-17-A-02-S1-049, Taiwan.
1
Introduction
Graph drawing addresses the issue of constructing geometric representations of graphs in a way to gain better understanding and insights into the graph struc-tures. If the given data is hierarchical (such as a file system or a web graph), then it can often be expressed as a rooted tree. Among existing algorithms in the literature for drawing rooted trees, Reingold and Tilford [13] developed a popular method for drawing binary trees. The idea behind [13] is to recursively draw the left and right subtrees independently in a bottom-up manner, then shift the two drawings along the x-direction as close to each other as possible while centering the parent of the two subtrees one level up between their roots. Different from the conventional ‘triangular’ tree drawing of [13], radial draw-ings [4] and balloon drawing [3, 5, 6, 7, 8] with respect to cone trees1[14] are also popular for visualizing hierarchical graphs. The interested reader is also referred to [9, 10, 11] for graph drawing techniques based on the idea of embed-ding trees/graphs in hyperbolic geometry to automatically obtain a deformation resulting in a focus+context navigation. Since the majority of algorithms for drawing rooted trees take linear time, rooted tree structures are suited to be used in an environment in which real-time interactions with users are frequent. A balloon drawing [3, 6, 7] of a rooted tree is a drawing having the following properties:
(P1) all the children under the same parent are placed on the circumference of the circle centered at their parent,
(P2) there exist no edge crossings in the drawing, and
(P3) for the two edges on any path from the root node, the farther from the root an edge is, the shorter its drawing length becomes.
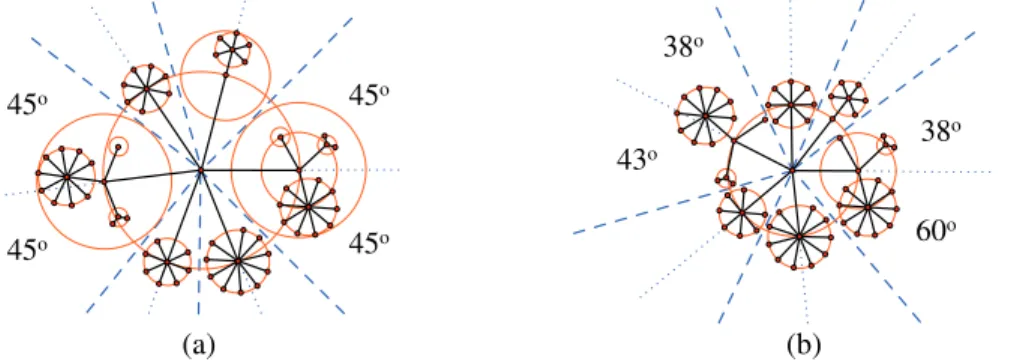
Each subtree in the balloon drawing of a tree is enclosed entirely in a circle, which resides in a wedge whose end-point is the parent node of the subtree. Along any path from the root node, the radius of each circle reflects the number of descendents associated with the root node of the subtree. The ray from the parent to the root of the subtree divides the wedge into two sub-wedges. Depending on whether the two sub-wedge angles are required to be identical or not, a balloon drawing can further be divided into two types: drawings with even angles (see Figure 1 (a)) and drawing with uneven angles (see Figure 1 (b)). Another way to differentiate the two is that for the former (i.e., the even angle case), it is required that the position of the root of a subtree coincide with the center of the enclosing circle of the subtree.
The main aesthetic criteria on balloon drawing are angular resolution and aspect ratio. The angular resolution refers to the smallest angle between two 1Given a rooted tree, the cone tree method places the root of every subtree on the vertex of a cone and its children on the circumference of the base of the cone in 3-D space such that there are no cones overlapping each other. A balloon drawing can be viewed as the projection of a cone tree on a plane.
(a) (b) 38o 43o 38 o 60o 45o 45o 45o 45o
Figure 1: Illustration of balloon drawings with (a) even angles and (b) uneven angles.
adjacent edges incident to the common node in straight-line drawing, whereas the aspect ratio is defined as the ratio of the largest angle to the smallest angle formed by two adjacent edges incident to the common node in straight-line drawing. A tree layout with a small aspect ratio often enjoys a very balanced view of a tree.
It is not hard to observe that with respect to a rooted unordered tree, chang-ing the order in which the children of a node are listed affects the angular reso-lution as well as the aspect ratio of the drawing. Hence an interesting question arises: How to find an embedding of a rooted unordered tree such that the bal-loon drawing of the tree has the maximum angular resolution and the minimum aspect ratio? The first part of this paper is devoted to answering the above question. We demonstrate an efficient algorithm which is guaranteed to yield an optimal balloon drawing in terms of the (maximum) angular resolution and the (minimum) aspect ratio. Here we assume the balloon drawing to be of the even angle type.
Now consider the case when the balloon drawing is of the uneven angle type. Allowing uneven angles introduces another dimension of flexibility as far as optimizing the angular resolution and the aspect ratio is concerned. Even if the embedding (ordering) of a tree is given, flipping the drawing of a subtree along the axis going through the parent and the root of the subtree might change the angular resolution as well as the aspect ratio of the drawing. Notice that in the uneven angle case, the angles on the two sides of the axis might not be equal. A related question is: How to flip uneven angles in the balloon drawing of a rooted ordered tree to achieve optimality in angular resolution and aspect ratio? Notice that in the above, the embedding of the underlying tree is fixed. As it turns out, we are able to reduce the above problem to that of perfect matching of bipartite graphs, which admits a polynomial time solution.
In fact, the balloon drawing of the uneven angle case is derived from a process of minimizing the drawing area of balloon drawing of the even angle case subject to preserving properties (P1)-(P3) of balloon drawing (this will be illustrated in Section 4). There is, however, some work (e.g., [5, 8]) suggesting
that properties (P1) and (P3) may not be necessary for generating balloon drawings, i.e., the nodes under the same parent need not be placed on the same circle circumference. As a result, we consider a problem related to optimizing the drawing area under a slightly modified version of balloon drawing, in which properties (P1) and (P3) of balloon drawing are relaxed by coloring the edges at the same level with the same color, i.e., the level of an edge can be determined by observing its color [16]. We are able to formulate the problem as a specific type of nonconvex nonlinear programming, for which there exist many robust algorithms in the literature for practical applications.
In addition, minor extensions to the balloon drawing facilitate several in-teresting applications, including galaxy systems, H-trees, sparse graphs, among others. Our balloon drawing approach to galaxy systems gives an abstract lay-out of the related positions of bodies instead of their real positions and hence enjoys the advantage that the hierarchical structure of a galaxy system can be easily observed in such a layout. For more about visualizing the dynamic move-ments of bodies in a galaxy system due to their mutual forces, the reader is referred to [1] for the gravitational n-body problem.
The rest of the paper is organized as follows. Some preliminaries are given in Section 2. The algorithmic discussions for balloon drawings of even angles and uneven angles are given in Section 3 and Section 4, respectively. Section 5 discusses the related problem concerning the optimization of the drawing area. Section 6 gives some interesting applications. Finally, a conclusion is given in Section 7.
2
Preliminaries
A drawing of a graph G (=(V, E) where V is the set of nodes and E⊆ V × V is the set of edges) on the plane is a mapping D from V to R2, where R is the set of real numbers. That is, each node v is placed at point D(v) on the plane, and each edge (u, v) is displayed as a line segment connecting D(u) and D(v). A rooted tree where the order of the subtrees is significant and fixed is called an ordered tree; otherwise, it is called unordered. A star graph with n + 1 nodes is a rooted tree in which the root node is of degree n and the others are of degree one.
Given a drawing of graph G, the angular resolution at node v refers to the smallest angle formed by two adjacent edges incident to v in the drawing of G. The angular resolution of a drawing of G is defined as the minimum angular resolution among all nodes in G. The aspect ratio of a drawing of G is the ratio of the largest angle to the smallest angle in the drawing. The angular resolution (resp., aspect ratio) of a drawing of G is in the range of (0◦, 360◦) (resp., [1,
∞)). One of the objectives of this paper is, given a rooted unordered tree G, finding the optimum angular resolution and the optimum aspect ratio with respect to the so-called balloon drawing of G on the plane.
There exist two models in the literature for generating balloon drawings of trees, as shown in Figure 3 (a) and (b), respectively. Given a node v, let r(v)
be the radius of the drawing circle centered at v. If we require that r(v) = r(w) for two arbitrary nodes v and w that are of the same depth from the root of the tree, as shown in Figure 3 (a), then such a drawing is called a balloon drawing under the fractal model [7]. The fractal drawing of a tree structure means that if lm and lm−1 are the lengths of edges at depths m and m− 1, respectively, then lm= γ× lm−1where γ is the predefined ratio (0 < γ < 1) associated with the drawing under the fractal model. Clearly, edges at the same depth have the same length in a fractal drawing.
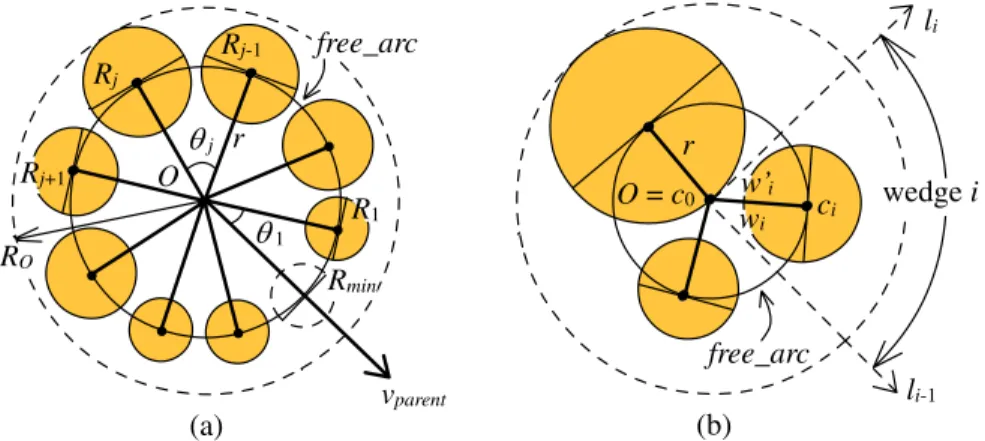
Unlike the fractal model, the subtrees with nonuniform sizes (abbreviated as SNS) model [3, 6] allows subtrees associated with the same parent to reside in circles of different sizes, as shown in Figure 3 (b), and hence, the drawing based on this model often results in a clearer display on large subtrees than that under the fractal model. Given a rooted ordered tree T with n nodes, a balloon drawing under the SNS model can be obtained in O(n) time in a bottom-up fashion (see [3, 6]) with the edge length and the angle between two adjacent edges according to r = C/(2π) ∼= (2PjRj)/(2π) and θj ∼= (Rj−1+ f ree arc + Rj)/r (see Figure 2) respectively, where r is the radius of the inner circle centered at node O, C is the circumference of the inner circle, Rj is the radius of the outer circle enclosing all subtrees of the j-th child of O, and RO is the radius of the outer circle enclosing all subtrees of O. Since there exists a gap between C and the sum of all diameters, we can distribute to every θj the gap between them evenly, denoted by f ree arc.
(a) (b) free_arc r li li-1 wedge i ci r Rj Rj-1 O vparent RO free_arc R1 Rj+1 Rmin j w’i wi O = c0 1
Figure 2: The SNS model. (a) Node O is not the root, and the edge between O and its parent goes through a circle with radius Rmin; (b) is a star graph centered at c0. Assume that node O has n children. When computing r and θj in (a), one should notice that Rmin is viewed as Rn+1, and hence, (a) can be viewed as (b) where node O has n + 1 children. In general, it suffices to consider the case of (b) when computing r and θj.
Note that the trees considered in [3, 6] are ordered. Since the fractal model assumes that all the angles between neighboring edges emanating from a
com-mon node are the same, changing the ordering of the subtrees of a node at any level does not affect the angular resolution (nor the aspect ratio) of the drawing. Under the SNS model, however, the ordering of subtrees is critical as far as the angular resolution and the aspect ratio are concerned. Our goal is to devise an algorithm for finding the balloon drawing of a rooted unordered tree (under the SNS model) for which the angular resolution and the aspect ratio are optimized.
3
Finding the balloon drawing with optimum
angular resolution and optimum aspect ratio
First, we consider the following way of drawing a star graph with circles of nonuniform size attached to the children of the root (see Figure 2 (b) for an example).
Definition 1 The balloon drawing of a star graph with children of nonuniform size is a drawing in which
1. circles associated with different children of the root do not overlap, and 2. all the children of the root are placed on the circumference of a circle
centered at the root.
Let S be a star graph with n + 1 nodes{c0, c1, ..., cn}, where c0is the root. It can easily be seen from Figure 2 (b) that, in a balloon drawing of S, the circle centered at the root is divided into n wedges (or slices) each of which accommodates a circle associated with a child of c0. Let wi (resp., wi′) be the angle between rays −−→li−1 and −−→c0ci (resp., −→li and −−→c0ci). The balloon drawing is said to be of even angle if wi= wi′, for all 1≤ i ≤ n. That is, −−→c0ci divides the respective wedge into two equal sub-wedges; otherwise (i.e., the requirement wi= w′i is dropped), the drawing is said to be of uneven angle. In this section, we only consider balloon drawings of even angle. More will be said about the uneven angle case in Section 4.
Let θi, 1≤ i ≤ n, be the size of the wedge angle enclosing the circle centered at node ci. (In Figure 2 (b) θi= wi+ w′i= 2wi, assuming the even angle case.) An ordering of the children of c0 is simply a permutation σ of{1, ..., n}, which specifies the placements of nodes c1, ..., cn (and their associated circles) along the circumference of the circle centered at c0 in the balloon drawing. More precisely, the children are drawn in the order of cσ1, cσ2, ..., cσn, in which cσi
and cσi⊕1, 1≤ i ≤ n, are neighboring nodes.
2 With respect to σ, the size of the angle between −−→c0ci and −−−−→c0ci⊕1 is
θσi+θσi⊕1
2 . Hence, the angular resolution (denoted by AngReslσ) and the aspect ratio (denoted by AspRatioσ) are
AngReslσ= min 1≤i≤n{
θσi+ θσi⊕1
2 }
and AspRatioσ ={ max1≤i≤n{ θσi+θσi⊕1 2 } min1≤i≤n{ θσi+θσi⊕1 2 } }
Let Σ be the set of all permutations of{1, ..., n}. In what follows, we shall design an efficient algorithm to find a permutation that returns
optAngResl = maxσ∈Σ{AngReslσ} and
optAspRatio = minσ∈Σ{AspRatioσ}
The optAngResl is said to involve angles θσi and θσi⊕1 if i is the value that
minimizes AngReslσ with respect to the optimal permutation σ. It should be noticed that the permutation witnessing optAngResl or optAspRatio may not be unique.
For notational convenience, we order the set of wedge angles θ1, ..., θn in ascending order as either
m1, m2, ..., mk−1, mk, Mk, Mk−1, ..., M2, M1 (1) if n is even, or
m1, m2, ..., mk−1, mk, mid, Mk, Mk−1, ..., M2, M1 (2) if n is odd, for some k where mi (resp. Mi) is the i-th minimum (resp. maxi-mum) among all, and mid is the unique median. We define αij = Mi+m2 j, 1≤ i, j≤ k.
Recall from Figure 2 (a) that the drawing of the subtree rooted at a node O is enclosed in a circle centered at O. By abstracting out the details of each of the subtrees associated with the children of O, the balloon drawing of the subtree at O can always be viewed as a balloon drawing of a star graph with children of nonuniform size rooted at O, regardless of the depth at which O resides. In addition, even if we alter the ordering of the children of O, the size of the outer circle bounding all the children of O remains the same; hence, the optimization of each of the subtrees at depth k does not affect the optimization of their parent at depth k− 1. In view of the above, optimizing the angular resolution as well as the aspect ratio of a balloon drawing of a rooted unordered tree can be carried out in a bottom-up fashion. As a result, it suffices to investigate how to optimize the angular resolution and the aspect ratio of balloon drawing with respect to star graphs.
We give the drawing algorithm in Procedure 1 that achieves optimal angular resolution and aspect ratio under the SNS balloon drawing model.
Theorem 1 Procedure 1 achieves optimality in angular resolution as well as in aspect ratio for star graphs.
Procedure 1 OptBalloonDrawing
Input: a star graph S with n child nodes of nonuniform size.
Output: a balloon drawing of S optimizing angular resolution and aspect ratio.
– Sort the set of the wedge angles (accommodating the n nonuniform circles) into ascending order as mentioned in Equations (1) and (2).
– Depending on whether n = 2k or 2k+1 and whether k is odd or even, output (M1, m2, M3, m4, ...(, mid), ..., M4, m3, M2, m1) with the corresponding drawing illustrated below: (Note that M1 and m1 are adjacent.)
(a) If n = 2k and k is odd. (b) If n = 2k and k is even. (d) If n = 2k + 1 and k is even. (c) If n = 2k + 1 and k is odd. m1 M1 m2 M2 m3 M3 mk Mk mk-1 Mk-1 ... ... Mk mk Mk-1 mk-1 m1 M1 m2 M2 m3 M3 ... ... Mk mk Mk-1 mk-1 mid m1 M1 m2 M2 m3 M3 ... ... mk Mk mk-1 Mk-1 mid m1 M1 m2 M2 m3 M3 ... ...
Proof: In what follows, we only consider the case
σ = (M1, m2, M3, m4, ..., Mk−1, mk, mid, Mk, mk−1, ..., M4, m3, M2, m1) i.e., n = 2k+1 and k is odd, and assuming that the sizes of angles are all distinct (break ties arbitrarily); the remaining cases are similar (in fact, simpler).
Recall that αij =Mi+m2 j. One can easily see the following properties of σ: Property (1). for each i∈ {2, ..., k}, the angles of sizes (mid+mk)/2, α(i−1)i=
(Mi−1+ mi)/2, (Mk+ mid)/2, and αi(i−1)= (Mi+ mi−1)/2 are included in σ;
Property (2). the size of the smallest angle of σ must be (mid + mk)/2 or αj(j−1), while the size of the biggest angle of σ must be (Mk+ mid)/2 or α(l−1)l for some j, l∈ {2, ..., k}.
The reason behind Property (2) is that all the angles consecutively appearing in σ have the following relationship:
α12> α32< α34> ... > αj(j−1) < ... < α(l−1)l> ... > αk(k−1)< Mk+ mid 2 >mid + mk 2 < α(k−1)k> ... > α43< α23> α21< M1+ m1 2 < α12 where, for each j, l∈ {2, ..., k}, αj(j−1)and (mid + mk)/2 are wrapped between ‘>’ and ‘<’, while α(l−1)l and (Mk+ mid)/2 are wrapped between ‘<’ and ‘>’.
Suppose δ is the permutation that witnesses optAngResl. From Property (2), the minimum angular resolution of σ must be either αi,i−1, for some 2 ≤ i≤ k, or (mid + mk)/2. In what follows, we only consider the case when the minimum angular resolution of σ is αi,i−1= (Mi+ mi−1)/2; the other case can be proved similarly.
Now if Mi is a neighbor of mi−1 in δ (i.e., the optimal permutation), then δ and σ have the same angular resolution and optAngResl = αi,i−1. Because, otherwise,
• if optAngResl < αi,i−1 (which is the angular resolution of σ), then this contradicts that δ is the optimal.
• if optAngResl > αi,i−1, then this is impossible because δ has an angle of size αi,i−1= (Mi+ mi−1)/2.
Hence, σ is optimal as well.
On the other hand, suppose x and y (x < y) are the two neighbors of mi−1in δ and neither one is Mi, then both x and y must be greater than Mi; otherwise, the angular resolution of δ is smaller than (Mi + mi−1)/2 – contradicting δ being optimal. Also note that optAngResl≥ (mi−1+ x)/2. Now if we look at a partition of the set of wedge angles of S as follows:
m1< ...
| {z } < mi−1< |{z}... < Mi< ... < x < ... < y < ...M| {z 1}.
RA RB RC
RA contains i− 2 elements, which must be connected to at least i − 1 elements of RC; otherwise, the angular resolution in δ becomes less than (Mi+ mi−1)/2 – a contradiction. RC originally contains i− 1 elements. However, x and y are the two neighbors of mi−1, meaning that together with mi−1 they are tied together and cannot be separated. So effectively only ‘i− 2’ elements of RC can fill the i− 1 neighbors of RA, which is not possible. We have a contradiction. What the above shows is that for a permutation δ to be optimal, a neighbor of mi−1 is Mi. Hence, the angular resolution of δ is≤ (Mi+ mi−1)/2. Since δ witnesses optAngResl, optAngResl = (Mi+ mi−1)/2, meaning that σ also produces optAngResl.
The above implies that optAngResl must be either (mid + mk)/2 or αi(i−1) for some i∈ {2, ..., k}, which is always included in the circular permutation σ produced by Procedure 1. Similarly, we can prove that the minimum size of the largest angle of any drawing must be (Mk + mid)/2 or α(j−1)j for some j∈ {2, ..., k}, which is also always in σ. Since σ simultaneously possesses both the maximum size of the smallest angle and the minimum size of the largest angle of any drawing, σ also witnesses the optimum aspect ratio. 2 Using Procedure 1, the drawing of a rooted unordered tree which achieves optimality in angular resolution and aspect ratio can be constructed efficiently in a bottom-up fashion.
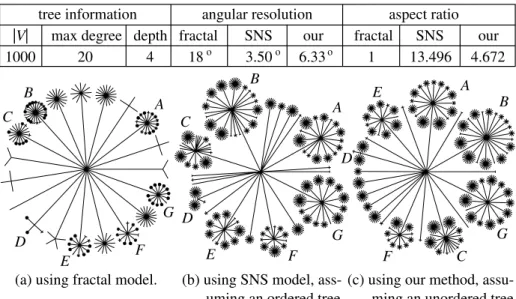
(a) using fractal model. (b) using SNS model, -uming an ordered tree.
(c) using our method, -ming an unordered tree.
A B C D E F G A B C D E F G A B C D E F G
|V| max degree depth fractal SNS our fractal SNS our 1000 20 4 18 3.50 6.33 1 13.496 4.672
tree information angular resolution aspect ratio
o o o
Figure 3: Three drawings of a tree and their statistics.
Finally, in order to give a sense perception on the advantages of our algo-rithm, the algorithm was implemented with a simple experimental result shown in Figure 3. The drawing in Figure 3 (a) is based on the fractal model, which displays a drawing in which the sizes of angles spanned by adjacent edges are identical, and hence, Figure 3 (a) has the best angular resolution and aspect ratio. The major drawback of fractal drawing, as can be seen in Figure 3 (a), is that visibility deteriorates considerably as we move towards deeper subtrees of complicated structures. In order to observe more complicated subtrees clearer and easier, one may apply the SNS model (with respect to an ordered tree) to yield Figure 3 (b). (Note that Figure 3 (b) has the same ordering as that in Fig-ure 3 (a).) To a certain extent, the SNS model sacrifices the angular resolution and the aspect ratio in order to gain better visibility for displaying complicated subtree structures. If the ordering of subtrees is allowed to be altered, our optimization algorithm has the ability to optimize the angular resolution and the aspect ratio under the SNS model on the balloon drawing of the rooted unordered tree, as shown in Figure 3 (c).
As a direction for future research, it is of interest to compare (experimen-tally) our work presented in this section with the technique of bubble tree draw-ing, which, according to [5], also exhibits good results in angular resolution. (Note, however, that [5] only deals with ordered trees, and their goal to find a good drawing on the tradeoff between the angular resolution and the edge lengths is different from our work presented in this section.) It is also worthy of pointing out that the algorithm presented in [5] differs from the SNS model in the sense that they alow edges to have bends in order to optimize the use of screen space. In this regard, bubble tree drawing is relevant to our discussion
in Section 5 (dealing with optimizing the drawing area) and certainly deserves to be compared with our technique in greater detail in the future.
4
Balloon drawing with uneven angles
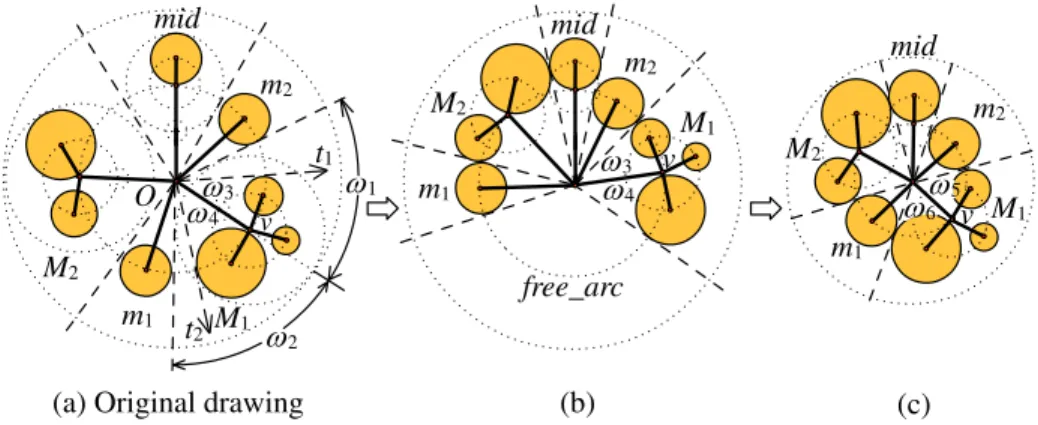
The area of a balloon drawing can be measured by the size of the circle en-closing the balloon drawing. Minimizing the area of a drawing is an important issue because any drawing needs to be rendered on a limited region. A careful examination of the approach investigated in Section 3 suggests that the area of balloon drawing generated by the SNS model may not be minimal. Part of the reason is the involvement of the so-called free arc described in the SNS model and Figure 2 (b), serving for the purpose of separating the enclosing circles of two neighboring subtrees. A more subtle point regarding the ‘waste’ of drawing space is illustrated in Figure 4, in which Figure 4 (a) shows the drawing of a tree under the SNS model. Let Tv be the subtree rooted at v. Based on the approach discussed in Section 3, Tv resides in a circle centered at v and the circle is included in a wedge in which the ray from O to v cuts the wedge into two sub-wedges of identical size (i.e., ω1= ω2). By limiting the drawing to the area formed by two lines (see t1and t2in Figure 4 (a)) tangent to the drawing of Tv, the drawing area is reduced. That is, the new wedge (in which the drawing of Tv resides) is now spanned by lines t1 and t2with the size of the wedge angle equals ω3+ ω4. Furthermore, the ray −→Ov cuts this new wedge into two possibly uneven parts (i.e., ω3 need not be equal to ω4).
v
(a) Original drawing (b) (c)
m1 m2 mid M1 M2 m1 m2 M1 m1 m2 mid M1 M2 O t2 t1 free_arc 3 4 1 2 3 4 mid M2 5 6 v v
Figure 4: An approach for minimizing the drawing area where each shaded circle is a star graph.
Allowing uneven angles tends to release extra space between the drawings of neighboring subtrees, in comparison with the case discussed in Section 3 when only even angles are permitted. The presence of such extra space allows us to move the position of each subtree inwards (i.e., towards the root node O) which, in turn, reduces the drawing area as Figure 4 (b) shows. The drawing area can
further be reduced by shrinking the free arc on the bottom of Figure 4 (b). The final drawing is shown in Figure 4 (c) which obviously has a smaller drawing area (compared with Figure 4 (a)). However, the angular resolution and the aspect ratio of the drawing might deteriorate as Figure 4 (c) indicates.
With respect to Figure 4 (c), it is interesting to observe that the angular resolution and the aspect ratio might change if we flip the drawing of subtree Tv along the axis −→Ov (i.e., swapping ω5and ω6). In view of the above, a natural question is to determine how the two possibly uneven angles associated with a subtree are arranged in order to achieve an optimal aspect ratio and angular resolution, assuming the ordering of subtrees in the drawing is fixed. Such a question can be formulated as follows.
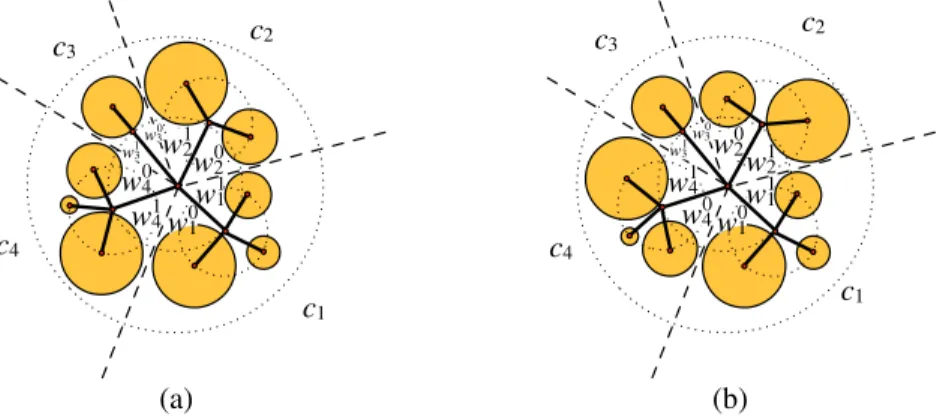
Suppose O is the root of a star graph with n subtrees rooted at c1, ..., cn which are listed in a counterclockwise fashion. Suppose the sizes of the two angles associated with subtree ci (1 ≤ i ≤ n) are wi0 and wi1. See Figure 5 for an example. Then the sequence of angle sizes encountered along the circle centered at O can be expressed as:
{wt1 1, w t′ 1 1 | {z } , wt2 2, w t′ 2 2 | {z } , ..., wti i , w t′ i i | {z } , ..., wtn n , w t′ n n | {z }} c1 c2 ... ci ... cn, (3)
where ti, t′i ∈ {0, 1} and ti+ t′i = 1. With respect to the above, the angular resolution is
AngResl = min1≤i≤n{wt
′ i
i + w ti⊕1
i⊕1} and the aspect ratio is
AspRatio =max1≤i≤n{w t′ i i + w ti⊕1 i⊕1} min1≤i≤n{wt ′ i i + w ti⊕1 i⊕1} .
The problem then boils down to assigning 0 and 1 to ti and t′i (1 ≤ i ≤ n) in order to optimize AngResl and AspRatio. Note that the two values (either (0, 1) or (1, 0)) of (ti, t′i) correspond to the two configurations of the drawing of the subtree associated with ci and one is obtained from the other by flipping along the axis −−→Oci. To give the reader a better understanding of how the angular resolution is affected in the uneven angle case, consider Figure 5. In Figure 5 (a), the size of the angle between subtrees c1 and c2 is w11+ w02. Now if we flip the drawing of subtree c2 as shown in Figure 5 (b), the angle between subtrees c1 and c2 becomes w11+ w21.
Consider the following problems:
The Aspect Ratio (resp., Angular Resolution) Problem : Given the initial drawing of a star graph (with uneven angles) specified by Equation (3) and a real number r, determining the assignments (0 or 1) for ti and t′
i (1≤ i ≤ n) so that AspRatio ≤ r (resp., AngResl ≥ r); return false if no such assignments exist.
(a) (b) c1 c2 c4 c3 c1 c2 c4 c3 0 w3 1 w3 0 w3 1 w3 w10 w11 w21 w20 w41 w40 w10 w11 w21 w20 w41 w40
Figure 5: Illustration of the balloon drawing with uneven angles. In what follows, we show how the above two problems can be reduced to perfect matching for bipartite graphs. A matching M on a graph G is a set of edges of G such that any two edges in M share no common node. A maximum matching of G is a matching of maximum cardinality. The largest possible matching on a graph with n nodes consists of n/2 edges, and such a matching is called a perfect matching. It is known that the maximum matching problem for bipartite graphs with n nodes and m edges can be found in O(√mn) time [12].
Theorem 2
Both the Aspect Ratio Problem and the Angular Resolution Problem can be solved in O(n1.5log n) time.
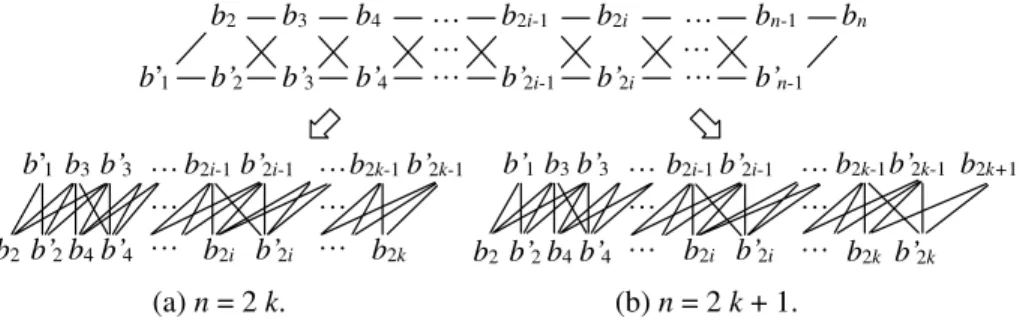
Proof: We consider the Aspect Ratio Problem first. Let r be the bound of the desired aspect ratio. Suppose the set of sub-wedge angles of the star graph is specified as {b1, b′1 | {z } , b2, b′2 | {z } , ..., bi, b′i | {z } , ..., bn, b′n | {z }} c1 c2 ... ci ... cn.
Notice that bi and b′i are the sizes of the two angles associated with the wedge in which the drawing of the subtree rooted at ci resides. bi (b′i) can be the neighbor of one of bi−1, b′i−1, bi+1, and b′i+1, depending on where ci−1, ci and ci+1 are positioned in the drawing. (For instance, if bi is paired with b′i+1, the angle between −−→Oci and −−−→Oci+1 becomes bi + b′i+1.) As a result, to determine whether it is feasible to realize a drawing for which the aspect ratio is less than or equal to r, our algorithm iteratively selects a pair (x, y) where x∈ {bi, b′i} and y ∈ {bi⊕1, b′i⊕1} so that x + y is assumed to be the ‘smallest’ angle in a drawing respecting the aspect ratio r, if such a drawing exists. Then a bipartite graph G(x,y) is constructed in such a way that a drawing respecting the aspect ratio r exists iff G(x,y) has a perfect matching.
To better understand the algorithm, consider the case when (x, y)= (b1, b′n). Let φ = b1+ b′n. G(b1,b′n) (=((U, W ), E), where U∪ W is the set of nodes and
U∩ W = ∅) is constructed as follows (assuming n = 2k): (1) U ={b′
1, b3, b′3, ..., b2i−1, b′2i−1, ..., b2k−1, b′2k−1}; W ={b2, b′2, b4, b′4, ..., b2i, b′2i, ..., b2k−2, b′2k−2, b2k}
(2) Note that (b1, b′n) is the only edge involving b1 or b′n, so it does not need to be considered in computation.
For each i∈ {2, 3, ..., k − 1}, (s, t) ∈ E, where s ∈ {b2i−1, b′2i−1} and t ∈ {b2i−2, b′2i−2, b2i, b′2i}, if φ ≤ (s + t) ≤ r · φ, meaning that placing s next to t (inducing an angle of size s + t) respects the aspect ratio, as well as φ being the smallest among all the angles in the drawing.
(b′
1, t)∈ E, where t ∈ {b2, b′2}, if φ ≤ (b′1+ t)≤ r · φ.
(s, t) ∈ E, where s ∈ {b2k−1, b′2k−1} and t ∈ {b2k−2, b′2k−2, b2k}, if φ ≤ (s + t)≤ r · φ.
See Figure 6 (a) for the structure of bipartite graph G(b1,b′n)for the case n = 2k.
The case n = 2k + 1 is similar (see Figure 6 (b)).
(a) n = 2 k. (b) n = 2 k + 1. b’1 b2b’2 b3b’3 b4b’4 b2i-1b’2i-1 b2i b’2i b2k-1b’2k-1 b2k b2b’2b4b’4 b2k b’2k b’1 b2 b’2 b3 b’3 b4 b’4 b2i-1 b’2i-1 b2i b’2i bn bn-1 b’n-1 b2i b’2i b2k+1 b’1b3b’3 b2i-1b’2i-1 b2k-1b’2k-1
Figure 6: The structure of G(b1,b′
n). The nodes with odd (resp. even) index are
placed on the upper (resp. lower) level.
In what follows, we show that G(b1,b′n)has a perfect matching iff there exists
a drawing for which AngResl = b1+ b′n, and AspRatio≤ r.
Suppose that G(b1,b′n) has a perfect matching M . Based upon the setting
of G(b1,b′n), since b
′
1 and bn are required to be matched in perfect matching M (see Figure 6), it turns out that, for 1 < l < n, one of bl and b′l is matched with either bl−1 or b′l−1in M , and the other one is matched with either bl+1 or b′
l+1 in M . Every matched edge (u, v) in M implies that sub-wedge u is placed next to sub-wedge v in the balloon drawing. Besides, one should notice that the setting of G(b1,b′
n) implies that sub-wedge b
′
n is placed next to sub-wedge b1. Using the above transformation, we can construct a balloon drawing with respect to M (see Figure 6). Recall that cl is associated with two sub-wedges bl and b′l for 1≤ l ≤ n. Now consider node c1. W.l.o.g., we assume that b′1 is matched with b2in M , i.e., sub-wedge b′1of node c1is placed next to sub-wedge b2of node c2 in the balloon drawing. Then we consider the matching of b′2 (the
other sub-wedge of node c2) in M . Since b2 has been matched with b′1, b′2only can be matched with either b3or b′3. W.l.o.g, we assume that b′2is matched with b3in M , i.e., the other sub-wedge b′2of node c2is placed next to sub-wedge b3of node c3 in the balloon drawing. Next we consider the matching of b′3 in M . In the similar way, we can construct a balloon drawing with respect to M . By the setting of G(b1,b′n), and the fact that the edges which violate AngResl = b1+ b
′ n and AspRatio≤ r are not included in G(b1,b′n), these edges do not appear in M .
Therefore, for this balloon drawing, AngResl = b1+ b′n, and AspRatio≤ r. Conversely, suppose that there exists a drawing D for which AngResl = b1+ b′n, and AspRatio≤ r. Since every bi (b′i) can be the neighbor of one of bi−1, b′i−1, bi−1, and b′i−1 in any balloon drawing for the aspect ratio problem, and AngResl for drawing D is formed by sub-wedges b1 and b′n (i.e., we can imagine that b′
n has been matched with b1), hence, the adjacency relation of sub-wedges in balloon drawing D must be a perfect matching of G(b1,b′n) (see
Figure 6). In what follows, we show the existence of such a perfect matching. Consider node c1. Since for the drawing, AngResl = b1+ b′n, i.e., sub-wedge b′
n of node cn is the neighbor of sub-wedge b1 of node c1 in D, hence, the other sub-wedge b′
1of node c1must be placed next to either b2or b′2in D. W.l.o.g., we assume that sub-wedge b′
1is placed next to sub-wedge b2in D. Since for drawing D, AngResl = b1+ b′n and AspRatio≤ r, hence, b1+ b′n ≤ b′1+ b2≤ r(b1+ b′n), which guarantees that edge (b′
1, b2) must appear in G(b1,b′n) according to the
setting of G(b1,b′n). In a similar way, we can guarantee that all of the edges
representing the adjacency relation of sub-wedges in drawing D must appear in G(b1,b′
n). Consequently, by navigating the circular permutation of sub-wedges
in D, a perfect matching for G(b1,b′
n)corresponding to D can be obtained.
In view of the above, G(b1,b′
n)has a perfect matching iff there exists a drawing
for which AngResl = b1+ b′n, and AspRatio≤ r. Hence, for each i, 1 ≤ i ≤ n, by examining the pair (x, y), x∈ {bi, b′i} and y ∈ {bi⊕1, b′i⊕1}, that contributes to AngResl (i.e., the smallest angle), whether a drawing with an aspect ratio ≤ r exists or not can be determined.
As for the executing time, since every node in the constructed bipartite graph is adjacent to at most four edges (see Figure 6), the total number of possible values of φ is O(n). We first sort the O(n) values. Each iteration during the binary search of these values constructs its corresponding bipartite graph and checks whether a perfect matching exists. For a given m-edge n-node bipartite graph, the perfect matching problem can be solved in O(√mn) time. As a result, the Aspect Ratio Problem can be solved in O(n log n + log n×√nn) = O(n1.5log n) time. The solution for the Angular Resolution Problem can be carried out along a similar line of the proof for the Aspect Ratio Problem. 2
5
Optimizing the drawing area
In the work of [16], a graph visualization style was introduced in which edges at the same level are colored using the same color and the color brightness of an edge is proportional to the distance from the root. Using this kind of
a visualization method, the level of a node is easily identified by observing its adjacent edge color, which in turn suggests an alternative way for balloon drawing (by relaxing properties (P1) and (P3) stated in Section 1). That is, in the modified version of balloon drawing the lengths of edges incident to the same parent need not be the same. Under this new drawing style, an interesting question arises:
The Area Problem : Given a star graph with children of nonuniform size, compute the minimum area of the circle enclosing the balloon drawing if children need not be located at the same distance from the root.
Ri-1 Ri+1
c
0 Ri ci ci+1 ci-1 i+1 di+1 di di-1 i i+2 Ri-1 Ri+1c
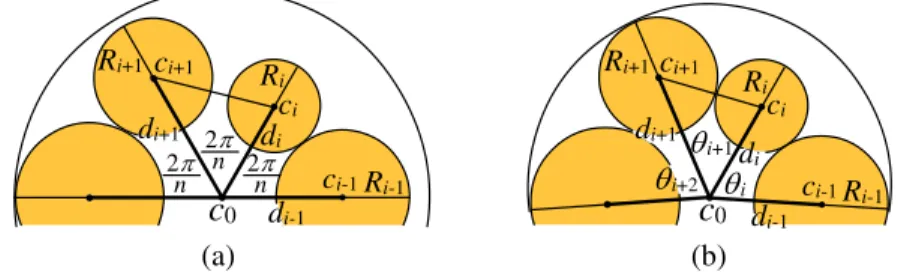
0 Ri ci ci+1 ci-1 2 n 2n 2 n di di-1 di+1 (a) (b)Figure 7: Illustration of the area problem.
To formulate a solution for the area problem, consider Figure 7 (a) in which the drawing of an ordered star graph under the even angle case is displayed. Root c0has n children c1, ..., cn, each of which resides in a circle. Let the radius of the cycle associated with child cibe Ri, 1≤ i ≤ n. Clearly the angle between neighboring edges c0ci and c0ci⊕1 is exactly 2π/n under the even angle case. We denote the distance between ciand c0by di, and consequently the problem for an ordered star graph under the even angle case can be expressed as the following instance of nonlinear programming:
Minimize z
subject to disin( 2π
n )≥ Ri, (4)
d2i + d2i⊕1− 2didi⊕1cos( 2π
n )≥ (Ri+ Ri⊕1)
2, (5)
z≥ Ri+ di (6)
for each i∈ {1, 2, ..., n}
where n ≥ 4 (otherwise trivial); di ∈ R and z are the variables. Note that the lower bounds of Inequality (4) hold when the circle centered at ci is tan-gent to the edge c0ci⊕1; Inequality (5) means that the distance between ci and ci⊕1 is greater than or equal to the sum of Ri and Ri⊕1, which guarantees that there is no overlapping between the two circles; Inequality (6) is to enforce z = maxi{Ri+ di}. Also note that the objective of minimizing z is equivalent
to minimizing the area. This kind of an optimization problem with a linear ob-jective function and quadratic constraints is known as quadratically constrained linear program (QCLP), which can be solved effectively when the feasible set is convex. Unfortunately, the problem is nonconvex in our formulation due to the presence of Inequality (5). Although solving a QCLP exactly is often difficult, in practical applications there exist many robust algorithms (see, e.g., [2]) for QCLPs, a well-structured subclass of the more general and difficult nonlinear programming.
As for the uneven angle case, solving the area problem for an ordered star graph can be formulated as the following instance of nonlinear programming, in which the angle between c0ciand c0ci⊕1is denoted as θi⊕1 (see Figure 7 (b)):
Minimize z
subject to disin(θi)≥ Ri, disin(θi⊕1)≥ Ri,
d2i + d2i⊕1− 2didi⊕1cos(θi⊕1)≥ (Ri+ Ri⊕1)2, z≥ Ri+ di
for each i∈ {1, 2, ..., n} where z, di, and θi are variables.
The work by Grivet et al. [5] is related to the area problem. Their method of generating balloon drawings with bends on edges involves two stages. The first stage includes three procedures: with the objective of increasing the angular resolution, the first procedure determines the positions of nodes at the lower level (related to their parent); then the second procedure applies either Welzl’s randomized algorithm [17] in expected linear time (average polynomial time) or their proposed linear time heuristics to finding the smallest circle enclosing these nodes with fixed positions; the third procedure determines the positions of bends on edges when considering the layout of the whole tree. Finally, the second stage generates the final layout without edge crossings. Although the first two procedures of their first stage are related to our problem, their objective is still different from ours. As opposed to finding the smallest circle enclosing the nodes with fixed positions (after determining the distance of nodes from their parents) in the first stage of the algorithm in [5], our nonlinear programs are designed for determining both the drawing area size and the distance of each node from the root node simultaneously.
It should be noticed that finding improved solutions for the area problem remains an interesting open question.
6
Applications
In this section, we explain how the balloon drawing can be tailored to cop-ing with the drawcop-ing of a number of graphs of interest in real-world applica-tions. Three applications, namely, sparse graphs, galaxy system, and H-trees, are demonstrated in this section.
6.1
Sparse graph
To draw a sparse graph, a good starting point is to find a spanning tree (serving as the skeleton of the sparse graph) to which the balloon drawing method is applied. Following that, the remaining edges are added to the drawing. By interacting with the user, it becomes easier to come up with a nice drawing with fewer edge crossings.
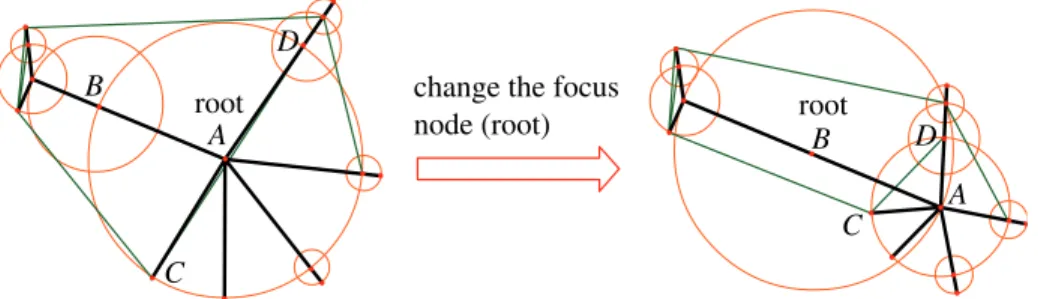
See Figure 8 for example. Consider a graph where the edges of its spanning tree are colored black and the others are colored green. As shown in the left drawing of Figure 8, we suppose that initially the balloon drawing of its spanning tree under the SNS model focuses on node A, i.e., taking node A as the root node to generate the balloon drawing. In the drawing, the green edge CD crosses three edges and almost overlaps with node A, which appears much confused in visualization. By interacting with the user, the focus node may be changed from node A to node B, as shown in the right drawing of Figure 8, which gives a clearer drawing with only one edge crossing.
change the focus
node (root) root
A B C D root A B C D
Figure 8: Interacting with a balloon drawing. The focus node (root) is changed from node A to node B.
6.2
Galaxy system
A galaxy system involves numerous fixed stars, planets, moons, galaxies, and even huge star clusters. Due to universal gravitation, each of the stars has a revolution around (or related to) some star except for binary stars. (If binary stars are viewed as a super node, then the super node also has a revolution around some star.) Therefore stars in a galaxy system form a hierarchical structure, and their revolution orbits are nearly circular and probably concentric circular. The behaviors of stars can therefore be captured by a rooted tree under the balloon drawing, subject to a slight modification which will be explained later. In view of this, our drawing system finds another application in visualizing stars in a galaxy system in the following way.
The center of the universe can be viewed as the root of the galaxy tree. Nova, a new-born star, can be simulated by the operation of adding a node to which a light color is assigned, while a black hole, a dying star, is colored dark which disappears after a period of time. That is, we can use a variety of colors
to display the ages of stars (or distances of stars away from us). When a star or a galaxy dies, the corresponding node (nodes), edge(s), and subtree(s) are deleted.
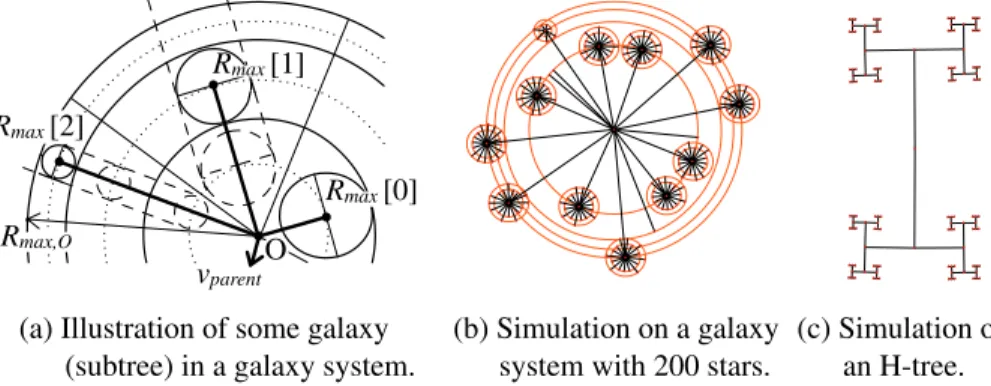
To draw a galaxy system, the style of a balloon drawing has to be altered slightly as Figure 9 (a) indicates. The modification is to reflect the phenomenon of stars rotating around their parent on different orbits. Although the calcu-lation of circumference is the same as originally derived, each node should be placed on its orbit instead of the circumference. Besides, each node needs to record the distance to its parent instead of the radius, and the maximum radius of subtrees on each orbit Rmax[·] also needs to be recorded to compute the radius of each orbit because there probably exist at least two nodes rotating around the same orbit. All of those specific settings can be preprocessed in linear time. Figure 9 (b) is an example of our experimental result.
(b) Simulation on a galaxy system with 200 stars.
(c) Simulation on an H-tree.
vparent
(a) Illustration of some galaxy (subtree) in a galaxy system.
Rmax[2]
Rmax,O
Rmax[0]
Rmax[1]
O
Figure 9: Applications to galaxy systems and H-graphs.
Again, one can see that balloon drawing serves as a foundation upon which an interesting application of visualizing a galaxy system is built. In practice, it is of interest to display galaxy systems with real data.
6.3
H-tree
If we let Rmin be zero in Figure 2 (a) and adjust the angles slightly, then we end up with Figure 9 (c) as the output drawing, which is an example of the so-called H-tree [15].
7
Conclusion
An efficient algorithm for optimizing the angular resolution as well as the aspect ratio of balloon drawings of rooted unordered trees with even angles has been proposed and implemented. As for the case of uneven angle type, the problem of optimizing the angular resolution and the aspect ratio for ordered trees can be solved in O(n1.5log n) time. The problem is open for unordered trees at this moment. Aside from the above theoretical results, we have also shown
how balloon drawing could be tailored to facilitating additional applications, including the drawings of galaxy systems, sparse graphs, and H-trees.
In the future, we intend to take a closer look at the angular resolution and the aspect ratio problems for the uneven angle case, as well as the area problem and its variants. It is also of importance and interest to consider other aesthetic criteria of balloon drawings, especially for minimizing the area or simultaneously optimizing the area and the aspect ratio.
Acknowledgements
The authors thank the anonymous referees for comments that improved the content as well as the presentation of this paper.
References
[1] J. Barnes and P. Hut. A hierarchical O(N log N ) force-cacluation algo-rithm. Nature, 324:446–451, 1986.
[2] D. Bertsekas. Nonlinear programming. Athena Scientific, Belmont, MA, 2nd edition, 1999.
[3] J. Carri`ere and R. Kazman. Research report: Interacting with huge hier-archies: Beyond cone trees. In InfoVis ’95, pages 74–81. IEEE CS Press, 1995.
[4] P. Eades. Drawing free trees. Bulletin of the Institute for Combinatorics and its Applications, pages 10–36, 1992.
[5] S. Grivet, D. Auber, J. Domenger, and G. Melan¸con. Bubble tree drawing algorithm. In Proc. of International Conference on Computer Vision and Graphics 2004, pages 633–641, 2004.
[6] C.-S. Jeong and A. Pang. Reconfigurable disc trees for visualizing large hierarchical information space. In InfoVis ’98, pages 19–25. IEEE CS Press, 1998.
[7] H. Koike and H. Yoshihara. Fractal approaches for visualizing huge hier-archies. In VL ’93, pages 55–60. IEEE CS Press, 1993.
[8] G. Melan¸con and I. Herman. Circular drawing of rooted trees. Technical report, Reports of the Centre for Mathemat-ics and Computer Sciences. Report number INS-9817, available at: http://www.cwi.nl/InfoVis/papers/circular.pdf, 1998.
[9] T. Munzner. H3: Laying out large directed graphs in 3D hyperbolic space. In INFOVIS 1997, pages 2–10. IEEE Press, 1997.
[10] T. Muzner. Drawing large graphs with H3Viewer and site manager. In GD 1998, volume 1547 of LNCS, pages 384–393. Springer, 1998.
[11] T. Muzner and P. Burchard. Visualizing the structure of the world wide web in 3D hyperbolic space. In VRML 1995, pages 33–38. ACM Press, 1995.
[12] C. Papadimitriou and K. Steiglitz. Combinatorial Optimization. Prentice Hall, Englewood Cliffs, New Jersey, 1982.
[13] E. Reingold and J. Tilford. Tidier drawing of trees. IEEE Trans. Software Eng., SE-7(2):223–228, 1981.
[14] G. Robertson, J. Mackinlay, and S. Card. Cone trees: Animated 3D vi-sualizations of hierarchical information. In CHI ’91, pages 189–194. ACM Press, 1991.
[15] Y. Shiloach. Arrangements of planar graphs on the planar lattices. PhD thesis, Weizmann Instite of Science, 1976.
[16] S. T. Teoh and K.-L. Ma. RINGS: A technique for visualizing large hi-erarchies. In GD 2002, volume 2528 of LNCS, pages 268–275. Springer, 2002.
[17] E. Welzl. Smallest enclosing disks (balls and ellipsoids). In H. Maurer, editor, New Results and New Trends in Computer Science, volume 555 of LNCS, pages 359–370. Springer, 1991.