Cas
Fa
se Stud
Gr
Co
actor A
dy of V
Adv
Co-a
raduate
ollege o
I-Sho
MAST
Analysi
ietnam
visor: Je
advisor
e Stude
Dec
of Man
ou Univ
TER T
s of Em
mese En
esse Yu
r: Ngo
ent: Du
cember
nageme
versity
THESIS
mploye
nterpri
u-Chen
Trung
uc Tron
2016
ent
S
ee Loya
ise in H
n Lan
Hoa
ng Nguy
alty:
Ha Noi
uyen
City
A
CKNOWLEDGEMENT
I would like to say thank you to all people who supported me a lot by my master thesis: Ph.D Jesse Yu-Chen Lan
Ph.D Chiao-Ping Bao Prof Chang Wanching
Prof Lê Khắc Đóa Ph.D Nguyễn Quang Vĩnh
Ph.D Ngô Trung Hòa and my family.
A
BSTRACT
In order to retain staff, companies need to identify, consider and evaluate correctly the factors that affect the loyalty of employees. On this basis companies will have the appropriate strategy of human resource management. The objectives of this thesis “Factor Analysis of Employee Loyalty: Case Study of Vietnamese Enterprise in Ha Noi City” are identifying the factors affecting the loyalty of employees and measuring their influence on the loyalty of employees. The research samples are people who are currently working in economic organizations such as limited liability companies, joint-stock companies, private enterprises, state-owned companies, joint ventures, and enterprises with 100 % foreign investment in Hanoi. The results of the multivariate regression analysis indicated that the loyalty of employees was influenced by the six following factors: high income, good working conditions, target fit, management decision, fair reward, and empowerment. In particular, the component “management decision” is the most important influence on the loyalty of employees, followed by target fit, good working conditions, empowerment, fair reward, and finally high income. The T-Test and the ANOVA analysis show that the loyalty of men and women is similar. There are differences in employees’ loyalty between those with college degree and those with university degree and between the group with university degree and postgraduate degree. There are differences in loyalty between employees and team leaders/specialist and between employees and managers. The loyalty of employees working in different types of organizations is not significantly different.
Keywords: Employee Loyalty, Human Resource Management, Vietnamese Enterprise. Hanoi City.
T
ABLE OF
C
ONTENTS
Acknowledgement ... II Abstract ... III Table of Contents ... IV Table of Figures ... VII Table of Tables ... VIII Table of Abbreviations ... IIX
1 Introduction ... 1
1.1 Research background ... 1
1.2 Research objectives ... 1
1.3 Object and scope of the research ... 2
1.4 Research methodology ... 2
1.5 Research significance ... 2
1.6 Structure of the thesis ... 2
1.7 Chapter Summary ... 3
2 Literature Review ... 4
2.1 Theoretical foundations ... 4
2.1.1 Issues of employee loyalty in organizations ... 4
2.1.2 Summary of some previous studies on employee loyalty... 4
2.1.3 The relationships among factors and employee loyally ... 5
2.2 Scale model used in the study ... 8
2.2.1 Scales of independent variables ... 8
2.2.2 Scales of dependent variables ... 9
2.3 Research model ... 10 2.4 Chapter summery ... 11 3 Research Methodology ... 12 3.1 Research design ... 12 3.1.1 Quantitative research ... 12 3.2 Research procedure ... 13
3.2.1 Scale calibration for the questionnaire ... 13
3.2.2 Quantitative analysis procedure ... 13
4 Research Results ... 15
4.1 Summary of the survey results ... 15
4.1.1 Survey results regarding academic degree ... 15
4.1.2 Survey results regarding position ... 16
4.1.3 Survey results regarding organizational form ... 16
4.2 Descriptive Statistics ... 17 4.2.1 Independent variables ... 17 4.2.2 Dependent variables ... 17 4.3 Rating scales ... 18 4.4 Analysis of factors ... 19 4.4.1 Factor analysis ... 19
4.4.2 Factor definition and description ... 20
4.4.3 Result interpretation ... 20
4.5 Adjusted model ... 21
4.6 Model testing ... 21
4.6.1 Pearson correlation coefficient ... 21
4.6.2 Regression analysis ... 22
4.7 Result from hypothesis testing ... 24
4.8 Testing results regarding gender ... 25
4.9 Testing results regarding academic degree ... 25
4.10 Testing results regarding job position ... 26
4.11 Testing results regarding organizational form ... 26
4.12 Chapter summary ... 26
5 Conclusion and Recommendations ... 28
5.1 Research results and research contribution ... 28
5.1.1 Research results ... 28
5.1.2 Research contribution ... 28
5.2 Practical meaning and solutions ... 29
5.2.1 Practical meaning ... 29
5.2.2 Proposal on implementing the research results ... 29
5.3 Limitations ... 31
5.4 Chapter summary ... 31
Reference ... 32
Appendix A: Survey structure ... 35
A.2 Questionnaire structure ... 36
Appendix B: Data Evaluation ... 40
B.1. Factor analysis ... 40
T
ABLE OF
F
IGURES
Figure 1 Research model in this study ... 11 Figure 2 Research design ... 12 Figure 3 Adjusted model ... 21
T
ABLE OF
T
ABLES
Table 1 Survey results regarding gender ... 15
Table 2 Survey results regarding age ... 15
Table 3 Survey results regarding academic degree ... 15
Table 4 Survey results regarding position ... 16
Table 5 Survey results regarding organizational form ... 17
Table 6 Cronbach’s Alpha of the variables ... 19
Table 7 Correlation matrix of variables ... 21
Table 8 R Square ... 22
Table 9 ANOVA analysis ... 22
Table 10 Regression results using ENTER approach ... 23
Table 11 Result from hythothesis testing ... 24
Table 12 KMO and Bartlett's Test ... 40
Table 13 Total Variance Explained ... 40
Table 14 Pattern Matrix ... 41
Table 15 KMO and Bartlett's Test ... 42
Table 16 Total Variance Explained ... 42
Table 17 Pattern Matrix ... 43
Table 18 Variables Entered / Removed ... 43
Table 19 Model Summary ... 44
Table 20 ENOVA ... 44
Table 21 Coefficients ... 44
Table 22 Collinearity Diagnostics ... 44
Table 23 Coefficients ... 45
Table 24 Variables Entered / Removed ... 45
Table 25 Model Summary ... 46
Table 26 ANOVA ... 46
Table 27 Coefficients ... 47
T
ABLE OF
A
BBREVIATIONS
ANOVA Analysis Of Variance
EFA Exploratory factor analysis
HR Human Resource
SPSS Statistical Package for the Social Sciences
1 I
NTRODUCTION
1.1 Research background
Under the harsh market conditions nowadays, “competition for human resources is always a burning issue in companies” as Wallker and Hudson (2012) mentioned. Therefore, “in order to attract talents, companies constantly improve their personnel development policies under which salary bonuses” and many additional employee benefits are especially in the interest of managers.
Human resource management includes many aspects: time recording, payroll, screening, recruiting, training, coaching, performance assessment, drafting of bonus policy, and other employee benefits, etc. But ones of the most important issues that cannot be ignored by human resource (HR) specialists are the planning and implementation of personnel development measures, attracting talents to work for the company and keeping them away from thinking of “standing on one mountain and looking for the other mountain” (Walker & Hudson, 2000).
The problem of how to retain employees is currently a headache for many managers in Vietnamese companies. Especially after joining the WTO, the Vietnamese enterprises have the need to expand their business, globally; therefore, the business survival of these enterprises is depending not only on hiring highly qualified employees but also on keeping them in order to avoid the brain drain. The question is now how to identify, consider and evaluate the factors affecting the employee loyalty correctly, based on which the companies can have an appropriate strategy in human resource management in order to keep the talents and avoid the brain drain phenomenon in the future. This master thesis “Factor Analysis of Employee Loyalty: Case Study of Vietnamese Enterprise in Ha Noi City” is aiming to answer this question.
1.2 Research objectives
The objectives of this master thesis are:
Determining the factors affecting the employee loyalty in today's enterprises. Measuring the impact of several factors on the loyalty of employees.
In addition, this research can also contribute to further similar researches on the loyalty of employees in organizations in order to improve the organizational management or investment strategies.
1.3 Object and scope of the research
Due to the capacity and time constraints, the research is based on surveys of people currently working in enterprises in Hanoi with the following positions: staff, team leaders / specialists, and managers.
1.4 Research methodology
Using of quantitative research method. Factors and measuring attributes are identified based on the measured variables in qualitative research phase. After adjustment the final scale is used for the formal interviews.
Quantitative survey conducted in the region of Hanoi. Sampling subjects are people who are currently working in enterprises in Hanoi. The interviews are conducted via a questionnaire from January to April 2016. The sampling method randomly selects several students at the every class in several universities in Hanoi (University of Economics Hanoi, Hanoi Open University, University of Sciences Hanoi, University of Industry Hanoi, etc.). They are employees during the day time and students in the evening. The measurement model includes 29 observed variables, using 5-level Likert scale range (from 1 “totally disagree” to 5 “completely agree”) to quantify and assume, according to the minimum rules 5 x 3 = 15 for a variable sample measurement (Bentler & Chou, 1987). Therefore the original sample is calculated as: 29 x 15 = 435.
1.5 Research significance
The research findings identify the factors affecting employee loyalty in organizations. On that basis the company could focus on the necessary resources to adjust or develop an appropriate personnel management policy. In addition, incentive systems could be implemented in order to motivate and retain good employees for the organization.
1.6 Structure of the thesis
Chapter 1: Introduce
Content: Reasons for raising topic, research objectives, samples and sample size, research methodology, and the practical meaning of the study.
Chapter 2: Literature review
Content: Theories about the loyalty of employees, components related to the loyalty of employees (higher income, favorable working conditions, suitable target, management support, support from colleagues, reward fairness, empowerment, etc.), and research models. Chapter 3: Research methodology
Content: Details on research methods, results of the qualitative research, scale calibration, sample selection.
Chapter 4: Result and Discussion
Content: Data analysis and presentation of the results of the data analysis. Chapter 5: Conclusions and Suggestions
Content: Summary, discussion on research results as well as the contributions and the practical meaning of the research, proposal of measures to apply the research results into practice, limitations of the research, and suggestion for further studies.
1.7 Chapter Summary
The objectives of this thesis “Factor analysis of the Loyalty of Employees: Case study of Vietnamese Enterprise in Ha Noi City” are identifying the factors affecting the loyalty of employees and measuring their influence on the loyalty of employees. The research is carried out in two phases: qualitative research and quantitative research.
The thesis consists of five chapters: Introduce, Literature review, research methodology, Result and Discussion, Conclusions and Suggestions.
2 L
ITERATURE
R
EVIEW
2.1 Theoretical foundations
2.1.1 Issues of employee loyalty in organizations
In a research on loyalty Auh, S., & Johnson, M. D. (2005) found out that employees’ loyalty was caused more by their job than by “the employers and the nature of the relationship between employees and employers had been fundamental changed therefore the loyalty concept needed to be revaluated (reevaluating loyalty). In the competitive labor market today, many employers find it hard to retain their staff” because of the attractiveness and the potential wealth of the stock market (Cheryl Breetwor 2001).
In Vietnam the appearance of many foreign investors and banks with lack of highly qualified HR since the WTO member in 2007. As Penelope Trunk (2007) “loyalty as a function of time is a dated idea, work is only appealing if there’s constant learning”. However, “companies do not want blind loyalty; the best kind is when both companies and employees are benefiting”. Some general managers said that the organization preferred an excellent employee for three years rather than one low-skilled employee for the whole company life. However, the new perspective on loyalty has not been widespread in Vietnam and enterprises have difficulties in measuring. Therefore, this study is still based on the loyalty definition of Mowday et al (1979) and the measuring scale of Man Power (2002).
2.1.2 Summary of some previous studies on employee loyalty
There are many studies on employee loyalty to organizations, but most previous studies focused on one aspect in general, for example the impact of organizational culture or leadership style on the loyalty of employee. Therefore, there are currently no studies investigating the specific factors affecting employee loyalty. This research will assess the impact of each specific factor such as: high income, good working conditions, target fit, etc. on employee loyalty to the organization.
2.1.3 The relationships among factors and employee loyally
2.1.3.1 High income
Income “can have many different names such as labor remuneration, labor income, etc. In France, the remuneration is construed as wages or basic, minimum salaries and other benefits paid directly or indirectly, in cash or in kind, which the employers pay for workers”. In Taiwan “income is just the remuneration that employees received for their work; it is paid in form of wages, allowances, bonuses or any other words for the performed hours, days, months or products”. In Japan “income, whatever is called salaries, wages, dividends or any other words, is only the labor remuneration that employers pay for workers”.
Remuneration has always been one of the most challenging issues for managers in every organization. Companies often have different opinions and goals while defining the remuneration system, but in general they pursue four basis objectives of: attracting employees, maintaining good employees, motivating employees and fulfilling the legal requirements.
Attracting employees: Companies that pay more are likely to attract good candidates from the local market.
Maintaining good employees: In order to maintain good employees for your business, it is not enough to pay high salaries, companies also need the show the fairness within the organization.
Motivating employees: All the components of employee’s income such as basic salaries, bonuses, benefits, and allowances should be used effectively to generate the highest employee’s motivation.
Fulfilling the legal requirements: The legal requirements “relating to remuneration in enterprises often focus on the following aspects: minimum wages, time and working conditions, child labor, allowances, social welfare such as social insurance, health insurance, maternity, labor accidents, etc.” as Dung (2000) recommended.
When it comes to job and the job quality, Dung (2000) said that most people often assess and measure it “with income that the work brings. Therefore, income is considered as a measure for the job as well as the success of the employee at work”
High income makes people more satisfied materially so that they are more likely to dedicate to the job, focus on the work, and try to prove their own value for the company. Therefore, this large impact on the employee’s behavior is described as follows:
If the income that the employees earn seems to be worthy of their dedication, they will be motivated at work.
They will have little intention of leaving the company for another job and be temporarily satisfied with his current income.
They will feel like having higher responsibilities for the work.
They will be more disciplined in following the organizational rules and work more independently.
Therefore, the first hypothesis is formulated as follows: H1: High income can increase employee loyalty.
2.1.3.2 Good working conditions
Employees are always interested in the working environment because it is related to the personal convenience and it is also the factor that helps them completing the tasks. Employees do not want to have a dangerous, disadvantageous, and inconvenient working environment. “Temperature, lighting, noise, and other environmental factors must be suitable. Moreover, many workers prefer to work closer to home, to have clean working place as well as modern and suitable equipment” as Lam, (1998) required.
The second hypothesis is formulated as follows:
H2: Good working conditions can increase employee loyalty.
2.1.3.3 Target fit
Target fit is described as when the employees realize that their goals and values are suitable and they are committed “to the goals and values of the company” (Vancouver & Schmitt, 1991). The individual-organization fit (target fit) is the most important aspect among all studied factors (Chatman, 1991; Kristof, 1996; Van Vianen, 2000). The target fit is associated with such behavioral results as longer stay in the office, more commitment to the organization, and better job performance (O’Reilly & CTG, 1991; Vancouver & Schmitt, 1991)
H3: The target fit can increase employee loyalty.
2.1.3.4 Management support
The supporting behavior of managers have been focused by many studies (Podsakoff et al, 1996). Management support is defined as “the degree of consideration and help that employees receive from their employers” (Netemeyer et al., 1997). A supportable manager should have a high qualification and treat employees fairly, encourage two-way communication, and recognize their contribution to the achievement of company’s goal (Singh, 2000).
The fourth hypothesis is formulated as follows:
H4: Management support can increase employee loyalty.
2.1.3.5 Support from colleagues
The behavior of managers is also a crucial factor determining employees’ satisfaction. It increases when their managers are knowledgeable and friendly, give praise if they do a good job, listen to their opinions, and care about their interests. (Lam, 1998).
Therefore, the fifth hypothesis is formulated as follows:
H5: Support from colleagues can increase employee loyalty.
2.1.3.6 Fair reward
Fair reward exists when the employees notice they receive a deserved remuneration for their work pressure and performance (Netemeyer & et al, 1997). Fair reward is “based on the concept of fair distribution” as Lane and Messe, (1971) defined. The concept of fairness contains both fair distribution and procedures. Nonetheless, “previous studies indicate that the fair distribution is more important than the fair procedures in a working relationship” (Netemeyer & et al, 1997; Organ, 1988).
Equity theory indicates that each individual follows his own fairness rule affecting his attitude and behavior (Lane & Messe, 1971). This theory shows that fairly rewarded employees are more likely to have positive thinking and willingness to support their organizations.
Based on these arguments the sixth hypothesis is formulated as follows: H6: Fair reward can increase employee loyalty.
2.1.3.7 Empowerment
Empowerment exists when employers believe in the decision-making ability of employees and encourage them to use initiative (Conger & Kanungo, 1998; Hartline et al, 2000). Empowerment means the self-monitoring of tasks (Singh, 2000, Varca, 2001). The core of these both concepts is the willingness of the management to give employees the right to make decisions within a defined frame and use initiative.
Therefore, the seventh hypothesis is formulated as followed: H7: Empowerment can increase employee loyalty.
2.2 Scale model used in the study
The scale model used in this study included the scales of dependent variables and scales of independent variables.
2.2.1 Scales of independent variables
The scales of independent variables consist of following scales:
2.2.1.1 High income variables
High income is measured by the three following observed variables: 1) My current salary is commensurate with my job performance. 2) I am living totally fine with my current salary.
3) I think the company where I am working pays very fairly.
2.2.1.2 Working conditions variables
Good working conditions are measured by the four following observed variables: 1) The supporting equipment for my work is very good.
2) The airy office makes me feel very comfortable.
3) Temperature, lighting, and noise in the office are fit to my work. 4) I feel very safe in my office.
2.2.1.3 Target fit variables
The target fit is measured by the four following observed variables:
2) I am committed to the organization’s objectives. 3) I agree with the way how the business works.
4) My own development goal fits to the organization’s objectives.
2.2.1.4 Management support variables
Management support is measured by the three following observed variables: 1) I always have the support from my direct manager in all areas.
2) My managers always support me when problems arise.
3) I often get the support of the management when things go bad.
2.2.1.5 Support from colleagues variables
Support from colleagues is measured by the two following observed variables:
1) My colleagues always listen to my opinions and concerns and care about my interests. 2) My colleagues are always knowledgeable, friendly and approachable.
3) I and colleagues work effectively together
2.2.1.6 Fair reward variables
Fair reward is measured by the five following observed variables: 1) I got a fair reward according to accomplishing my role. 2) I got a fair reward according to my job responsibilities. 3) I got a fair reward according to my spent efforts. 4) I got a fair reward when working under pressure. 5) I got a fair reward when performing my job well.
2.2.1.7 Empowerment variables
Empowerment is measured by the five following observed variables: 1) Managers assign the work to me and let me do it independently. 2) Managers empower me to decide.
3) Mangers believe in my decision-making ability.
4) Managers encourage me to use the handed decision-making right. 5) Managers believe in my ability to evaluate the working results.
2.2.2 Scales of dependent variables
1) I am happy to introduce people about my company as a good working place. 2) I am proud to introduce people about the products / services of the company.
3) I will stay with the company for the long term despite offers with more attractive salaries elsewhere.
2.3 Research model
The assumptions of the model are formulated as follows:
H1: High income has positive relationship with employee loyalty. H2: Good working has positive relationship with employee loyalty. H3: The target fit has positive relationship with employee loyalty.
H4: Management support has positive relationship with employee loyalty. H5: Support from colleagues has positive relationship with employee loyalty. H6: Fair reward has positive relationship with employee loyalty.
H7: Empowerment has positive relationship with employee loyalty.
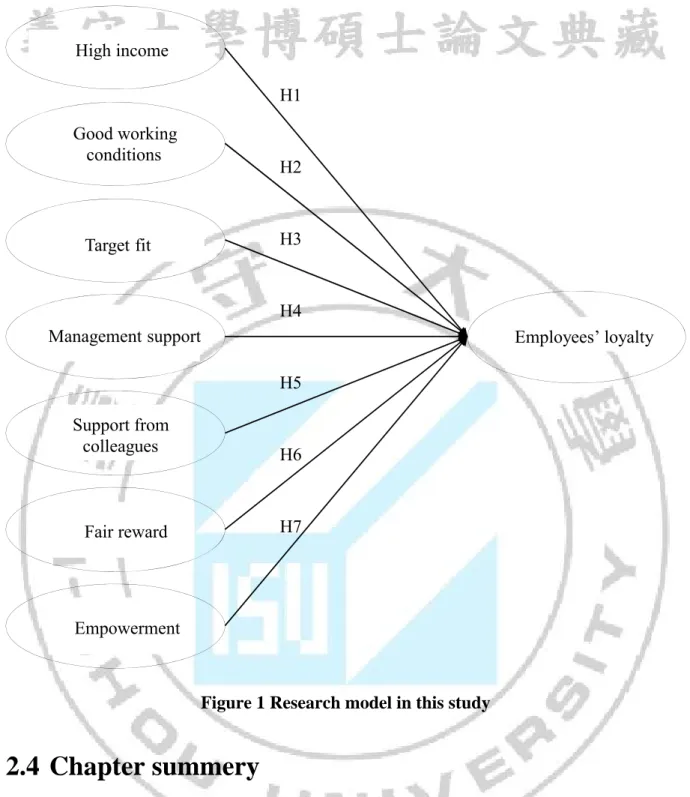
Figure 1 Research model in this study
2.4 Chapter summery
The criteria for evaluating employees’ loyalty include: the willingness to introduce the company as a good working place, the willingness to introduce the company products and services, and the intended long-term commitment to the company.
The research model includes loyalty as the dependent variable and seven independent variables such as high income, good working conditions, target fit, support from managers, and support from colleagues, fair reward, and empowerment.
Target fit Good working conditions Management support High income Employees’ loyalty Support from colleagues Fair reward Empowerment H1 H2 H3 H4 H5 H6 H7
3 R
ESEARCH
M
ETHODOLOGY
3.1 Research design
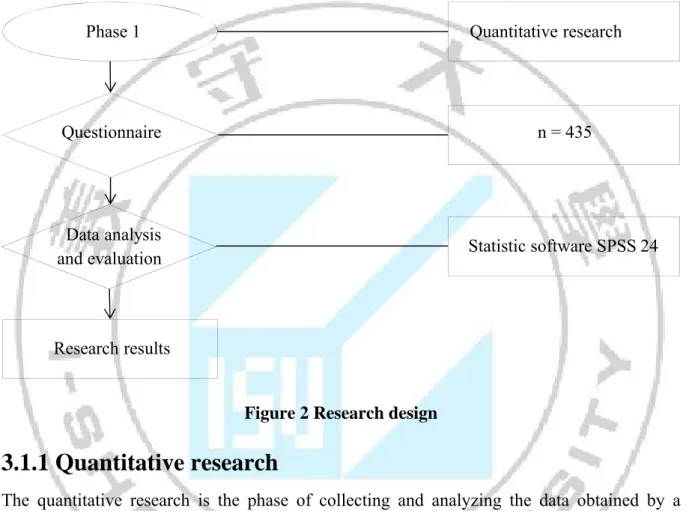
Research will be conducted in two phases of qualitative research and quantitative research which are described in the following flowchart:
Figure 2 Research design
3.1.1 Quantitative research
The quantitative research is the phase of collecting and analyzing the data obtained by a questionnaire. The collected data is analyzed using the SPSS software.
Loyalty = B0 + B1* High income + B2 * Good working conditions + B3 * Target fit + B4 * Management support + B5 * Support from colleagues + B6 * Fair reward + B7 * Empowerment
Then the accreditation of T-Test and ANOVA analysis (Analysis Of Variance) is applied to test the difference among demographic of respondents and company’s loyalty.
Data analysis and evaluation
Questionnaire
Research results
Phase 1 Quantitative research
n = 435
3.2 Research procedure
3.2.1 Scale calibration for the questionnaire
All observed variables are measured through five-point Likert scales containing from 1 “strongly disagree to 5 “strongly agree” with the statement.
3.2.2 Quantitative analysis procedure
a) Sample size
In the model shown above, seven hypothesis and 29 observed variables have been identified using the five-point Likert scales. Therefore, under the minimum rule of: 5 x 3 = 15 samples for a measured variable (Bentle & Chou, 1987), the initial calculated sample size is: 29 x 15 = 435.
b) The sampling
By the random sampling method a number of students at the night classes was randomly selected (in-service, 2nd degrees, master’s degree, etc.) in several universities in Hanoi
c) Results and information about samples
The detailed questionnaires are presented in Appendix A.
There are all 600 questionnaires sent directly to the research objects from January to April 2016. During the survey process some objects do not have a job yet and therefore they leave many fields in the questionnaire blank. All this questionnaires were removed prior to data entry. Therefore, the number of final questionnaires that are recorded for the analysis is only 435, which means 73 % of response rate.
3.2.2.1 Collecting and analyzing data
Using of the statistical analysis software SPSS 24, the testing was conducted on the following steps:
1) Preliminary assessment scale and reliability of measured variables with Cronbach’s Alpha and the factor loading with EFA (Exploratory Factor Analysis),
2) Testing of hypotheses of the structural model and the overall model fit, following by the accreditation of T-Test and ANOVA analysis between different groups with the
components of the structural model which had already been tested in order to find significant differences between specific groups.
3.3 Chapter Summary
The study was conducted in two phases of qualitative research and quantitative research. The qualitative research was conducted in the form of bilateral discussions based on a pre-prepared content and available scales. The discussion will be recorded, summarized and used as a basis for the calibration and supplement of variables.
For the quantitative research data was collected via questionnaires. The collected data was analyzed by the SPSS software. After coding and cleansing the final data evaluation process was conducted as follows: evaluation of the reliability and values of the scales, factor analysis using to test the variance of the variables, testing of hypotheses of the structural model and the overall model fit, and afterwards performing of T-Test and ANOVA analysis (Analysis Of Variance) between different groups.
4 R
ESEARCH
R
ESULTS
4.1 Summary of the survey results
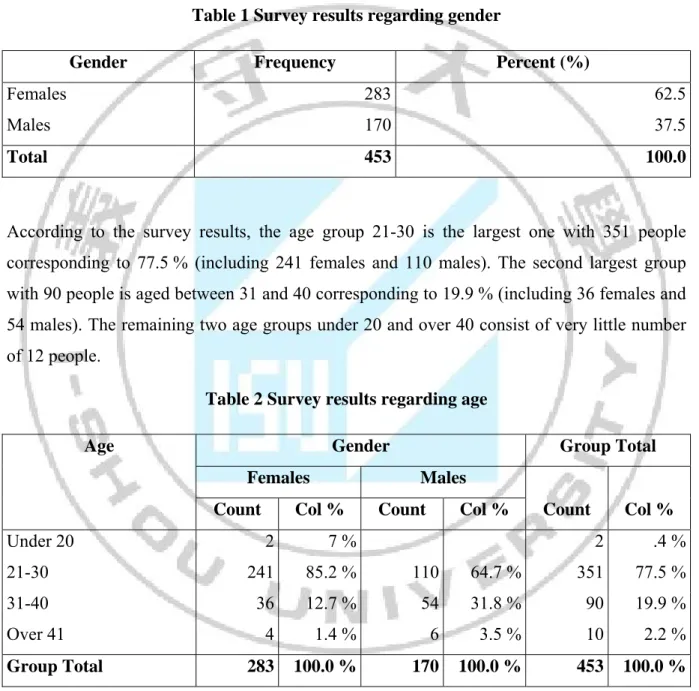
As the result there are 283 respondents is female and male counting for 170. Table 1 shows the result:
Table 1 Survey results regarding gender
Gender Frequency Percent (%)
Females 283 62.5
Males 170 37.5
Total 453 100.0
According to the survey results, the age group 21-30 is the largest one with 351 people corresponding to 77.5 % (including 241 females and 110 males). The second largest group with 90 people is aged between 31 and 40 corresponding to 19.9 % (including 36 females and 54 males). The remaining two age groups under 20 and over 40 consist of very little number of 12 people.
Table 2 Survey results regarding age
Age Gender Group Total
Females Males
Count Col % Count Col % Count Col %
Under 20 2 7 % 2 .4 %
21-30 241 85.2 % 110 64.7 % 351 77.5 %
31-40 36 12.7 % 54 31.8 % 90 19.9 %
Over 41 4 1.4 % 6 3.5 % 10 2.2 %
Group Total 283 100.0 % 170 100.0 % 453 100.0 %
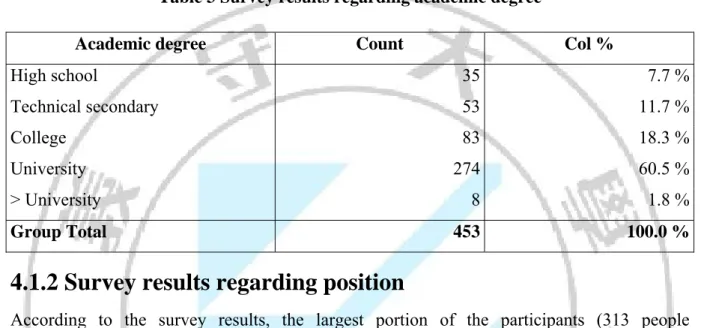
4.1.1 Survey results regarding academic degree
According to the survey results, the largest portion of the participants (274 people corresponding to 60.5 %) has a university degree (including 155 females and 119 males). The
(including 67 females and 16 males), followed by the group of 53 people corresponding to about 11.7% who have a technical secondary school level (thereof 39 females and 14 males). The next group of 35 people corresponding to 7.7 % is those with high school level (thereof 20 females and 15 males). The rest of the participants including 2 females and 6 males are people who have a higher qualification than university degree (total of 8 people corresponding to 1.8 %).
Table 3 Survey results regarding academic degree
Academic degree Count Col %
High school 35 7.7 % Technical secondary 53 11.7 % College 83 18.3 % University 274 60.5 % > University 8 1.8 % Group Total 453 100.0 %
4.1.2 Survey results regarding position
According to the survey results, the largest portion of the participants (313 people corresponding to 69.1 %) are those who are having staff positions (thereof 223 females and 90
males). The second largest group with 84 people corresponding to 18.5 % is having team leader / expert positions (thereof 40 females and 44 males). The rest of the participants (56 people corresponding to 12.4 %, thereof 20 females and 36 males) are holding management positions.
Table 4 Survey results regarding position
Position Count Col %
Staff 313 69.1 %
Team leader / Specialist 84 18.5 %
Manager 56 12.4 %
Group Total 453 100.0 %
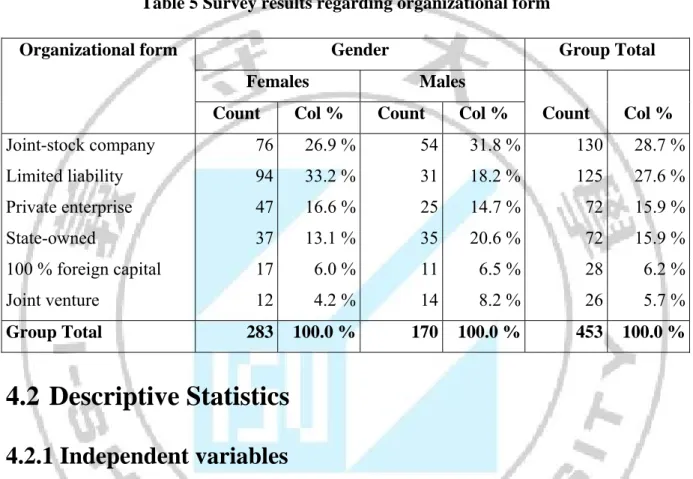
4.1.3 Survey results regarding organizational form
According to the survey results, the largest portion of the participants (130 people corresponding to 28.7 %, thereof 76 females and 54 males) are those who are working for
joint-stock companies, followed by the group working for limited liability companies with 125 people corresponding to 27.6 % (thereof 94 females and 31 males). The numbers of people working for state-owned companies and private enterprises are similar (72 people corresponding to 15.9 %). There are 28 people corresponding to 6.2 % working for enterprises with 100 % foreign capital among the participants. The smallest group with 26 people corresponding to 5.7 % is those who are currently working for joint ventures.
Table 5 Survey results regarding organizational form
Organizational form Gender Group Total
Females Males
Count Col % Count Col % Count Col %
Joint-stock company 76 26.9 % 54 31.8 % 130 28.7 % Limited liability 94 33.2 % 31 18.2 % 125 27.6 % Private enterprise 47 16.6 % 25 14.7 % 72 15.9 % State-owned 37 13.1 % 35 20.6 % 72 15.9 % 100 % foreign capital 17 6.0 % 11 6.5 % 28 6.2 % Joint venture 12 4.2 % 14 8.2 % 26 5.7 % Group Total 283 100.0 % 170 100.0 % 453 100.0 %
4.2 Descriptive Statistics
4.2.1 Independent variables
Statistical results showed that the participants evaluated the statements with all available scores from very low to very high. In other words, some of them totally agreed and other ones completely disagreed with the statements. The reason for it could be that the samples are working in different organizations having different human resource management policies. In general the means of the independent variables differ significantly from each other (from 2.87 to 4.12). It means differences in the assessed levels of importance between the independent variables.
4.2.2 Dependent variables
The observed variables in the scales measuring the employee loyalty Y1 “I am happy to introduce to people about my company as a good working place”, Y2 “I am proud to
introduce to people about the products / services of the company”, and Y3 “I will stay with the company for the long term despite offers with more attractive salaries elsewhere” have relatively high means of 3.72, 3.84, and 3.17). It means that employees are looking forward to working for their company for a long term.
4.3 Rating scales
The scale reliability was assessed by using two tools Cronbach’s Alpha und Factor Analysis. Cronbach’s Alpha coefficients were used in order to disqualify the inappropriate variables which have a low Corrected Item-Total Correlation value (< 0.3) and qualify the scales if thee Cronbach’s Alpha coefficient is high (> 0.6).
Reliability is used to describe the degree of measurement error. Because the coefficient of variation of the correct and error variables cannot be evaluated exactly, therefore the scale reliability cannot be calculated directly. However, the scale reliability can be established based on Cronbach’s Alpha coefficients.
Rating scales of variables
The “High income” variable which has a Cronbach’s Alpha = 0.76 and a Corrected Item-Total Correlation > 0.3 met the requirements in order to continue with the factor analysis. The “Good working conditions” variable with a Cronbach’s Alpha = 0.84 and a Corrected Item-Total Correlation > 0.3 also met the requirements in order to continue with the factor analysis.
The “Target fit” variable which has a Cronbach’s Alpha coefficient = 0.79 and a Corrected Item-Total Correlation > 0.3 met the requirements in order to continue with the factor analysis.
The “Management support” variable with a Cronbach’s Alpha = 0.80 and a Corrected Item-Total Correlation > 0.3 met the requirements in order to continue with the factor analysis. The “Support from colleagues” variable which has a Cronbach’s Alpha = 0.84 and a Corrected Item-Total Correlation are > 0.3 met the requirements in order to continue with the factor analysis.
The “Fair reward” variable with a Cronbach’s Alpha = 0.92 and Corrected Item-Total Correlation > 0.3 met the requirements in order to continue with the factor analysis.
The “Empowerment” variable which has a Cronbach’s Alpha = 0.87 and a Corrected Item-Total Correlation > 0.3 met the requirements in order to continue with the factor analysis.
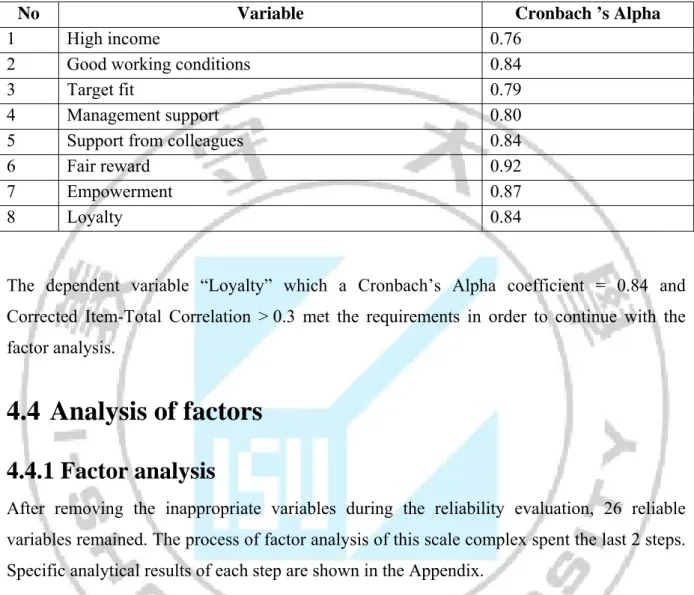
Table 6 Cronbach’s Alpha of the variables
No Variable Cronbach ’s Alpha
1 High income 0.76
2 Good working conditions 0.84
3 Target fit 0.79
4 Management support 0.80
5 Support from colleagues 0.84
6 Fair reward 0.92
7 Empowerment 0.87
8 Loyalty 0.84
The dependent variable “Loyalty” which a Cronbach’s Alpha coefficient = 0.84 and Corrected Item-Total Correlation > 0.3 met the requirements in order to continue with the factor analysis.
4.4 Analysis of factors
4.4.1 Factor analysis
After removing the inappropriate variables during the reliability evaluation, 26 reliable variables remained. The process of factor analysis of this scale complex spent the last 2 steps. Specific analytical results of each step are shown in the Appendix.
Step 1: By analyzing the 27 observed variables, only six factors were qualified until the Eigenvalue became greater than 1. In the table 27 in Appendix B the cumulative % of variance is 68.255 % after six factors indicated that the first six factors explain 68.255 % of the data variability. The KMO coefficient has a value of 0.91 (> 0.5). However, the observed variable Q7.1 was disqualified due to a low factor loading.
Step 2: After removing the observed variable Q7.1, just only the 6 factors were qualified until the Eigenvalue became greater than 1 by analyzing 25 remaining observed variables. In the table 30 in Appendix B the cumulative % of variance increases to 69.38 %. The KMO coefficient has a value of 0.909 (> 0.5). The factor loadings of all observed variables are greater than 0.5.
4.4.2 Factor definition and description
The factor analysis proceeds on the basis of observed variables with a high factor loading on the same factor. Therefore, this factor can be explained by the variables with a high factor loading for itself.
4.4.3 Result interpretation
The results from the factor analysis indicated a model measuring the employee loyalty to the organization as a scale set: high income, good working conditions, target fit, management decision, fair reward, and empowerment.
The observed variables belong to the following components: high income, good working conditions, target fit, fair reward, and empowerment which have high factor loading on a factor as initially expected. It means that these observed variables are strongly correlated with the initial factor.
The factor “management decision” consists of the observed variables belonging to following components: management support and support from colleagues.
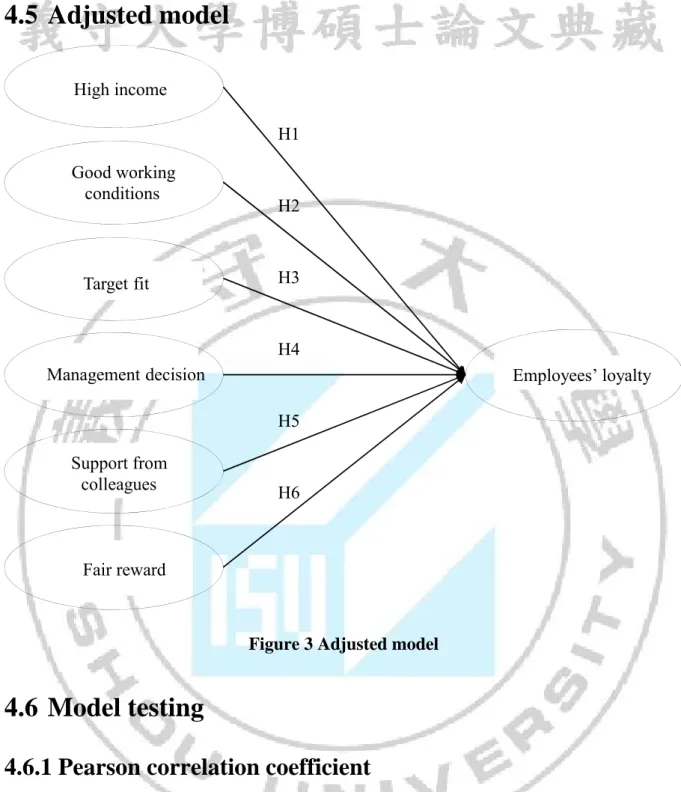
4.5 Adjusted model
Figure 3 Adjusted model
4.6 Model testing
4.6.1 Pearson correlation coefficient
The Pearson correlation coefficients were used to test a “linear relationship between the independent variables and the dependent variable”. If these variables are highly correlated, a probable phenomenon of multicollinearity has to be noted during the regression analysis.
According to the correlation matrix, the variables are correlated and the correlation is significant at the 0.01 level. The correlation coefficients between the dependent variable “employee loyalty” and other independent variables are relatively high, therefore it is possible
to include the independent variables in the model to explain the dependent variable “employee loyalty” (Y). But the correlation coefficients between the independent variables
Target fit Good working conditions Management decision High income Employees’ loyalty Support from colleagues Fair reward H1 H2 H3 H4 H5 H6
range from 0.289 to 0.566. Correspondingly the role of the independent variables has to be in the multiple linear regression models.
Table 7 Correlation matrix of variables
Y Q1 Q2 Q3 Q4 Q5 Q6 Y 1 Q1 .404(**) 1 Q2 .458(**) .369(**) 1 Q3 .571(**) .462(**) .478(**) 1 Q4 .578(**) .564(**) .506(**) .577(**) 1 Q5 .679(**) .462(**) .507(**) .521(**) .571(**) 1 Q6 .583(**) 298(**) .340(**) .564(**) .601(**) .490(**) 1
4.6.2 Regression analysis
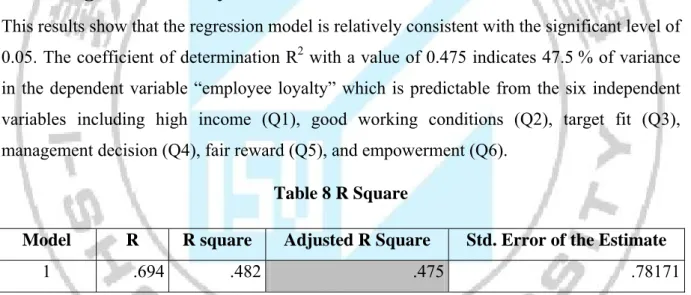
This results show that the regression model is relatively consistent with the significant level of 0.05. The coefficient of determination R2 with a value of 0.475 indicates 47.5 % of variance in the dependent variable “employee loyalty” which is predictable from the six independent variables including high income (Q1), good working conditions (Q2), target fit (Q3), management decision (Q4), fair reward (Q5), and empowerment (Q6).
Table 8 R Square
Model R R square Adjusted R Square Std. Error of the Estimate
1 .694 .482 .475 .78171
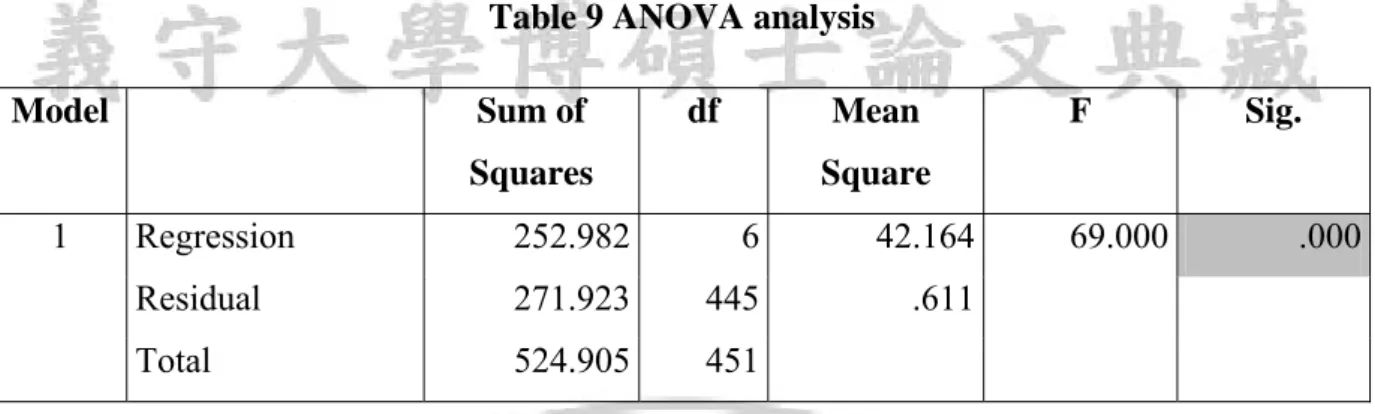
The F-Test which was used in the variance analysis allowed testing the hypothesis regarding the appropriateness of the linear regression model with multiple regressions. The idea was to test a linear relationship between the dependent variable and the independent variables. The ANOVA analysis table indicates a low Sig. value (Sig. = 0.00). It means that the regression model fits the data set and therefore it is useable
Table 9 ANOVA analysis Model Sum of Squares df Mean Square F Sig. 1 Regression 252.982 6 42.164 69.000 .000 Residual 271.923 445 .611 Total 524.905 451
The ANOVA analysis indicates F value of 69 (Sig. = 0.00). The multicollinearity phenomenon does not affect the descriptive results of the model by the highest Variance Inflation Factor (VIF) of each variable of 2.049 (< 10). The rule is that a multicollinearity phenomenon exists if the VIF is over 10 (Trong & Ngoc, 2005).
The regression equation showing the relationship between employee loyalty to the organization (Y) and the independent variables including high income (Q1), good working
conditions (Q2), target fit (Q3), management decision (Q4), fair reward (Q5), and empowerment (Q6) is formulated by the following expression:
Loyalty = 0.099 * High income + 0.127 * Good working conditions + 0.226 * Target fit + 0.239 * Management decision + 0.118 * Fair reward + 0.115 * Empowerment
Table 10 Regression results using ENTER approach Unstandardized
Coefficients
Standardized Coefficients
t Sig. Collinearity Statistics
B Std. Error
Beta Tolerance VIF
(Constant) -0.14 .187 -.067 .935 income .096 .042 .099 2.332 .019 .679 1.472 conditions .134 .043 .127 3.098 .002 .696 1.437 target .272 .055 .226 4.936 .000 .557 1.796 management .285 .056 .239 5.131 .000 .537 1.861 reward .115 .047 .118 2.419 .016 .488 2.049 empowerment .119 .044 .115 2.703 .007 .643 1.555
4.7 Result from hypothesis testing
Hypothesis of the model:
Table 11 Result from hythothesis testing
No Hypothesis Result
H1 High income can increase loyalty. Supported H2 Good working conditions can increase loyalty. Supported H3 Target fit can increase loyalty. Supported H4 Management decision can increase loyalty. Supported H5 Fair reward can increase loyalty. Supported H6 Empowerment can increase loyalty. Supported
The “high income” component is a one-dimensional quality attribute so that the higher the better. If employees earn an appropriate according to their qualification and they think that this income is fair for their job position, they will feel more satisfied. Besides, if the salary they get can cover the cost of living, they will feel more relaxed, focus on the job and therefore they will be more loyal to the organization.
The “good working conditions” component is a factor reflecting a part of the working environment. If employees work in an environment with full facilities, convenience as well as comfortable, airy, clean and quiet atmosphere and especially if they always feel safe at the working place, they will feel more relaxed and their trust will increase.
If the own development objective of the employees is closer to the development goals of the organization, their loyalty to the organization will increase. However, it is expected that the development goals of both are increasing over time with possibly different growth rates. The management decision is a factor showing the working behavior of managers toward their staff. A working environment where managers are always ready to support their staff as required will create a kind of comfort for employees. Besides, a close relationship between employer and employee, where the manager always supports the employees psychologically at work and outside of work, will make employees have more trust in the management and the organization. Therefore they will be more loyal to their current organization.
Fair reward is still the basic factor affecting the loyalty of employees. If workers are confident that they are receiving the appropriate reward and remuneration according to their effort, they will maintain a high level of motivation and might have a long-term commitment to the organization.
For the empowerment, if employees receive certain powers to do the job, they will be more active in their job. It will not only improve the creativeness of the staff but also reflect the trust of the managers in the working capacity of their employees. Since then employees will feel more satisfied with the management style and be more interested in the current job so that they will be more loyal to their organization.
4.8 Testing results regarding gender
The independent-samples T-Test indicated the difference in loyalty between females and males. According to the result of Levene’s Test Sig. is higher than 0.05 (Sig. = 0.611), the variance between males and females did not differ. The T-Test results using the Equal variances assumed showed Sig. > 0.05 (Sig. = 0.592). Therefore there is no significant mean difference between females and males. Based on these results it can be concluded that the loyalty of men and women to the organization is similar.
4.9 Testing results regarding academic degree
The Analysis of Variance ANOVA was used to test the difference in loyalty of employees between different academic degrees. According to the results of the test of homogeneity of variances, the significance level Sig. = 0.166 indicated that there was no statistically significant difference in variances between the academic groups. Therefore, the results of the ANOVA analysis were useable.
According to the ANOVA analysis, a significance level Sig. < 0.05 (Sig. = 0.00) showed that there was a difference in employee loyalty between different academic groups at a statistical significance level. It was recommended to review the results of the ANOVA analysis in details in order to find out the differences between the groups.
According to the detailed results there is a statistically significant difference between the groups with college and university degree (Sig. = 0.001), and between the groups with university and postgraduate degree (Sig. = 0.043), because the significant level Sig. of each pair is lower than 0.05. Therefore, it can be concluded that the loyalty of those with university qualification differs from those with college degree, and the loyalty of those with university qualification is different from those with postgraduate degree.
4.10 Testing results regarding job position
The ANOVA analysis was carried out in order to test the difference in the employee loyalty between different job positions. According to the results of the test of homogeneity of variances, the significance level Sig. = 0.81 indicated that there was no statistically significant difference in variances between job positions. Therefore, the results of the ANOVA analysis were useable.
According to the ANOVA analysis, a significance level Sig. < 0.05 (Sig. = 0.003) showed that there was a difference in employee loyalty between different job positions at a statistical significance level. It was recommended to review the results of the ANOVA analysis in details in order to find out the differences between these groups.
According to the detailed results there is a statistically significant difference between the groups of employees and team leader / specialists (Sig. = 0.025), and between the employee and management group (Sig. = 0.02), because the significant level Sig. of each pair is lower than 0.05. Therefore, it can be concluded that the loyalty of employees differs from team leaders and specialists, and also from those with management position.
4.11 Testing results regarding organizational form
The ANOVA analysis was used to test the difference in employee loyalty between different types of organization. According to the results of the test of homogeneity of variances, the significance level Sig. = 0.153 indicated that there was no statistically significant difference in variances between organizational forms. Therefore, the results of the ANOVA analysis were useable.
According to ANOVA analysis, a significant level of Sig. > 0.05 (sig = 0.183) meant that there was no statistically significant difference in employee loyalty between all types of organization. Therefore, it can be concluded that the loyalty of employees working in different organizational forms is similar.
4.12 Chapter summary
This chapter presents the analysis results which can be summarized as follows:
After measuring the reliability of scales by using Cronbach’s Alpha coefficients and factor analysis after removing inappropriate variables, six factors were included in the adjusted
model including following factors: high income, good working conditions, target fit, management decision, fair reward, and empowerment.
The multivariate regression analysis and hypothesis testing of the model confirmed the hypothesis formulated above: the employees’ loyalty is influenced by six factors including high income, good working conditions, target fit, management decision, fair reward, and empowerment.
The T-Test and the ANOVA analysis showed following results. The loyalty of females and males is not significantly different.
5 C
ONCLUSION AND
R
ECOMMENDATIONS
5.1 Research results and research contribution
5.1.1 Research results
The results of the multivariate regression analysis indicated that the loyalty of employees was influenced by the six following factors: high income, good working conditions, target fit, management decision, fair reward, and empowerment. In particular, the component “management decision” is the most important influence on the loyalty of employees, followed by target fit, good working conditions, empowerment, fair reward, and finally high income. The T-Test and the ANOVA analysis show the following results. The loyalty of men and women is similar. There are differences in employees’ loyalty between those with college degree and those with university degree and between the group with university degree and postgraduate degree. There are differences in loyalty between employees and team leaders / specialist and between employees and managers. The loyalty of employees working in different types of organizations is not significantly different.
5.1.2 Research contribution
Competition is increasingly fierce on the market nowadays. In order to survive and grow on this competitive market, companies have to be well prepared in many aspects such as capital, reputation, physical facility and most importantly human resources. It is important to develop a human resource management policy in order to retain highly qualified staff and attract talents. As a consequence the employees will bring many new ideas for problem solving, they will be loyal to the organization which might increase the company revenue and reduce significant costs of replacing staff.
If the human resource management policy is developed on the basis of the actual situation, it will be objective and highly feasible. The scope of this research was to identify the factors affecting the loyalty of employees. Based on these research results the organization can adjust
the human resource management policy accordingly. If employees are loyal to the organization, they will wholeheartedly focus on their job and contribute to build up the company. As result of this, organizations can provide a positive working environment and a healthy competition among employees. Consequently they can reduce the costs of recruiting
and training new employees. In addition, employees will tend to over fulfill customers’ requirements and give their best at work. Both characteristics are very important for the company to retain loyal customers and generate higher revenues.
5.2 Practical meaning and solutions
5.2.1 Practical meaning
Results from T-Test showed that the loyalty of employees is not significantly different between males and females.
The ANOVA analysis showed that there was a significant difference in loyalty between people with college degree and those with university degree as well as between people with university qualification and those with postgraduate degree.
According to the results from the ANOVA analysis the loyalty to the organization of people working as employees is significantly different from the loyalty of those with team leader / specialist or management position, while those working as team leaders / specialists and those working in management positions have no significantly difference in loyalty.
The results from the ANOVA analysis also showed that loyalty of employees working in different organizational forms was not significantly different.
These results might help managers to develop an appropriate human resource management policy. The employees’ loyalty will generate more revenues and reduced costs significantly.
5.2.2 Proposal on implementing the research results
First, companies should build a competitive salary system based on organizational types and
activities. The salaries appropriately in order to improve living standards of their employees. In addition, companies need to build a fair, uniform, and clear salary system in
order to avoid completely different payroll schemes between new and old employees within an origination. Fairness is reflected in group fairness and individual fairness for the same companies need to evaluate their employees correctly, pay according to their ability and their working efficiency under their own working conditions and circumstances.
Second, companies should provide an ideal working environment to their employees including fresh, clean, and bright working place, suitable temperature, tools, equipment, etc. Especially it is important to create a working environment in which all employees feel safe.
Third, companies need to develop a concrete and clear target system which is transparent for all employees. It is important for the employees to achieve the goals together with the company. In addition, companies should implement different measures to guide employees towards corporate objectives defined.
Fourth, managers must show concern and support their staff which is for employees very important. A good manager must know how to make use of the full potential of energy and enthusiasm of the staff. Besides technical skills, managers also need a good reputation of showing empathy and understanding the needs of their employees. HR managers should regularly consult their staff about the way how they solve the problems raised at work, update them on sales figures so that they can feel the relationship between what they are doing and the results that the company is achieving. Employees will feel appreciated and believe that they are contributing a certain part to the development of the company. Besides giving attention and respecting employees, HR managers should organize entertaining activities at work in order to create a friendly environment so that people can laugh in the office as well as take the time to learn a little more about families and private lives of their colleagues. And not only those working in HR departments should be equipped with the necessary HR management knowledge and skills, but also all managers and department heads in general should do HR management activities within their power, in order to motivate their subordinates to achieve common goals together.
Fifth, the enterprise must evaluate employees’ performance objectively in order to ensure a fair reward according to their achievement. Companies need to develop an appropriate system of income distribution and promotion to make employees more satisfied. An income distribution and promotion system will be considered as fair if it is based on the task demand, personal skills, and wishes of the employees.
Sixth, last but not least, organizations should develop a trustful relationship between both sides. Employees need the appreciation and respect from managers expressed through empowering and giving the opportunities for studying, learning, and contributing to the overall success of the company independently. Managers need to empower their employees according to their weaknesses as well as strengths and teach them the required skills. They should understand the job requirements in order to give the power to the right employee. In many cases the task can be completed more efficiently when more than one employee works at the same time. Managers should be aware that empowerment could entail certain risks.
They could receive undesired results but need to accept these results and also the mistakes occurred.
5.3 Limitations
This research is limited by the methods of data analysis. The multiple regression analysis was used to determine the relationship between the independent variables (high income, good working conditions, target fit, management decision, fair reward, and empowerment) and the dependent variable “loyalty”. However, this analysis did not identify the relationship between the independent variables themselves so that the results might not reflect the accurate interdependencies between these factors.
5.4 Chapter summary
This chapter summarizes the research findings, the practical meaning of the study, and the proposals on implementing the research results. This chapter also mentioned the limitations of the research and recommendations of subsequent research.
R
EFERENCE
Auh, S. & Johnson, M. D. (2005). Compatibility effects in evaluations of satisfaction and loyalty. Journal of Economic Psychology, 26(1), 35-57.
Bentler, P.M. & Chou, C. (1987). Practical issues in structural modeling. Sociological
Methods and Research, 16, 78-117.
Bui, N. H. & Nguyen, T. Q. L. (2004). Quản lý chất lượng [Quality Management]. Ho Chi Minh: Vietnam National University Press.
Chatman, J. (1991). Matching people and organizations: Selection and socialization in public accounting firms. Administrative Science Quarterly, 36, 459-484.
Cheryl Breetwor (2001). Employee Loyalty: An Interview with Cheryl Breetwor. Issues in
Ethics - V. 12, N. 1 Spring 2001.
Conger, J.A and Kanungo R.N. (1988). The Empowerment Process: Integrating Theory and Practice. Academy of Management Review, 13 (July): 471-482.
Guidestar Research (2005), Driving Employee Satisfaction, Commitment and Loyalty. Hair, F. J., Anderson, E. R., Tatham, L. R. & Black, C. W. (1992). Multivariate Data
Analysis. Macmillan Publishing Company.
Hartline, D. M., Maxham, G. J & McKee, O. D. (2000). Corridors of Influence in the
Dissemination of Customer Oriented Strategy to Customer Contact Service Employees.
Journal of Marketing, 64 (April): 35-50.
Hoang, T. & Chu, N. M. N. (2005), Phân tích dữ liệu nghiên cứu với SPSS [Statistical Data Analysis with SPSS]. Ha Noi: Statistical Publishing House.
Hersey, P. & Blanchard, K. (2001), Quản trị hành vi tổ chức [Organizational Behavior Management]. Ha Noi: Statistical Publishing House.
Kristof, A. L. (1996). Person-organization fit: An integrative review of its conceptualizations, measurement, and implications. Personnel Psychology, 49, 1-49.
Lane, I. M. & Messe, L. A. (1971). Equity and the distribution of rewards. Journal of
Personality and Social Psychology, 20(1), 1-17.
Leedy, D. P. & Ormrod, E. J. (2005). Practical Research. Pearson Education, Inc. Man Power Inc. (2002), International Loyalty Survey.
Mowday, R. T., Porter, L. W. & Steers, R. M. (1979). The Measurement of organizational commitment. Journal of Vocational Behavior, 14, 224-227.
Netemeyer, R. G., Boles, J.S., McKee, D.O. & McMurrian, R. An investigation into the antecedents of organizational citizenship behaviors in a personal selling context. Journal
of Marketing, 61, 85-98.
Nguyen, H. L. (1998), Hành vi tổ chức [Organizational Behavior]. Ha Noi: Education Publishing House.
Nguyen D. T. & Nguyen T. M. T. (2007), Nghiên cứu thị trường [Market Research]. Ho Chi Minh: Vietnam National University Press.
O'Reilly, C. A., Chatman, J. A. & Caldwell, D. F. (1991). People and Organizational Culture: A Profile Comparison Approach to assessing Person-Organization Fit.
Academy of Management Journal, 34, 487-516.
Organ, D. W. (1988). Organizational citizenship behavior: The good soldier syndrome. Lexington (MA): Lexington Books.
Podsakoff, P. M., MacKenzie, S. B. & Bommer, W. H. (1996). Transformational leader behaviors and substitutes for leadership as determinants of employee satisfaction, commitment, trust, and organizational citizenship behaviors. Journal of Management,
22(2), 259-298.
Singh, J. (2000). Performance Productivity and Quality of Frontline Employees in Service Organizations. Journal of Marketing, 64, No. 2, 15-34.
Trunk, P. (2007). Employee loyalty isn’t gone it’s just different. Retrieved April 29th, 2007, from http://blog.penelopetrunk.com/2007/04/29/employee-loyalty-isnt-gone-its-just-different.
Tran, K. D. (2000), Quản trị nguồn nhân lực [Human Resource Management]. Ho Chi Minh: Vietnam National University Press.
Vancouver, J. B. & Schmitt, N. (1991). An exploratory examination of person-organization fit: organizational goal congruence. Personnel Psychology, 44(2), 333-352.
Varca, P. E. (2001). Service representatives, job control, and white-collar blues. Journal of
Services Marketing, 15(4), 257-269.
Van Vianen, A. E. M. (2000). Person-Organization Fit: The Match between Newcomers’ and Recruiters’ Preferences for Organizational Cultures. Personnel Psychology, 53, 113-149. Vo, V. H. (1997), Ứng dụng SPSS for Windows [SPSS Applications for Windows. Ho Chi
A
PPENDIX
A:
S
URVEY STRUCTURE
A.1 Interview structure
Dear Sir or Madam,
I am Duc Trong Nguyen, master student at the I-Shou University. Currently I am working on my master’s thesis on the topic “Factors affecting the loyalty of employees in originations”. I would appreciate if you could spend your precious time for a bilateral discussion. The aim of the discussion will be to find out the factors that have impact on the employees’ loyalty. Content for interview with managers
1) What is the relationship between the employee’s loyalty and revenues as well as costs of the company in your opinion?
2) What are factors affecting the employees’ loyalty in your opinion? Why? (suggestion for scales)
3) Which factor is most important and which is less important in your opinion?
4) Which other factors affect the employees’ loyalty in addition to the factors mentioned before? Why?
Content for interview with employees
1) What are factors affecting the employees’ loyalty in your opinion? Why? (suggestion for scales)
2) Which factor is most important in your opinion? Why? 3) What is your essential factor for working in this company?
4) If you were the HR manager, what would you change in order to make your employee more loyal to the company?
Ending
A.2 Questionnaire structure
Dear Sir or Madam,
I am working on a research on human resource management. I would appreciate if you could spend your precious time for filling out this questionnaire.
Please (mark with a) cross “X” on the appropriate box to what extent do you agree or disagree with the following statement.
The scores for the agreement level are defined as followed: 1) Strongly disagree
2) Disagree
3) Neither agree nor disagree 4) Agree
5) Strongly agree
Thank you for your time. Sincerely yours,
Factors affecting the employees’ loyalty
High income Level of agreement
My current salary is commensurate with my job performance. 1 2 3 4 5 I am living totally fine with my current salary. 1 2 3 4 5 I think the company where I am working pays very fairly. 1 2 3 4 5
Good working conditions Level of agreement The supporting equipment for my work is very good. 1 2 3 4 5 The airy office makes me feel very comfortable. 1 2 3 4 5 Temperature, lighting, and noise in the office are fit to my work. 1 2 3 4 5
I feel very safe in my office. 1 2 3 4 5
Target fit Level of agreement
I feel that my personal ability is in line with the job requirements of the organization.
1 2 3 4 5
I am committed to the organization’s objectives. 1 2 3 4 5 I agree with the way how the business works. 1 2 3 4 5 My own development goal is fit to the organization’s objectives. 1 2 3 4 5
Management support Level of agreement
I always have the support from my direct manager in all areas. 1 2 3 4 5 My managers always support me when problems arise. 1 2 3 4 5 I often get the support of the management when things go bad. 1 2 3 4 5
Support from colleagues Level of agreement My managers always listen to my opinions and concerns and care
about my interests.
1 2 3 4 5
Fair reward Level of agreement I got a fair reward according to accomplishing my role. 1 2 3 4 5 I got a fair reward according to my job responsibilities. 1 2 3 4 5 I got a fair reward according to my spent efforts. 1 2 3 4 5 I got a fair reward when working under pressure. 1 2 3 4 5 I got a fair reward when performing my job well. 1 2 3 4 5
Empowerment Level of agreement
Managers assign the work to me and let me do it independently. 1 2 3 4 5
Managers empower me to decide. 1 2 3 4 5
Mangers believe in my decision-making ability. 1 2 3 4 5 Managers encourage me to use the handed decision-making right. 1 2 3 4 5 Managers believe in my ability to evaluate the working results. 1 2 3 4 5
Loyalty Level of agreement
I am happy to introduce to people about my company as a good working place.
1 2 3 4 5
I am proud to introduce to people about the products / services of the company.
1 2 3 4 5
I will stay with the company for the long term despite offers with more attractive salaries elsewhere.