INFRARED
JOINING
OF TiAl INTERMETALLICS
USING
Ti-15Cu-15Ni
FOIL-II.
THE MICROSTRUCTURAL
EVOLUTION
AT HIGH
TEMPERATURE
S. J. LEE’, S. K. WU’ and R. Y. LIN”
‘Institute of Materials Science and Engineering, National Taiwan University, Taipei, Taiwan 106, Republic of China and ‘Department of Materials Science and Engineering, University of Cincinnati,
Cincinnati, OH 45221, U.S.A.
(Received 4 April 1997; accepted 25 July 1997)
Abstract-The microstructural evolution of TiAl joint during infrared joining at 1150°C under different holding times using Ti-lSCu_lSNi foil as brazing filler metal was investigated. Based on the observed microstructures, a five-step microstructural evolution mechanism at 1150°C joining temperature is proposed in this study. These time-dependent evolution steps including (a) P-Ti layer formation, (b) columnar a + /3 two-phase zone formation, (c) cla-phase nucleation, (d) high Al% a-phase formation and (e) a*-phase inte- gration, are consistent with the multiphase diffusion theories in solid-state systems. Since different joining temperatures (r,,.) have different corresponding ternary isotherms and stable phases, small variations of T, can result in significant changes of the microstructural morphologies, especially concerning the microstruc- tural evolution of zones of a*- and the high Al% u-phases. The mechanism proposed in this study has pre- dicted such evolutions, which agree well with observed microstructures. All the observed microstructures at ambient temperatures can be clearly elucidated by this proposed mechanism. 0 1998 Acta Metallurgica
1. INTRODUCTION
With their many outstanding properties, titanium- aluminides have a high potential to become one of the important high-temperature structural materials. However, appropriate joining techniques are indis- pensable for the full utilization of these materials due to their low ductility and poor formability at ambient temperatures. Several joining techniques, including welding [l-3], diffusion-bonding [46] and infrared joining [7,8] have been applied in order to develop a suitable process for joining titanium-alu- minides. Infrared joining was adopted in this study mainly due to its sensitive thermal response and its rapid, simple and economical advantages [7].
In Part I of this study [9], we used the TiLAl- Ni(Cu) pseudo-ternary diffusion-path diagrams to discuss the observed multilayered structures includ- ing the high-temperature phase(s) of each layer and the phase-transformation of each phase during rapid cooling. Based on the results of Part I, the multilayered interfacial microstructure was mainly formed by the atomic interdiffusion at high joining temperature T,, which included the primary isother- mal solidification of new solid layers and the fol- lowing solid-state interdiffusion between these layers and the base metal. Due to the solid-state interdiffusion, the multilayered interfacial structure had formed at T,, and then it phase-transformed to the room-temperature microstructures during rapid cooling. The successively inward diffusion of Al
atoms was found to be the main controlling factor. As to the microstructural evolution, however, why or how these multilayered structures evolved at T,
has still not been clarified. In Part II of this study, we focus our investigation on the time-dependent microstructural evolution at 1150°C and the differ- ent T,v effects on this evolution. Because of the sen- sitive response of infrared joining, the microstructural evolution of the joint interface can be effectively realized.
2. EXPERIMENTAL PROCEDURES
In order to investigate the time-dependent micro- structural evolution, four infrared joining con- ditions were carried out at T,,,= 1150°C with different holding time, t,. They are (l)##l:
t,= 18 s, (2)##2: t,= 30 s, (3)##3: t, =42 s and (4)##4: t, = 60 s. Here, T, and t, are infrared join- ing temperature and time, respectively, as shown in Fig. 1 of Part I of this study [9]. Material prep- aration procedures. the joining configurations and the treatments afterwards are in the same manner as described in the Part I of this study [9]. The real holding times for samples ##l - ##4 were 4, 16, 28 and 46 s, respectively.
The microstructural evolution analyses are based on the acquired room-temperature interfacial struc- tural of samples ##l - ##4. As mentioned in Section 4.2 of Part I [9], the acquired 1150°C diffu- sion-path profiles do not come across any Ni(Cu)-
1298 LEE et al.: INFRARED JOINING OF TiAl INTERMETALLICS PART II
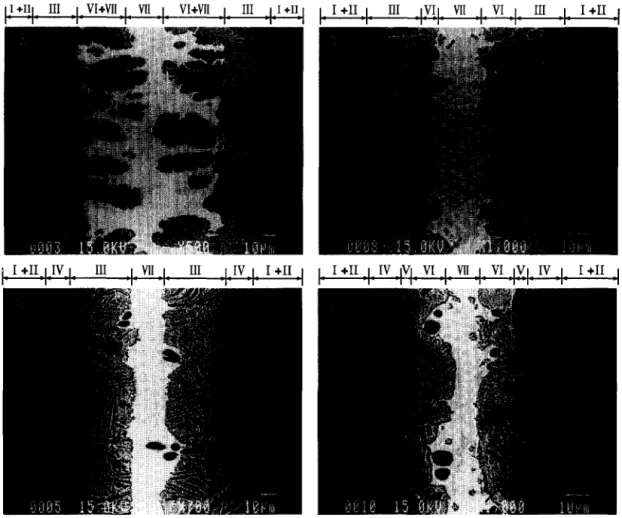
k I +II_I_Iv_I_ III _I. VII _I_ III _I_IV_(_ I +I1 4 I- ‘I’ I. -1. I- -1.
Fig. 1. The back-scattering electron images (BEIs) of four joint interfaces which are joined atT,=1150”Cwith(a)t,=18s,(b)t,=30s,(c)t,=42sand(d)t,=60s.
base solid phase on the 1150°C Ti-Al-Ni(Cu) tern- ary isotherm. All the white precipitates in the joint interfaces are merely formed by the cooling phase transformation. The zone having a similar mor- phology in the joint interface is regarded as a single-phase region at T, (the characteristic zones shown in Part I of this study [9]), thus the high-tem- perature phases in the joined interface can be ap- proximately estimated. Therefore, joint interfacial microstructures varying with different tw’s can be generalized. At the same time, a high-temperature microstructural evolution mechanism with several time-dependent steps can be proposed and discussed by the multiphase diffusion theories in solid-state interdiffusion systems [lO_121. The analyses of join- ing temperature effects are based on this evolution mechanism. By adding the possible thermodynamic effects of T, on this mechanism, the time-dependent microstructural evolution at different T, can also be clearly elucidated. The experimental results of this paper will also be compared with the observed microstructures of samples joined at 1100°C x 30 s and 1200°C x 30 s.
3. EXPERIMENTAL RESULTS
Figure l(a) - (d) show the back-scattering images
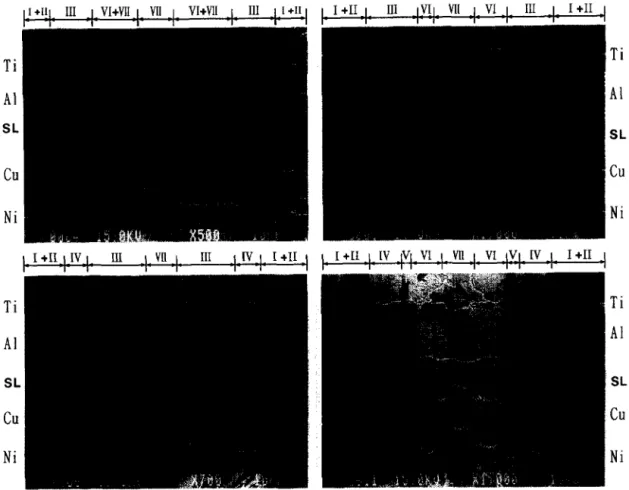
(BEIs) of joint interfaces for specimens ##l - ##4 joined at T,= 1150°C with t,= 18 s, 30 s, 42 s and 60 s, respectively. Figure 2(a)-(d) are the second- ary electron images (SEIs) with Ti, Al, Cu and Ni line scanning profiles (LSPs) for samples ##l - ##4 of Fig. 1, respectively. All joint interfaces show typical multilayered structures and Cu and Ni atoms are mainly concentrated in the central region.
In Figs 1 and 2, I - VII express the seven charac- teristic interfacial zones, as mentioned in Section 3.2 of Part I of this study [9]. Before cooling, their corresponding high-temperature phases are y-TiAl (Zones I & II), a + b mixed two-phase (Zone III), high Al% cc-phase (Zone IV), c+Ti3A1 (Zone V), /?- Ti (Zone VI) and the residual liquid filler metal (Zone VII), respectively. These relationships
between the high-temperature phases and the
observed zones are the basis of our discussions in Section 4.1 of this paper.
Ni
Ti
SL cu
Ni
b I+II_I.Iv 1. III + VII 1, III
I- -I I- I t- IV.\. I +II 4 -I-
Al
SL cuNi
Ti
Al
SL cuNi
Fig. 2. The secondary electron images (SEIs) with Ti, Al. Cu and Ni LSPs, from top to bottom, of four joint interfaces which are joined at rW, = 115f.K with (a) t, = I8 s. (b) t, = 30 s. (c) t,, = 42 s and (d)
t, = 60 s.
Figure 2 clearly shows several abrupt drops on the LSP curves of Cu and Ni atoms, as indicated by arrows in Figs 2(b), (c) and (d), when the scanning line (SL) crosses the regions of black x-base phases. According to the multiphase diffusion theories [lo- 121 in a diffusion couple system, all elements must simultaneously diffuse upon their own activity gradi- ent which is the real driving force behind the interdif- fusion of each element. In order to keep the necessary driving force for further interdiffusion, all the activity (a) profiles for elements must continu- ously vary from one side to another side. Therefore. these abrupt drops of composition (C) imply that Ni(Cu) atoms have a higher activity coefficient(p) in the black a-base phase than in the /J-Ti region due to the fact that a = Cx y. The different activity nature of specific atoms in different phases also has a great influence on the microstructural evolution, as will be discussed in Section 4.12.
4. DISCUSSIONS
4.1. The microstructural evolution of the iqfrared joint intevfuce at T,, = 1150°C
Based on the observed microstructures of Figs 1
and 2, a five-step mechanism of the microstructural
evolution of the infrared joint interface at 1150°C is proposed, as schematically plotted in Fig. 3(a) - (e). According to the observed microstructures and the processing time variation, this five-step mechanism includes (a) P-Ti layer formation, (b) columnar x + /r two-phase zone formation, (c) az-phase nucleation, (d) high Al% a-phase forming and (e) x2-phase integration. Before further discussion of these steps of microstructural evolution, it is worthy to note that, due to the local equilibrium require- ment. all the evolved phases must be the stable ones at TW, as seen from the 1150°C Ti-AllNi(Cu) pseudo-ternary diffusion-path isotherm of Fig. 4 and the Ti-Al binary diagram of Fig. 5.
Figure 4 is a 1150°C Ti-Al-Ni(Cu) pseudo-tern- ary isotherm in which the compositional loci of joint interfaces of samples ##2 and ##4 are both
plotted. The phases indicated on the Ti-Al and Ti- Ni(Cu) abscissas correspond to the phases on the reported 1150°C isotherm in the Ti-Al [13,14] and in the TiiNi [15] binary phase diagram, respect- ively. The proposed compositional regions of the evolved stable phases are also indicated in Fig. 4, which are based on the reported Ti-Al-Ni ternary 115O’C isotherm [16] and are a modified isotherm according to the acquired diffusion path diagrams
1300 LEE et al.: INFRARED JOINING OF TiAl INTERMETALLICS PART II
Ia)
r (a+8lr) Cd) (alr) (4 Ti 10 20@-Ti @-Ti+L L (liquid) Lfsl 81 81 +L
I I I I II
Fig. 4. The 1150°C Ti-Al-Ni(Cu) pseudo-ternary diffu- sion-path isotherm in which the compositional loci of joint interfaces of samples ##2 and ##4 are both plotted. A and B indicate the composition loci of the original base metal
and filler metal, respectively.
whose analytic results are shown in Part I of this study [9]. Except for the area near the j/L interface, all compositional loci in Fig. 4 are concentrated and continuously vary in their own single-phase regions. This feature is consistent with the rules of solid-state multiphase diffusion theories [lo-121 and implies that their corresponding zones are formed by the solid-state interdiffusion. It was observed that Zone VI (fl-Ti) of sample ##2 near the j/L interface has some compositional loci located out- side its 1150°C single-phase region. Because the atomic diffusivity in the liquid is rather fast, the cooling solidification effects may occur and affect
30 35 40 46 53 5.5
at.% Al ‘IX-Al PHASE DIAGRAM
Fig. 5. The central portion of Ti-Al binary phase Fig. 3. The schematic profiles showing the proposed five- diagram [13,14]. The gray shadow area indicates the inter- step microstructural evolution mechanism of infrared joint ested region involved in this study. The black shadow area interface at r, = 1150°C. (a) u (e) are the five time-depen- and A T are the high Al% cc-phase and the supercooling
phase diagram [13,14], in which the gray shadow area is the region involved in this study. The black shadow area shows the high Al% a-phase domain and A T represents the supercooling of ~2 phase at a specific T,. They will be further discussed in the following sections.
4.1.1. Step (1): The /I-Ti layer formation. At the beginning of infrared joining at 115O”C, due to the successively inward diffusion of Al atom from the TiAl base metal, one new solid layer (primary layer) will be formed on the liquid/solid (L/S) inter- face by the isothermal solidification, as shown in Fig. 3(a). From the diffusion-path diagrams as shown in Fig. 4, this primary layer should be the fi- Ti phase. This isothermally solidified P-Ti phase is the base of the following solid-state interdiffusion. When the fl-Ti layer has formed on the L/S inter- face and grown into the liquid filler metal, there is a solid/solid (p/v) interface near the base-metal. Therefore, the solid-state interdiffusion occurs and then the secondary solid phase (cc-Ti) and other new phases will be successively formed from this P/r interface.
At the onset of isothermal solidification, the L/S interface is unstable due to the rapid atomic inter- diffusion rates and the dissolution effects of base metal. Therefore, for a short t,, the joint interface shows a wide L + /? two-phase zone having a columnar L//I, as shown in Figs l(a) and 3(a). While for longer t,, the L/b interface will succes- sively move inward and gradually become a planar one which is a more stable interface based on the surface energy lowering principle, as shown in Fig. l(c) and (d).
4.1.2. Step (21: The columnar M + /3 two-phase
zone formation. As more Al diffuses in, the a-Ti phase starts to isothermally nucleate and grow on the fib/ interface, as predicted in Fig. 4. Initially, a columnar c( + p two-phase zone will be formed, as shown in Fig. 3(b). This phenomena is produced by the isothermal j-Ti -+ a-Ti interfacial reaction. As shown in Fig. 3(b), in u + p two-phase zone, the black columns indicate the Al-rich cc-Ti phase and the areas between them are the Ni(Cu)-rich /?-Ti regions. Because the Al atom is a cr-Ti stabilizer but Cu and Ni atoms are /I-Ti ones [ 171, the resultant interfacial morphology should have a typical two- phase mixed structure composed of cc-stabilized a-Ti and P-stabilized b-Ti regions. This type of elemental partition phenomenon is usually found in some commercial Ti-alloys, such as the Ti-6242 alloy [18], especially when its microstructure is formed by a slower cooling rate during the /%Ti + x-Ti cooling phase-transformation [ 171.
The CI + p two-phase morphology is allowed in a ternary or quaternary interdiffusion system due to
produced when a diffusion path passes through a two-phase region from a single-phase one at an angle to the tie lines but then exits into another phase. Thus, at the onset of the isothermal fl- Ti + z-Ti interfacial reaction, it is believed that the interfacial diffusion-path, which is determined by the nature of elements, will take an angle to the tie lines when it passes through the a + fi two-phase region. Therefore, from the viewpoint of local equi- librium, the compositional loci of z-Ti and /3-Ti phase will vary along their individual two-phase boundary, respectively, as shown in the diffusion- path diagram of sample ##2 in Fig. 4. By this way, a columnar c( + fl two-phase zone will be formed at the joint interface.
As mentioned in Section 3, because Ni(Cu) atoms have a higher activity coefficient in the a-phase than in the /?-phase, Ni(Cu) atoms will be expelled from the growing r-Ti regions. This feature will make Ni(Cu) atoms outwardly diffuse mainly along the /- phase areas and let the cr-Ti prefer to grow on the tips of the already formed a-Ti columns. At the same time, Ni(Cu) atoms will be concentrated on the /+Ti areas. Then, the elemental partition phenomena occurs and a typical r* + /3 two-phase mixed zone is formed, as shown in Fig. 3(b). This CI + fi two-phase zone will continue to grow until it completely fills the primary P-layer or until it meets some effective diffusion barriers, such as the x2- layer forming at the joint interface.
The above analyses are based on the ideal case in which no lateral diffusion occurs and all c+Ti col- umns are equal in size on the cross-sectioned plane. However, some lateral diffusion which is unavoid- able in real cases will occur and cause the diffusion direction not to be completely perpendicular to the original joint surface. Thus, a rather ragged mor- phology of joint interfaces is produced, as shown in Figs 1 and 2. By inclining a small angle to the cross-sectioned plane of Fig. 3(b) and adding some lateral diffusion effects to it, a microstructural mor- phology similar to Fig. l(b) can be obtained. Therefore, Fig. 3(b) is a schematic representation of the high-temperature state of sample ##2 as it was joined at 1150°C x 30 s.
Although the real holding time of sample ##l was only about 4 s, Fig. l(a) shows that the colum- nar c( + p two-phase zone has already formed. This implies that the cc-Ti phase or the columnar x + b two-phase zone could form almost simultaneously with the primary p-Ti layer. In addition, the iso- thermal solidification of step (1) might have hap- pened during the heating stage due to the lower heating rate [19] at the end of the heating stage, as shown in Fig. 1 of Part I of this study [9]. Therefore, Fig. l(a) shows a combined microstruc-
1302 LEE et al.: INFRARED JOINING OF TiAl INTERMETALLICS PART II
ture of Fig. 3(a) and (b), and it is the real micro- structure of the joint interface for short t,.
4.1.3. Step (3): The a2-phase nucleation. The next step concerns the isothermal transformation of CI + c12 phase, as shown in Fig. 3(c). Now, let us consider an imaginary plane parallel to the original joint surface having an Al content of about 30
at.%. This plane, called “the P plane”,t is the most suitable place for the x2 phase nucleation, as evalu- ated from the Ti-Al binary phase diagram and the acquired diffusion-path diagrams. Due to the suc- cessive inward diffusion of Al atoms, the P plane will gradually move away from the base metal inter- face. When the moving P plane passes through the already formed columnar t( + b region, the original columnar cr-Ti phase would transform to an a2 phase due to the similarity in composition and hex- agonal-base structure between tl and ~2 phases.
As will be discussed in Section 4.2, the driving force of the c( -+ CI~ transformation is small at T,= 115O”C, thus it needs time to push out the dissolved excess Ni(Cu) atoms from the a-phase to form an ordered ~12 structure. The lower the joining temperature, the higher the driving force and thus the shorter the needed nucleation time is. This time- dependent isothermal nucleation, called the delayed nucleation [12], will keep the a2-layer from forming on the P plane when the time is short. In other words, the nucleation and growth of the crz-phase on the P plane not only need proper Al contents but also require sufficient incubation time. Therefore, if the P plane moves slowly, such as when T, is lower; or if t, is longer enough to pro- vide a sufficient incubation time, the x2-phase can form at the P plane. The former case involves the temperature effects that will be discussed in Section 4.2, and the latter one to be in Section 4.1.5. In step (3) at T,= 115O”C, we suggest that the P plane still moves with a rather high velocity because the Al inward diffusion rate is fast. This is due to the large Al compositional gradient that exists. Therefore, the a2-phase nucleated along the moving P plane can not easily grow to integrate into a con- tinuous layer due to the lack of incubation time, as shown in Fig. 3(c).
During the process in which columnar c+Ti iso- thermally transform to ~(2, the /I-Ti of M + fi region located between the P plane and the base metal must also simultaneously change its phase. From the Ti-Al-Ni ternary 1150°C isotherm [16] and the acquired 1150°C diffusion-path diagrams (Fig. 4) the maximum Al content of the stable /3-Ti phase is
tStrictly speaking, from the micro-viewpoint, the ima- ginary P plane should not form a straight line parallel to the base metal interface when it passed through the a + p two-phase zone. This is because the concentrations of Al in CI and p are different to begin with and the Al diffusion rates in c( and /I would be different due to their structural difference.
about 25at.% Al. However, these /3-Ti regions located between the P plane and the base-metal have the Al% 2 30at.%. This feature will make these high Al-content p regions become unstable and transform to other stable phases, as shown in Fig. 3(c). They will be further discussed in the next section.
4.1.4. Step (4): The high Al% u-phase formation. Once the P plane continuously moves further away from the base-metal interface, the Al content of the layer between P plane and the base-metal interface should be higher than 30%. Under this circum- stance, the cc-phase will form again in this layer due to the high Al content, as seen from Figs 4 and 5. This new a-phase, called the “high Al% a-phase” in Fig. 3(d), is distinguishable from the former cr-Ti phase of Fig. 3(b). This high Al% cc-phase can dis- solve more Ni(Cu) atoms than the ordered CI~- phase, thus it can gradually replace the isother- mally-produced c12-phase near the base metal side to form a continuous zone. The cz2-phase becomes more unstable when it is closer to the high Al% tl- phase zone due to the higher Al content and the lat- eral diffusion of Ni(Cu) atoms. Therefore, the iso- thermally columnar a2-phase nearest the high Al% a-phase side will gradually vanish, as shown in Fig. 3(d).
It is believed that the transformed /?-areas have the same transformation sequence as in step (2). First, they will be separated into several smaller high Al% CY and p regions by their high Al and Ni(Cu) contents and lateral diffusion. As the Al atoms continuously diffuse into these fi-Ti regions, the high Al% cc-phase regions become wider and wider and then they are integrated together, as shown in Fig. 3(d). Comparing Fig. 3(d) with Fig. 2(c), we can see that both of them are consist- ent. Therefore, Fig. 3(d) is the high-temperature state of the sample joined at 1150°C with t, being about 42 s.
4.1.5. Step (5): The cc2-phase integration. For a long holding time, the cz2-phase will gradually grown and integrate into a continuous layer, as shown in Fig. 3(e). This feature is produced by the following phenomena in the case of a long t, speci- men. For the long holding time t,, the Al content in liquid filler metal will gradually increase, and the Al compositional gradient between the base metal and liquid phase will successively decrease. This means that the forward diffusion rate of Al atoms decreases and the atomic lateral diffusion becomes more important. At the same time, the P plane moves with a slower velocity and the az-phase has enough incubation time to nucleate and grow. Finally, the cr2-phase integrates into a continuous layer.
When the uz-phase grows and moves inward, the Ni(Cu) atoms will be more and more segregated in the residual liquid phase because their outward dif- fusion needs a larger and larger driving force, as
Ni(Cu) atoms will be further decreased if the hold- ing time is prolonged. During the formation of CQ- phase layer, a large region of the high Al% a-phase will simultaneously appear, as mentioned in Section 4.1.4, and the interface between them will gradually become a planar one. At the same time, a P-Ti zone will be formed due to the lateral diffusion of Ni(Cu) atoms in the region nearby the filler-metal side of the original CI + fl zone, as shown in Fig. 3(e) in the case of the long t, specimen. Clearly, Fig. 3(e) is in good agreement with the observed microstructure of Fig. l(d) joined at 1150°C x 60 s. It must be pointed out that Fig. 3 aims to explain the samples joined at T, = 1150°C only. For different T,, the mechanism of Fig. 3 must be appropriately modified, as will be discussed in Section 4.2.
4.2. The eflkts of’ joining temperature T,,. on the microstructural evolution
In Part I of this study [9], it has been shown that the joining temperature T, significantly influences the microstructures of the joint interfaces. For different T,, the corresponding ternary isotherm and stable phases are different, therefore, small vari- ation of T, can result in significant changes of the microstructural morphologies. From the Ti-Al binary phase diagram of Fig. 5, there is a “high Al% r-phase” +a*-Ti3A1 + y-TiAl eutectoid reac- tion at 1125”C, and the congruent temperature of the a*-phase is about 1200°C. Obviously, both CI~- and high Al% a-phases are stable on the 1150°C isotherm. However, the high Al% cc-phase is absent on the 1100°C isotherm and the a2-phase is unstable on or above the 1200°C isotherm. This feature elu- cidates the reason why the observed microstructures of samples joined at 1100, 1150 and 1200°C show distinct interfacial morphologies.
In this study, different T, temperatures play the major role in the microstructural evolution of Zones IV (high Al% a-phase) and V (a2-layer) which can be explained by the degree of a2-phase supercooling A T. A T is defined as the temperature difference between the joining temperature T, and the congruent temperature of the x2 phase, as shown in Fig. 5. A T is related to the driving force for the r-Ti + ~~ isothermal phase transformation at T,.T Because the congruent temperature of the rs-phase is about 12OO”C, thus AT’s for all joining conditions in this study are quite small. This leads to the small driving force of c( + z2 transformation
tThe true driving force is AG = (AH/T,)A T, if not
considering interfacial energy. Here, the AH is the
enthalpy of c( -+ z2 transformation at T,,,.
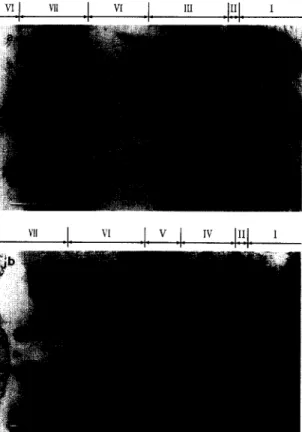
Fig. 6. The SEM interfacial microstructure of specimen joined at IlOO”C x 30 s. I- VII express the seven charac-
teristic interfacial zones as discussed in the text.
and the az-phase needs some incubation time to nucleate and grow, as mentioned in Section 4.1.3. The larger the supercooling of A T, the greater the driving force and the shorter the needed incubation time will be for the z2 phase to nucleate from the c1- phase. thus, the faster the continuous a2-layer can be formed in the joint interface. For example, the sample joined at 1100°C for 30 s having A T = 100°C shows a continuous x2 layer in its joint interface. as shown in Fig. 6. While samples joined at 115O’C having A T = 50°C show Zone III (no a2-layer forms) with holding 30 s and Zone V
Fig. 7. The SEM interfacial microstructures of specimens joined at T, = 1150°C with (a) t, = 30 s (sample ##2) and
1304 LEE et al.: INFRARED JOINING OF TiAl INTERMETALLICS PART II (discontinuous cc*-layer) with holding 60 s, as shown
in Fig. 7(a) and (b), respectively. The sample joined at 1200°C for 30 s having A T = 0 shows a wide Zone III without an c+layer being observed, as shown in Fig. 8.
Concerning the effects of different T,,, on Zone IV, we must consider whether or not the high Al% cc-phase exists between a2-T&Al and y-TiAl phases on the T, isotherm. As mentioned above, from Fig. 5 of the binary Ti-AI phase diagram, the high Al% x-phase exists on the 1150 and 1200°C iso- therms, but it is absent on the 1100°C one. In ad- dition, the disordered a-phase can dissolve more Ni(Cu) atoms than the ordered LYE structure, this solubility characteristic also has a great effect on the room temperature microstructures of Zone IV. For example Zone IV of the specimen joined at 1150°C for 60 s [Fig. 7(b)] is formed because a high Al% a-phase exists at T,, and has a medium A T
and a long t,. Specimens joined at 1100°C (Fig. 6) can form an a2-layer more easily than specimens joined at 1150°C (Fig. 7) due to its larger A T.
However, it is difficult for Zone IV to become a homogenized single-phase region before cooling due to the absence of high Al% cc-phase at t, = 1100°C.
Therefore, Zone IV of the sample joined at 1100°C for 30 s is composed of black cl2 columns trans- formed from the original columnar cz-Ti and several discontinuous precipitates transformed from the re- sidual parts of the original /-Ti areas in x + fl region. These residual precipitates, called the X- phase as mentioned in Part I of this study [9], do not readily vanish because the a2 columns will have only small solubility of Ni(Cu) atoms. Thus, Zone IV of Fig. 6 reveals rather rare and coarse discon- tinuous precipitates after cooling. Although the spe- cimen joined at 1200°C has a high Al% cc-phase at T,, its near-zero A T makes the formation of the cc2-layer more difficult at the joint interface. Therefore, the observed microstructure of the sample joined at 1200°C for 30 s shows a wide columnar two-phase structure of Zone III, instead of Zone IV, as shown in Fig. 8.
Fig. 8. The SEM interfacial microstructure of specimen joined at 1200°C x 30 s.
Certainly, some well-known kinetic effects of T,
will still act on microstructural evolution, such as the relative diffusivities of elements. The higher the joining temperature, the faster the atomic interdiffu- sion rate and the higher the moving P plane velocity will be. Therefore, for specimens joined at the higher T, with a similar t,, the entire reacting solid-state layer is thicker and formation of the x2- layer is more difficult. This diffusivity effect can clearly be seen from the observed microstructures of Figs 6, 7(a) and 8, but this effect seems relatively less important in this study.
As mentioned above, the different T,,, mainly affects the kinds of stable phases and the stability of the individual phase in each joining condition. Compared with the proposed 1150°C microstruc- tural evolution mechanism of Fig. 3, the 1100°C one lacks step (4) due to the absence of the high Al% cc-phase. Thus, its evolved microstructure shows a continuous @z-layer and the columnar a2+X two-phase mixed morphology. On the other hand, the 1200°C one lacks step (3) and step (5) because the x2-phase is unstable, thus its joint inter- face shows a wide columnar CI + p two-phase struc- ture.
5. CONCLUSIONS
The microstructural evolution of TiAl joint inter- faces using Ti-15Cu-15Ni foil as brazing filler metal were investigated during infrared joining at 1150°C under different holding times. Because of the sensitive responses of infrared joining, the microstructural evolution of joint interfaces can be effectively realized. In order to clarify how or why the observed multilayered structures formed, a five-
step microstructural evolution mechanism at
1150°C joining temperature is proposed in this study. These time-dependent evolution steps, which are based on the observed microstructures, include (a) /?-Ti layer formation, (b) columnar tl + /3 two- phase zone formation, (c) cr2-phase nucleation, (d) high Al% a-phase formation and (e) cc2-phase inte- gration. These steps are consistent with the multi- phase diffusion theories in solid-state systems. These features support the primary viewpoint of this study that the acquired multilayered structures have formed before cooling due to isothermal soli- dification and thereafter solid-state interdiffusion. The different joining temperature (Tw) effects are also investigated in this study. According to the proposed evolution mechanism, the different T,
mainly affects the kinds of stable phases and the stability of individual phases in each joining con- dition. Because different joining temperatures, T,, have different corresponding ternary isotherms and stable phases, small variation of T, can result in significant changes of the microstructural mor- phologies. The microstructural evolution of zones of CI~- and high Al% cc-phases can be explained by
ous q-layer can be formed in the joint interface. 8. The proposed microstructural evolution mechanism of this study can clearly elucidate the observed 9. interfacial microstructures at ambient temperatures. 10.
Acknowledgements-The authors sincerely acknowledge 11. the financial support of this research by the National 12. Science Council (NSC), Republic of China, by the Grant
NSC82-0405-E002-402. 13. 1. 2. 3. 4. 5. 6. REFERENCES 14.
Patterson, R. A., Martin, P. L., Damkroger, B. K. 15. and Christodoulou, L., Welding Journal, 1990, 69, 39s. Baeslack, I. I. I. W. A., Mascorella, T. J. and Kelly,
T. J., Welding J.. 1989, 68, 483s. 16.
Mallory. L. C., Baeslack, I. I. I. W. A. and Phillips, D., J. Mater. Sci. Lett., 1994, 13, 1061. 17. Nakao, Y., Shinozaki, K. and Hamada, M., ISIJ In?.,
1991, 31, 1260. 18.
Yan, P. and Wallach, E. R., Intermetallics, 1993, 1, 83.
McCullough, C., Valencia, J. J., Levi, C. G. and Mehrabian, R., Acta metall. mater., 1989, 37. 1321. Murray, J. L.. in Binary Alloy Phase Diagrams, ed. T. B. Massalski, J. L. Murray, L. H. Bennelt and H. Baker. ASM, Metal Park, OH. 1986, p. 1763. Lee, K. J. and Nash. P.. J. af Phase Equilibria. 1991, 12, 551.
Callings, E. W.. The Physical Metallurgy of‘ Titanium Alloys ASM, Metal Park, OH. 1984. p. 390. Gegel. H. L., in The Physical Metallurgy of Titanium Alloys. ed. E. W. Colhngs. ASM. Metal Park OH, 1984, p. 65.
Cam, G., Bohm, K.-H.. Mullauer, J. and Kocak, M., 19. Zhou, Y., Gale, W. F. and North, T. H., Int. Mater.
J.O.M., 1996, 48, 68. Rev., 1995, 40, 181.
Blue, C. A., Blue, R. A. and Lin. R. Y.. Scripta metall. mater.. 1995, 32, 127..
Lee, S. J.. Wu. S. K. and Lin. R. Y.. Acta mater, 1998, 46, 1283.
Reed-Hill, R. E., Physical MetaIlurgy Principles 2nd edn. Van Nostrand, Princeton, NJ. 1973. p. 559. van Loo, F. J. J., Prog. Solid. St. Chern., 1990, 20, 47. Kirkaldy. J. S., Dtjj‘iision in the Condensed Stnte Institute of Metals, London. 1987, p, 361.
Kim, Y.-W. and Dimiduk, D. M., J.O.M., 1991. 43. 40.