Low Power Consumption Design of Micro-machined
Thermal Sensor for Portable Spirometer
Nan-Fu Chiu1, Tzu-Chien Hsiao3,4and Chii-Wann Lin1,2* 1
Institute of Electrical Engineering, National Taiwan University Taipei, Taiwan 106, R.O.C.
2
Institute of Biomedical Engineering, National Taiwan University Taipei, Taiwan 106, R.O.C.
3
Biomedical Research & Development, Hsinchin Biomedical Science Park National Taiwan University
Taipei, Taiwan 106, R.O.C. 4
Department of Biomedical Engineering, I-Shou University Taiwan 840, R.O.C.
Abstract
There are great needs for a low cost and low power consumption portable spirometer for the home care of respiratory diseases. Thermal anemometer has the advantage of possible miniaturization by modern microfabrication processes. However, its optimal design remains to be a technical challenge for the trade off between required sensitivity and power consumption. The designed features of such a sensor include low thermal conduction via substrate, wide dynamic range (0~180 L/Min) to cover high peak flow rate and possible low cost mass production. To meet these requirements, we used both surface and bulk micromachining techniques to fabricate the sensor for optimal performance. Testing of constructed prototype showed that it can be used under low operating voltage of 3 volts. According to the American Thoracic Society (ATS) guidance for the measurement of pulmonary functions, including dynamic volume offorced expiratory vital capacity (FVC) andflow during forced expiration:peak expiratory flow rate (PEFR), it has necessary accuracy (£ 3% variation) for diagnosis requirements.
Key Words: Thermal Anemometeric Chip, Portable Spirometer, ATS, FVC, PEFR
1. Introduction
In the United States, there are estimated 16 million adults with chronic obstructive pulmonary diseases (COPDs) and another 17 million suffer from asthma and children account for 4.8 million of the group. Although asthma deaths are infrequent, it has increased significantly during the last two decades. It claims more than 5,000 lives due to asthma alone each year in the United States [1,2]. The measurement of static and dynamic respiratory functions provides important indexes for diagnosis of asthma and COPD. A spirometer can measure the flow or volume of gas moving into and out of the lungs during inspiratory and expiratory cycles. It becomes a need for
home-care personalized devices due to the increasing number of respiratory related diseases. The efforts to pro-vide a portable, user-friendly and accurate electronic spirometer have resulted in many new developments in both flow sensors and systems [3,4]. In the past, we have reported a simple flow sensor of 1.2 kW impedance, which required higher operating voltage (~10 V) to get stable output signal. It was found that the sensor tem-perature is around 120 °C [5,6]. It thus requires new de-sign and fabrication processes to meet the low power consumption requirement. In this paper, we report the development of a micro-machined thermal anemometer and a portable microsystem for home care uses. The testing results of the constructed prototype according to the guidelines of related recommendations and stan-dards are also discussed.
2. Materials and Methods
A lot of current respiratory indexes are based on the measurement of volume, e.g. tidal volume, inspiratory/ expiratory volume, and dead space volume. It is rather difficult to miniaturize this type of instrument. Alterna-tively, one can measure flow rate with known orifice ge-ometry and then do the time integral to get the total vol-ume, which opens up possible technology innovations for mininaturization. One of the available operating prin-ciples for flow measurement is thermal anemometry [7,8]. It measures the total heat loss of a heating element and correlates the output signal to the flow rate of the fluid. It normally operates in one of three modes: con-stant current, concon-stant temperature, or concon-stant power. With the available micro-machined techniques, perfor-mance/cost ratio can be further enhanced with possible standard mass production and on board CMOS circuitry for nonlinear compensation [9,10].
2.1 Principle of Thermal Anemometers
Heat loss or gain can occur through an element of the building sensor by three primary mechanisms: 1) con-duction, 2) convection, 3) radiation. In heat transfer sen-sors, a known temperature difference, is maintained be-tween the hot part and cold part of the sensor. This ther-mal energy will transfer to the cold part by means of the following paths with losses rate, i.e., natural convection rate (Q’NC), forced convection rate (Q’FC), thermal
con-duction rate (Q’C) and thermal radiation losses rate (Q’R).
The total heating power p during thermal equilibrium should be equal to the summation of possible heat dissi-pation pathways as shown in the Figure 1 and expressed as in the following equation.
(1)
It must be noted that when the structure is small enough, radiation and natural convection losses are neg-ligible for most of the operating conditions. However, the conduction and forced convection heat loss can be large, so that Eq. (1) can be reduced and expressed as Eq. (2), where Gair and Gsidenote geometry factors of the
heat transfer pathways through the air and the substrate membrane, andlairandlsidenote the thermal
conductiv-ity of the air and substrate membrane, respectively. To optimize the sensor performance for higher sensitivity and lower power consumption, one can maximize Q’FC
for better sensitivity and minimize Q’Cfor lower power
consumption [4,11,12].
(2)
(3)
(4)
In the Eqs. (3) and (4), for a one dimensional, steady state heat flow the dissipitation rate is expressed by Fou-rier’s equation, where S is contact area, Tsis sensor
tem-perature, Tais ambient temperature, k is thermal
conduc-tivity (W/m-k), which describes the material’s ability to conduct heat; x is distance of heat flow, and dT is temper-ature difference.
Due to the heterogeneous nature of typical MEMS hot-plate chip, which typically employing glass or sili-con substrate and metallic thin films, the thermal sili- con-ductivity depends on the relative thickness of each indi-vidual layer and its orientation with respect to heat flow. We can define thermal impedance, Rq, as shown in Eq. (5) for non-homogeneous structure. These two parame-ters, i.e., thermal conductivity and thermal impedance, describe heat transfer within a material. The relationship between k and Rqis shown as in the Eq. (6).
(5)
(6)
The thermal impedance, Rq, of a material is defined as the summation of its thermal resistance and contact re-sistance. The contact resistance would thus include the
' ' ' '
R NC C FC
heating power
P - =Q +Q +Q +Q
heating power FC C air air Si Si
P - =Q¢ +Q¢ =G l D +T G l DT ( ) FC S a Q¢ = ×S T -T ( ) C dT Q k S dx ¢ = × ×
Figure1. Schematic diagram of a micro-machined thermal anemometry sensor shows four common heat trans-fer paths and losses rate of natural and forced con-vection (Q’NC, Q’FC), radiation (Q’R) and conduc-tion (Q’C). C T R S Q q = D¢ , material contact x k R R R Rq q = = +
effects of surface roughness, clamping pressure, mate-rial thickness and compressive modulus.
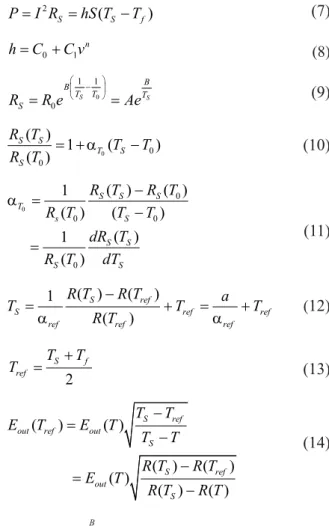
The principle of the thermal anemometer can be de-scribed by the following equations with power (7) deliv-ered to the sensor.
(7) (8) (9) (10) (11) (12) (13) (14) Where: A R e B T = 0 -0
P = resistance of the hot-plate sensor at temperature TS;
h = heat transfer coefficient referred to the sensor surface in W/m2K;
S = wL surface area of the sensor (w = width, L = length)
n = the fluid velocity, and C0and C1are experimen-tal constants;
B = material dependent temperature constant Ts= temperature of the hot-plate sensor at work (K);
Rs= hot-plate sensor resistance at temperature TS;
R0= resistance at temperature T0;
T0= reference temperature (K);
Tf= fluid temperature (K);
Tref= calibrate hot-plate sensor reference temperature
(K);
aT0 = resistancetemperature coefficient at T0; aref= hot-plate sensor reference temperature (K)
tem-perature coefficient;
In (8) h depends on the fluid mass flux (r* Q) and di-mension of sensor. The function between h and velocity can be experimentally determined by best fitting the parameters in the first order approximation of the modified King’s law for free convection heat transfer at low Reynolds number (Re) in a long cylindrical structure [13-15]. The common
method of measuring the resistance change of a hot-plate sensor is to build the probe into an arm of a Wheatstone-bridge circuits, the hot-plate sensor output voltage is Eq. (14).
2.2 Design of Micro-machined Thermal Flow Sensor One of the important design issues is the operating temperature of the sensor comparing to normal body temperature, especially for low power consumption. To optimize sensor performance, the designed sensor has to decrease its resistance and heat capacity but increase sur-face area for sensing of flow. The optimal range of resis-tance should be in the range of 35~500W. The optimal working temperature of the sensor would be around 70 °C with current of 1~15 mA [6].
From above mentioned criterions, there are some important issues that we have to consider as well. These include material thermal conductivity, sensitivity, flow direction, and structure. Figure 2 shows two different structure designs of thermal sensor, ie. thin film resistor on a) bulk silicon and b) Si3N4by back etching. We used the FLOTHERM® software to simulate and compare their performance in theoretical settings.
2.3 Fabrication Process
Typical metallic thin film deposition and patterning 2 ( ) S S f P=I R =hS T -T 0 1 n h=C +C v 0 1 1 0 S S B B T T T S R R e Ae æ - ö ç ÷ è ø = = 0 0 0 ( ) 1 ( ) ( ) S S T S S R T T T R T = +a -0 0 0 0 0 ( ) ( ) 1 ( ) ( ) ( ) 1 ( ) S S S T s S S S S S R T R T R T T T dR T R T dT a = -= ( ) ( ) 1 ( ) S ref S ref ref
ref ref ref
R T R T a T T T R T a a -= + = + 2 S f ref T T T = + ( ) ( ) ( ) ( ) ( ) ( ) ( ) S ref
out ref out
S S ref out S T T E T E T T T R T R T E T R T R T -= -=
-Figure 2. Two different designs of Pt thin film thermal ane-mometer based on a) Bulk silicon and b) back etch-ing structure.
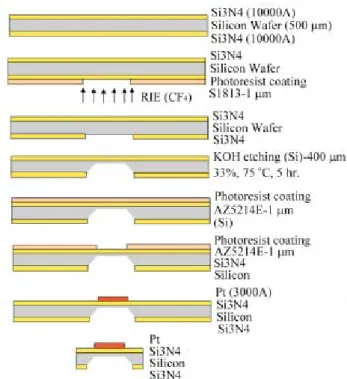
processes are used in microfabrication of proposed sen-sors. N-type 4 inch, 500mm thick, silicone wafer <100> after routine cleaning procedures was put into PECVD oven to grow Si3N4 (10000 Å) on both sides. After lithog-raphy patterning, the Si3N4 was opened by RIE etched, and then backside etched in 33% KOH solution at 75°C to form pyramidal pits. The front side was patterned by li-thography and deposited 3000 Å Pt heating layers by an E-beam evaporator over the Si3N4 and patterned by lift off process. Figure 3 shows the fabrication processes.
2.4 Testing Apparatus
Functional tests and verifications of fabricated micro-sensors and prototype are conducted by using a refer-ence standard of 3 liter syringe (A-M systems Inc., USA) for volume sensing and a flow calibration ana-lyzer (RT-200, Allied Healthcare Inc., USA) for flow sensing. A home-made environmental box is used to contol the inlet gas flow rate, temperature and humidity that flows through the connected device under test.
3. Results and Discussion
3.1 Simulation of Structure DesignThe thermal conduction through substrate contact is the major heat loss without back etching through silicone
wa-fer. Figure 4 shows the simulation results of two different structures: a) flat contact and b) back etching. In the first case, the temperature of the substrate follows thin film heat source very closely, which is less optimal for the flow sen-sor uses. In the later case, the temperature of the thin film source does not propagate into substrate due to the presence of air gap. It makes most of the generated heat dissipate through air convection instead of substrate conduction.
3.2 Fabricated Sensor and Performance
Following previous mentioned fabrication processes, Figure 5 shows one of the fabricated thermal anemome-Figure 3. Microfabrication processes flow for thermal
ane-mometry sensor with back etching on Si3N4 mem-brane.
Figure 4. Thermal conduction simulation results of a) flat contact sensor structure and b) back etching struc-ture in the air flow. In the first case, a lot of heat dis-sipates through substrate. The temperature of sub-strate follows hot-film closely. In the later case, most of the generated heat is radiated through air instead of substrate. So the temperature profiles of these two elements deviate from each other.
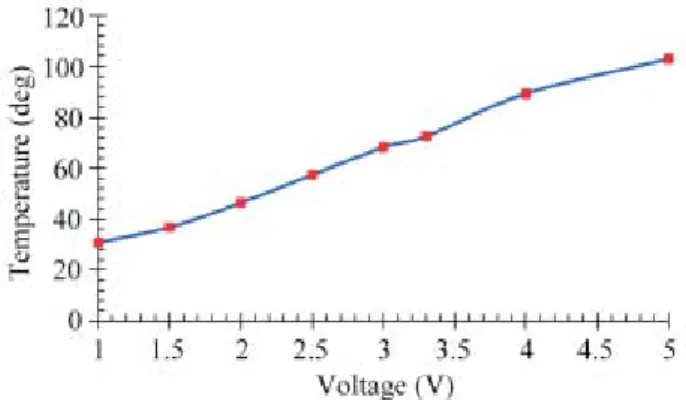
ter chips. The chip size is about 2 mm*2 mm*0.5 mm. Its geometrical features of sensing site, which is 443 um in thickness and 388mm width by using a standard surface profiler. The sensor element, as shown in the Figure 6, was used in the following functional studies. Its power consumption under constant voltage of 3 V in air is about 39.8 mW. Figure 7 shows the temperature measurement results of this sensor under different operating voltage.
The validation of the designed sensor by using a ther-mal imager can be used for the measurement of input dif-ferent voltage on hot-plate sensor surface temperature profile. Figure 7 shows the resultant thermal and input voltage relation. The sensor element reaches 72.5°C with constant voltage of 3.3 V in this case, which is in our de-sign specification.
3.3 Spirometer System
A potable pocket sized spirometric system is con-structed and shown in Figure 8, in which the described thermal anemometric sensor is positioned in the center of the open tube. This prototype is then put into a testing
chamber with temperature and humidity control. We used high pressure air source with variable control valve to have different flow velocity the construct a calibration curve for the spirometric system. The reading on the cali-bration analyzer is recorded and plot against the Vout Figure 6. Assembled thin film thermal anemometer sensor with
wire bonded on a printed circuit board to testing.
Figure 7. Temperature measurements of assembled thermal anemometry sensor under different operating bias from 1 to 5 volt., it is about 68 degree with 3 volt.
Figure 8. Prototype of a portable pocket-sized spirometer, in which the described micro-machined thermal ane-mometer has been implemented and assembled for functional testing is shown in the photo with a ten dollor coin.
Figure 9. The calibration cure of thermal anemometer placed in the long cylindrical tube for testing under various flow rate (0~180 L/min), the solid line is the nonlinear best fit of original data (open circle) to modified king’s model, y (volt) = 0.5197 V (flow rate)0.2232, R2= 0.95.
Figure 10. By using a 3 liter calibration syringe, five repetive measurements with area integral gives 2.981± 0.0081 liter. It is within the 3% acceptance criterion of ATS.
output of the analog circuit. The data is then nonlinear curve fitting by using Eq. (8). The resultant curve is then nonlinear cure fitting to find out the parameters. Figure 9 shows fitted result according to the modified King’s law results in y (volt) = 0.5197*V0.2232, R2= 0.9541.
Figure 10 shows repetitive flow measurements by us-ing a standard 3 liter syrus-inge in the environmental control box with stable temperature (35°C ~ 37 °C) and humidity (85 ~ 88%H). The area integral of resultant flow-time curves gives well repeatability. Five measurement results of area integral give average value of 2.981 with standard de-viation of 0.0081 by a traceable flow meter. If the coverage factor = 2 and level of confidence = 95%, then we can ob-tain the expanded uncerob-tainty is 0.096 liter (± 1.3%) for 3 li-ter syringe. The uncertainty of 3 lili-ter volume test is less then ± 3%, which is within the recommended range by ATS.
4. Conclusions
A simple model for a micromachined thermal sensor was presented for the calculation of temperature distribu-tion and conducdistribu-tion. Based on the simuladistribu-tion results, the heater geometry for each membrane size of the manufac-tured sensors is chosen around the optimum value for the sensor efficiency. The experimental results are in agree-ment with our design considerations. This was verified by measurements of the total power consumption in air at con-stant temperature. An increase in membrane size while keeping the heated membrane area constant led to reduced power consumption. In the future it is intended to integrate the operational amplifier analog circuit and processing electronics on the same chip or gas sensing film.
Acknowledgement
This project is supported in part by Ministry of Eco-nomic Affairs (Taiwan, R.O.C.). The assistance of ITRI-ERSO Allen Lin in flow analysis and Prof. A. B. Wang in thermal imageanalysissystem is gratefully acknowledged.
References
[1] Centers for Disease Control and Prevention (CDC),
Morbidity and Mortality Weekly Report, Vol. 47, pp.
1022-1025 (1998).
[2] U.S. Department of Health and Human Services, National Heart, Lung, and Blood Institute “Data Fact Sheet-Chronic Obstructive Pulmonary Disease (COPD),”
May 2001.
[3] Anonymous, “Standardization of Spirometry, 1994 Up-date,” Am. J. Respir Crit Care Med, Vol. 152, pp. 1107-1136 (1995).
[4] Van Putten, A. F. P. et al., “Multisensor Microsystem for Pulmonary Function Diagnostics,” IEEE Sensor Journal, Vol. 2, No. 6 (2002).
[5] Chiu, J. P., “Micromachined Anemometer for Spirometric Application,” N.T.U. Master Thesis, Taiwan, R.O.C. (1999).
[6] Chiu, N. F., “Development of MEMS Hot-Wire Chip for Portable Digital Electronic Spirometric System,” N.T.U. Master Thesis, Taiwan, R.O.C. (2001). [7] Jiang, F., Tai, Y. C., Ho, C. M., Karan, R., and
Garstenauer, M., “Theoretical and Experimental Studies of Micromachined Hot-wire Anemometers,” IEDM, IEEE, pp. 94-139, (1994).
[8] Udrea, F., Gardner, J. W., Setiadi, D., Covington, J. A., Dogaru, T., Lu, C. C. and Milne, W. I., “Design and Sim-ulations of SOI CMOS Micro-hotplate Gas Sensor,”
Sen-sors and Actuators B, Vol. 78, pp. 180-190 (2001).
[9] Van Dijk, G. J. A. and Huijsing, J. H., “Bridge-output-to-frequency Converter for Smart Thermal air-flow Sensors,” IEEE Transactions on Instrumentation and
Measurement, Vol. 44, No. 4, (1995).
[10] Rasmussen, A. and Zaghloul, M. E., “In the Flow with MEMS,” IEEE Circuit & Device Journal (1998). [11] Bosch, R., “Micromachined Metal Oxide Gas Sensor
Opportunities to Improve Sensor Performance,” Sensor
and Actuators B, Vol. 73, pp. 1-26 (2001).
[12] Bosch, R., “Micromachined Thermal Conductivity Hydrogen Detector for Automotive Applications,” IEEE, pp. 1571-1575 (2002).
[13] Lin, C. W., Wang, D. H., Wang, H. C. and Wu, H. D., “Prototype Development of Digital Spirometer,”
Pro-ceedings of the 20th Annual International Conference of the IEEE Engineering in Medicine and Biology So-ciety, Vol. 20, No 4 (1998).
[14] Oliverira, A., Freire, R. C. S., Deep, G. S. and Lobo, P. C., “An Anemometer with PWM Exciation,” IEEE (1995). [15] King, L. V., , “On the Convection of Heat From Small
Cylinders in a Stream of Fluid: Determination of the Convection Constants of Small Platinum Wires, with Applications to Hot-wire Anemometry,” Proc. R. Soc.
London, Vol. 90, pp. 563-570, in J. O. Hinze (1914).
Manuscript Received: Mar. 30, 2005 Accepted: Jul. 5, 2005