Chiao Da Managemem Review Vol. 29 No. 2, 2009
pp.131-161
無形資產評鑑模型之建構與應用
Constructing and Employing the Appraising Model of
Intangible Assets
林亭汝 1 Lin, Grace T.R
國立交通大學科技管理研究所
Institute ofTechnology Management, National Chiao Tung University 沈永祺 Shen, Yung-Chi
國立交通大學科技管理研究所
Institute ofTechnology Management, National Chiao Tung University 胡封芬 Hu, Ju-Feng
國立交通大學科技管理研究所
lnstitute of Technology Management, National Chiao Tung University 孫嘉祈 Sun, Chia-Chi
國立交通大學科技管理研究所
Institute of Technology Management, National Chiao Tung Univers句
摘要:本研究並無試圖評估無形資產之絕對價值,而是想籍由價值騷動力 (val ue drivers) 概念探討各公司無形資產之相對價值比重,本研究認為價值驅 動力的概念將能清楚瞭解各公司無形資產是如何被創造 。 本研究將層級分析 (AHP) 法應用至無形資產之評鑑程序上,此乃因 AHP 法能夠將非財務性的價 值驅動力加以量化並評估出其對無形資產之貢獻權比,本研究主要目的為: 卜建構一嘗試性 (tentative) 之無形資產評鑑模型,協助企業正確評估公司價 值比重並避免在衡量企業價值時因以財務報表為主要依據而產生盲點 。 2 、有 鑑於高科技產業無形資產佔總資產比例甚高,本研究乃以台灣新竹科學園區 6 大產業及一個案例模擬作為研究標的,以翔實詮本研究模型之可行性,並 探討不同高科技產業問之無形資產之價值比重及評價應用 。 本研究之實詮結
1 Coπ.esponding author: lnstitute ofTechnology Management, National Chiao Tung Universi旬, Hsinchu Ci句,Taiwan. E-mail: g剖@faculty.nctu.edu.tw
132 Conslrucling and Employing Ihe Appraising Model 01扣的ngibleAssels
呆為建構不同科技產業埋怨之無形資產配置 , 顯示不同產業之無形資產特
色,並可輔助企業評價及提升價值基礎管理成效 。
Abstract: This paper does not intend to actually valuate intangible assets but focuses to investigate the relative value distribution of co巾。rate intangible assets,
and this Iinks c10sely to the ∞ncept and application of value drivers. That is because we believe that drivers or attributes of the value significantly detennine how virtual value ofthese intangibles can be created for companies. We apply the
analytic hierarchy pro∞55 (AHP) to the appraising process of intangible asse包 The AHP method can mainly sort the non-financial value drivers in order according to their weighted contributions. The key purpose of this paper is to
construct a tentative model for the evaluation of intangible assets, which helps business to more correctly appraise co叩orate value ratios and avoid bias due to
mainly relying on financial statements when measuring an entity value. In additi凹, in view of the significant proportion of intangible assets over total assets
in high-technology industri郎, this research then takes six industries in Hsinchu
Science Park and one virtual case as the research objects in order to test the applicability of our model, as well as exploring the value weights of intangible
assets and its evaluation amongst different high-technology industries. Besides,
the empirical result of this paper is mainly to support bU5iness appraisal and thus improve the effectiveness of value based management
關鍵字 : 無形資產;價值驅動力;層級分析 (AHP) 法;評鑑模型;高科技產
業;企業評價; VIKOR
Keywords: Intangible Assets; Value Drivers; Analytic Hierarchy Process; Evaluation Model; Hi-tech Industry; Business Appraisal; VlseKriterijumska Optimizacija 1 Kompromisno Resenje (VIKOR)
1.
Introduction
Intellectual capital or intangible assets are recognized as the most important
Chioo Do MOl1ogement Re叫ew Vo/. 29 No. 2, 2009 133
foundation for the market dominance and continuing profitability of leading c。中orations. In addition, it 的 often the key objective in mergers and acquisitio肘, and knowledgeable companies are increasingly using licensing routes in order to transfer these as泌的 to low tax jurisdictions. Nevertheless, the role of intangible
assets in business is insufficiently understood. Accounting standards are generally
not helpful in representing the worth of intangible assets in company accounts, and they are often under-valued, under-managed or under-exploited. Namely, despite the importance and complexity of intangible as泊的, there is generally Iittle
coordination between the different professionals dealing with these relating issues Recently issued accounting standards have created the need for valuation of
intangible assets for financial statement purposes. Arriving at these valuations can be a complicated process. This raises the question of which values remain hidden within intemally developed intangibles. Therefo時, the balance sheet undoubtedly has significant limitations in terms of reporting an enti旬's true value. Intemally developed intangible assets, even those for which a fair value may be determinable, are not recognized in the financial statements. Investors and
creditors recognize these Iimitations and presumably perform independent research and analysis in their investrnent and credit decisions
Meanwhil巴, one of the most vexing problems in business valuation is the issue of valuing intangible assets. They come in many forms, including patents and trademarks, copyrigh尬, m剖 ling lis俗, exclusive contracts, royalty agreements, work-in-progress, proprietary designs, and many others. These asse包個d intellectual properties have a real value that can be estimated through investigation and objective calculation. Sveiby (2002) reviewed 28 intangible
assel valuation methods, based on the framcworks of Luthy (1998) and Will 即n (2001), and classified them into four categories. However, there is still no universal valuation method. Studies regarding intangible assets evaluation involve the valuation determinants (Chiu and Ch凹, 2007), the evaluation methods
(Johnson, 1999; Kaplan & No此徊, 2004; Dubin, 2007), and the relationship between intangible assets and share price (Chan et 泣, 2001; Johnson et al., 2002)
This paper, however, does not intend to actually valuate intangible assets
134 Conslrucling and Employing Ihe Appraising Mode/ ollnlangible AsSelS
assets, and this closely Iinks to the concept and application of value drivers. This is because we believe that drivers or attributes of the value significantly detennine how virtual value ofthese intangibles can be created for companies. We apply the Analytic H ierarchy Process (AHP) to the appraising process of intangible assets. The AHP method can mainly sort the non-financial value drivers in order according to their weighted contributions. Therefore, one of the key pu叩oses of this paper is to develop a tentative model for the evaluation of intangible assets, which helps businesses to more ∞rrectly appraise corporate value ratios and avoid bias due to mainly relying on financial statements when measuring an entity's value. In addition, in view of the significant proportion of intangible assets over total assets in high-technology indus仙的, this research, then, uses six industries in Hsinchu Science Park, Taiwan and one virtual case as i臼 research
objects to test the applicability of its model, as well as exploring the value weights of intangible asse的 and its evaluation amongst different high-technology indus甘 les
2.
Intangible Asset 2.1 Value CreationCo巾。rations sometimes choose not to focus on value creation and, instead,
unintentionally m到ce decisions that systematically decrease the long-tenn value of their businesses. This is . perhaps because managers tend to define their organizations' interests narrowly. This constricted view is powerfully reinforced by financial accounting systems that are well adapted to the industrial economy but are inadequate in the information e∞nomy. The accounting and finance conventions of the industrial age are effective at valuing tangible assets, but they largely ignore the value of harder-to-quantify asse臼, such as employee satisfaction, learning, R&D effectiveness, and customer loyalty (Mathis and Jackson, 2003). In 由e infonnation age, intangible assets are far more important than the tangible assets that traditional accounting systems were designed to measure.
Chiao Da Managemenl Review Vol. 29 No. 2. 2009 135
I f management defines 出e organization's self interest (and consequently its goals) too narrowly - for example, to maximize this ye缸's or this quarter's
reported eamings, it wiIl view this interest as being at odds with the needs of
customers and employees. Given that perspective, in the short term, every doIlar
spent on employee training, for instance, is a doIlar of lost profit. Every additional
doIlar eamed from a customer, even if it comes at the cost of poor service or price
gouging, improves this quart釘's results (Kotler, 2003). Alternatively, if managers
define their company's interests broadly enough to incIude the interests of
customers and employ皂白, an equaIIy powerful spiral ofvalue creation can occur
Highly motivated, weIl-甘ained, properIy rewarded employees deliver outstanding
service, whiIe e仔ective R&D investments lead to produc包 that enjoy a significant
value-adding advantage and generate higher margins. Satisfied, loyal customers
(如d new customers responding to word-of-mouth referraIs) drive revenue growth
and profitability for investors (Kotler, 2003)
One way to build an understanding of these dynamics is to identify the key capabilities, resources, and relationships that are the basic ingredients of value creation for a particular firm 缸1d to ilii叫( of these ingredients as assets that either grow or diminish over time, depending on the way in which they are managed This is, then, useful to map a company' s key asse包 by building a “value-creation
net" focused on employees, processes, customers, and investors (see Figure 1). A
firm's capabilities and skiIIs determine the degree to which the company can meet
these requirements and provide a greater value than 的 competitors (Hamel, 1991) In building 甘1e value-creation net, managers should decide which assets are the most important drivers of the company's value-creation system. For example, employee learning and job satisfaction are Iwo assets that could be tracked on the part of employees in the vaIue-creation net. As managers identify ilie strategic
asse臼 that belong in each vaIue-creation n仗, they also must articulate the reIationships among these assets. By 仕的ing the dynamics through which customer, employe巴, and process assets accumulate, interact, and ultimately drive profitable growth, a company wiII be weIl on i臼 way to managing the fundamentaIs of value creation 個d avoiding the pitfaIls of management by foIlowing a set of narrow financial measures
136 Constructing and Employing the Appraising Model ollnlangible Assets Empl吋開 PtOC:~55 2.2 Value Driver Figure 1 Value-Creation Net Rein"'e'itmen他 ìnEmployus CtI51OD1t'1"5
..d
h‘四'。自Rcin .. -e1>tment ìn P('OCess
Source: Lin and Lin (2006, p.97)
Theoretically, an asset, whether tangible or intangible, is assessed through its expected fuωre dis∞unted cash flow. This is the basic principle of the discounted cash flow. From such premise, strategies drawn by a company may positively or negatively affect a given company's value. Consistent with this principle, Lev (2001) defines intangible assets as a right for fuωre benefits that do not have a physical or financial body (stocks or debt securities)
In order to a1low a better understanding of the intangible asset ∞ncept, It IS necessary ωpresent its c1assification. Sveiby (1997) points out that intangible
assets ∞mprise employee competence, intemal structure, and external structure.
Employee competence involves the capability to act in a wide variety of situations
to create both tangible and intangible assets. The intemal struc仙 re includes patents, concepts, models,缸ld computer and administrative systems. The extemal structure includes relationship with customers and suppliers. Stewart (1999) argues that intangible asse臼 include human assets, s甘ucωr叫 asse尬, and customer
assets. Human assets are employees' problem-solving capabili旬, which indicate the entire staffs' knowledge, skills, capabili旬, expenen切, virtual ownership,
Chiao Da Managemenl Review 均1. 29 No. 2. 2009 137
practlce commumty, 如 d intangible interaction. Structural assets can provide 由e capability of knowledge management for an enterprise to innovate. Customer asse訟, indicating leaming and trust to each other, are the relationship between
stakeholders in terms of customer satisfaction, customer growth rate,如d customer participation. And Lev (200 1) categorizes intangible assets into marketing, technology, artist間, data processin車, engineering, customer-related,
contract, human capit剖, location, and goodwill. Table I depicts a summarized
c1assification proposed by Kayo (2002) based on the above literature discussions
Table 1
A Proposal for C1assifying Intangible Assets Type of intangible Main intangible assets
Human assets knowledge, talent, capabilities, skills, employee's
expenenc唔, superior managemen
t,
key employees,training and developme肘, among others
Innovatio咽 assets research and developmen
t,
pat凹的, secret formul筒,technological know-how, among others.
Structural assets procedur,郎, so食war巴, data bases, information systems,
market intelligenc唔, market channels, among others. Relationship assets brand, trademarks, copyrigh尬, con甘acts with c1ients,
suppliers, contract oflicensing, franchise, among others.
So叮臼 Kayo(2002, p.19)
Table 1 presen的 a taxonomy for the intangibles assets. Some authors
consider such assets to be non-financial value-drivers. However, it is necessary to differentiate intangible asse包 from drivers that lead to the formation of their
values. This means, intangible asse的 must not be ∞nsidered as drivers themselves. Drivers must be at甘ibutes that would be responsible by the definition
of the intangible asse悠, values. An ex缸nple of a possible Iist of non-financial drivers of value is presented by Kalafut and Low (2001). These authors suggest a list containing nine drivers, which are the most critical ones in their researches.
138 Consfrocfing and Employing fhe Appraising Model ollnfangible Assefs
These drivers are be innovati凹, qual旬, customer relati凹, management
capabilities, allianc郎, technology, brand value, employee relatior時, and
environmental and community issues.
Such drivers are p訂t of what Kalafut and Low call the value-creation index
Non-tinancial drivers, 的 suggested by Kalafut and Low, are at甘ibutes that may be
associated with different types of intangible assets. The higher or lower intensity
in the relative importan∞ of each driver may inf1uence the formation of value for intangible assets. Non-tinancial drivers are of m句。r importance in a110wing the understanding of the nature of intangible assets. According to Feltham and Ohlson (1995), the value of intangibles can cause abnormal protits. Evidently, in order to allow such protit to occur, sales and services revenue must be maximized and
several types of expenditures (cos的 and expenses) must be minimized in order for
the sales to be maximized. lt is ne臼ssary to understand why ∞nsumers buy a
given product from a company and do not buy it from its competitor. What leads,
for instance, a consumer to buy a luxury automobi峙, such as the Mercedes, and not to buy a popul紅 car, such as a VW? lt can be supposed that the consumer is interested in at甘ibut郎, such as status, tradition, high-technolo缸, stability, 個d
comfort. These at的butes form the 鉤-called purchasing drivers. The two tirst
drivers (status and tradition) have an essentially intangible nature. High technologies may have a tangible inf1uence, such as the use of on-board computers. At last, stability and comfort are essentially tangible because they depend on physical attributes. Each type of asse
t,
whether tangible or intangib峙,exerts differentiated inf1uences on each driver. For instance, the brand may exert a
m句。r inf1uence on the status and 甘adition drivers. As status and tradition are intangible drivers by their nature, it can be deducted that the brand is an intangible asset.
However, again, it is important to remember that the analysis of drivers is only part of the evaluation pro∞ss of intangible assets. Once the pro∞SS IS
complete, these drivers must be associated to economical-tinancial forecast results
For example, it can be used as a variation of the discounted cash-f1ow method combined with the EVA (Economic Value Added) concept.
Chiao Da A4anagement Review 均1. 29 No. 2. 2009 139
3.
MethodologyThe main purpose of this study is to investigate the expected ratio distribution of intangible assets for different high-tech industries located in the science park. The AHP is adopted to help to construct the evaluation model for this purpose. A virtual case is then taken for testing the applicability of this model through the data processing of grey relational anaJysis and the VIKOR method 3.1 Analytic Hierarchy Process (AHP)
This research primarily uses the AnaJytic Hierarchy Process (AHP) in order to explore the issues in question. For managerial pu巾的的, it is important that the management succeeds not only in estimating the value of the intangibles, but also in identi秒 mg 出e relative contributions of 出e different drivers to 伽 ωt叫 ofthe company's intangibles. This w呵, the managerial strategies may be be位er planned in order to allow investments and efforts to be aJlocated as to contemplate the importance of the vaJue drivers. In such conte泣, the AHP proposed by Saaty (1996) appears to be an extremely useful mechanism that allows the change ofthe qualitative 個 d subjective comparisons between drivers in quantitative and cardinal features
The AHP method is a multi-criteria method 出 at is anaJysis based on an additive weighting process, in which sever叫 relevant attributes are represented through their relative importance. AHP has been extensively applied by academics and professionaJs, mainly in engineering applications involving financial decisions associated wi出 non-tinanciaJ attribules (S組妙, 1996). In the specific case of the intangible asset's an aJys眩, the AHP aJlows the
“hierarchization" of subjective opinions in categories of drivers of value, making possible a quantitative treatment that leads to a numerical estimate of the relative importance of each driver.
Through AHP, the importance of severaJ attributes is obtained from a process of paired comparison, in which the re1evance of the at甘 ibutes or categories of drivers of intangible assets are matched two-on-two in a hierarchic
140 Conslrucling and Employing Ihe Appraising Model ollnlangible Assels
structure. Initially, the management must compare the several drivers following the verbal-judgment scale presented in the table below (Table 2). Intermediate values are possible, and they ∞rrespond to the intermediate importance relatior>ships among attributes
Table 2
Verbal Scale for Pairs of Compared Attributes
Scale 3 5 7 2,4,6,8 Definition Equally important Moderately important Strongly import血t
Very strongly impo口創
The middle value between
two con包nued scale
Source: S祖ty (1980)
Description
Two altematives are equally important
Experience and judgment moderately p間fer to
oße altemative
Experience and judgment strongly pre面前 to oße altemative
Experience and judgment very strongly prefer
to one altemative Jntennedîate va1ue
For instance, in comparing the relative importance between drivers A
,
related to 吭 , ifthejudgment is 9.00
,
the management considers that the attributeA
,
is extremely more important than attribute A j in generating intangible assets.Wi自由 is procedure, the verbal judgment mechanism ∞mposcd by the
management' s perceptions is 甘ansformed in numerical equivalents. Thus, the managers must perform the qualitative comparison of every driver among themselves, according to 由e previous table and, thus, obtaining the table below
ChiaoDaMO/問gement Re叫ew Vol. 29 No. 2. 2009 141
Table 3
Matrix of Paired Comparison among n-Evaluation Criteria
A
,
A
,
A
,
X ll = 1X
21 = 1/X
12 4一九一九
An Attribute X'n X 'n An X n,
=
11 X'n Xn,
= 11 X'nxm=l
In the AHP model, ifthe relative importance of A; related to Aj is Xij'
the opposite comparison of attribute A j related to attribute A; is equal to
IjXυ Obviously, the diagonal of the matrix of the ∞mparison is equal to 1.00,
since each driver is compared to itself. Considering the paired comparison's
ma甘 ix and based on mathematical concepts of eigenvalues and eigenvectors,
Saaty (1996) sets that the relative weights of each at的bute may be calculated
through the following equation
v
L:
w
;
j)w
(j) =-'二i-wzth w =i三L一一L:
X
.
n;;;)
The relative weights may be submitted to a cardinal comparison. This way,
the evaluation based on multiple criteria is performed weighting the indicators of attributes of each altemative by the relative weights. AHP allows the identification of a parameter on the consistence level of the relative importan臼 of the attributes since subjective judgment may present decision biases. Such index
reflects the coherence level of comparisons among attribut郎, and this is
142 Constructing and Employing the Appraising Model 0/ Jntangible Assets
,可主αg
主X
i
i
-w .. C.I. = 一三二LL.comλ;zl 一 .α 尸l (n -1)β n WjC
.I C.R.=一-R
.I where[1
= 0,0; 0,0; 0,58; 0,90; 1,1
2; 1,24; 1,32; 1,41; 1,45; 1,4
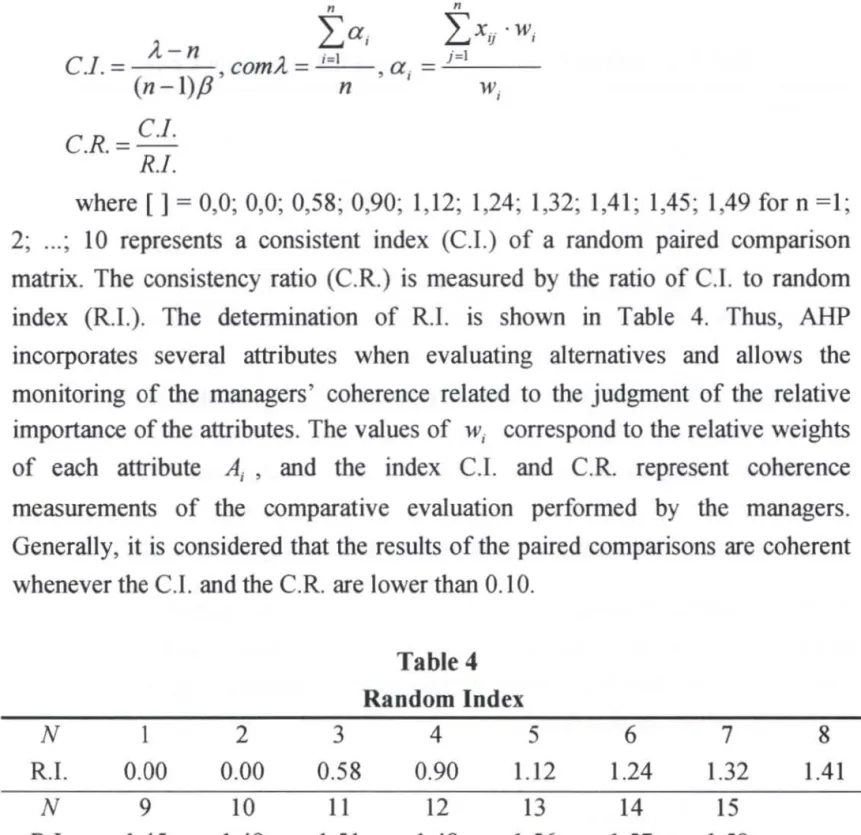
9 for n =1; 2; ..., 10 represents a ∞nsistent index (C.I.) of a random paired comparison matrix. The consistency ratio (C.R.) is measured by the ratio of c.I. to random index (R.I.). The determination of R.I. is shown in Table 4. Thus, AHPmco叩 orates several at甘ibutes when evaluating altematives and allows the monitoring of the managers' coherence related to the judgment of the relative
lmportan∞ ofthe attributes. The values of W; correspond to the relative weights
of each at甘 ibute A; , and the index C.I. and C.R. represent coherence
measurements of the comparative eval uation performed by the managers
Generally, it is considered 出at the results of the paired comparisons are coherent whenever the C.I. and the c.R. are lower than 0.10
Table 4 Random Index N 2 3 4 5 6 7 8 R.I 0.00 0.00 0.58 0.90 1.12 1.24 1.32 1.41 N 9 10 11 12 13 14 15 R.I 1.45 1.49 1.51 1.48 1.56 1.57 1.59 So叮臼 Saaty (J 980)
3.2
Data Processing of Grey Relational AnalysisData processing of grey relational analysis ∞nducts data set to fit the comparability before the grey relational generation (Deng, 1990; Chang et a1., 1996). This method not only normalizes the data set into 叫 ues from 0 to 1 but adjusts all factors' objectives to 1arger-the-better; thus, this method does not
∞nvert the original information 個d avoids non-definition of factors. It also eliminates the problem with different units of each factor. ln order to conduct data
Chiao Da Managemellt Review Vol. 29 No. 2, 2009 143
processing, there exist three data processing methods: larger-the-better,
small-the-better and nominal-the-best. This study adop臼 larger-the-better method
to conduct data set in the virtual case analysis. The equations of these methods are
as follows (Deng, 1990; Chang et al., 1996)
(1) If the expectancy is larger司the-better (e.g., the benefit), then it can be expressed by
k" - mink
K.: 一一一一」
“ max k" - min k
where k" denotes the expe此 's evaluation of the 的∞mpany on the 社h
criterion
ο) If the expectancy is small釘-th岱b甜.er (e.g., the cost and defe忘ts), th叫 it can
be expressed by:
max k" - k"
k!= i
"maxkaf - mIn ktf
(3) If the exp侃侃的Y is nominal-the-best value, then it can be expressed by
K\ 占三色l
sz m?xk', 一k吋
where mpk', 全 k" > m}n k;,
3.3
The VIKOR MethodThe VIKOR method, which is one o[ compromise programming me出ods in
multi-criteria decision m法m且, is proposed by Opricovic (1998, 2002). This study employs VJKOR method to rank the companies' priority in the virtual case. The basic concept of VIKOR is to determine the compromise solution 個d the weight
stability intervals for preference stability of the compromise solution obtained
with the given weights (Opricovic & Tzeng, 2004). This method introduces the multi-criteria ranking index based on the particular measure of“c1oseness" 的 the “ ideal" solution (Opricov泊, 1998). The procedure of the VIKOR applic泌的n 闊的
144 Conslrncling and Employing Ihe Appraising Model olInlangible Assels
follows (Opricovωand Tzen皂, 2007; Chu et
a1.
,
2007)(1) Step 1: calculate the normalized value.
For the pro∞ss of normalized value
,
whereK
;
,
is the value ∞nducted by the data processing of grey relational analysis; i and t denote the ith criterion andthe Ith company, respectively. The equation is as follows
L = K J J Z E I = 1 2 n t=
(2) Step 2: determine the best and worst values
For
a1
1 the criterion functions, the best value isJ;'
as opposed to the worstvalue 正 ; 也at is, for criterion i = 1之...月 , the best value
J;'
and the worstvalue
1.
-
are defined as followsf
:
= maxJ;
,
λ- = min
J;,
(3) Step 3: compute the values S
,
and R,
The values S
,
and R,
are defined as the following equationss
,=
主1V;
(r,.
-
J;
,
)I
(r,
' -
J;
-
)
;=1
R
,
=max[w
;
μ'
-
J;, )
I
缸﹒ -
j,-)]where w; denotes the weights of criteria (4) Step 4: compute the value Q.
The final value
Q
is as followsQ
,
=v(S
,
-
S-)j
(S
.-
S-)+(1-
v)(R
,
-
W)
/
(R
.
-W)
Chiao Da Management Review Vol. 29 No. 2, 2009 145
maximum group utility (majority rule), and R- is the minimum individual regret
ofthe
“
opponent"; v is introduced as a weight for the strategy of maximum grouputility, whereas 1- v is the weight of the individual regret, usually v = 0.5
(Opricovic 細d Tze嗯, 2007).
By sorting values
Q
"
the comp叩1郎, priority in the virtual case can bedetermir叫
4.
Constructing the Research ModelTaking into consideration categories defined by Kayo (2002), Kalafut and
Low (2001) and other au曲。rs as noted before, the evaluation model of 也IS
research can be divided into five appraising dimensions and 22 appraising criteria for probing into the issue regarding the value weights of intangible assets in technology business. We also invite experts and other scholars in the relating fields to confirm the fit and the reasonableness of the model construct. The purpose of the questionnaire is to help allocate the relative importance of each appraising dimension and criterion while comparing pair by pair. First, we issued 由e questionnaires with five dimensions, including
“
Innovation and Technology,"“
Management Capa必b蚓凶il圳lity,"“
Empμloye∞e Ca叩pa幼bi山lity,"Allian巳∞e," and “Goodwill," to respondents in order to explore the perceived relative importan臼 (weights). Second, again, we examined the appraising criteria underlying the five dimensions mentioned above in order to gain the respondents' perceived relative importance (weight). By doing so, the respondents' views of
each relative importance of appraising criterion could be reflected and analyzed
further. The evaluation model of int位19ible assets constructed by this research is
depicted in Figure 2
5.
Empirical Analysis146 Conslrucling and Employing Ihe Appraising Model ollnta悍的leAssets
Figure 2
The Evaluation ofIntangible Assets in Taiwan's High-tech Industries
The Evaluation of
111tangible Assets
Tbe 1" Level Appraising Dimensions
Innovation and Technology
Management Capability
Employee Capability Customer Relationship and AJliance Goodwill The 2"d Level Appraising Criteria
Key Technology
R&D Capability
Manufacturing Pr苟且 ss
Sen,j自 Process
Patenting
Asset Managcment Capability
lntemal Control Capability
Operation Qua1ity Capability
Technology Update Capability
Employee's R&D
Employee's Inno、明mn
Employee '5 Knowlcdge
Employee'5 Training
Contract with Cuslomers
Contract with Suppliers
Distrib叫ion Right
Coooeration Con 甘act
Agr田mcnlwÎth Shareholdcrs
Company's R叩 utatlon
Customer's Loyalty
Busir司ess Culture Tradcmark
Chiao Da Managemel1l Review Vol. 29 No. 2. 2009 147
The targets of this research questionnaire are the six industries in Hsinchu Science Park, Taiw側, including IC foundry industry, communication industry,
computer and peripheral equipment industry, optoelectronic industry, precision machinery industry, and biotechnology indus甘y. The expe此5 interviewed are professional executives from each department of these industries, including
operatl凹, marketi月, human resources, research and developmer此, and finance,
with work experience of more than 15 years. This paper is aimed to understand experts' perceptions regarding the weights of value drivers in different industries. Therefore, the AHP method is used during the survey, attempting to quantitatively rank these non-financial contributions. The implicit assumption underlying here is that genuine intangible asset values may vary between fi口肘, but professional executives within the same industry should have a converged idea regarding the ways in which the intangible assets should be 紅rayed when they consider
comparing the relative impo此ance of the value drivers. Therefore, directly after obtaining the ideal measure of intangible assets surveyed by the AHP, the VTKOR method can be used by the management in order to assess how the virtual
arrangement of the individual ∞mpany' s intangibles is diverged from the
so-called ideal structur巴; this is particularly useful while encountering business mergers and acquisitions since it serves as a helpful reference for business
valuation. In the AHP survey, a total of 328 copies of the questionnaire were issued, 142 copies recollected, and 118 copies with C.I.IC.R. ratio less than 0.1 were selected to be e征ective analyzing samples. See Table 5 for statistics of
recollecting status. Note that the ratio of effective questionnaires in IC foundry industry is not the highest; even though so, more copies were issued in this industry due to 也 large capital structure as well as numerous operation
departments than other industries, which could reach more respondents
5.2 AHP
WeigbtsAccording to the investigation of weights (relative importan臼) of
intangible asset appraising dimensions in this research, “technology innovation" has been considered the most important dimension of the five by professional executives in IC foundry, communication, computer and peripherals, and
148 Constrncting and Employing the Appraising Model ollntangible Assets
optoelectronic industries. The weights are 0.422 for optoelectronic industry, 0.385
for computer and peripherals industry, 0.337 for communication industry, and 0.277 for IC foundry industry. 8ecause R&D and technology innovation 訂e the
m句or sour臼s of ∞mpetence in the above industri郎, the innovation and
technology dimension is emphasized in order to correspond with the
fast-changing market technological demand e缸ectively. On the other hand, the
preclslOn machinery industry views the “goodwill" dimension to be most
important and the weight of the dimensi凹的 0.28 1. We believe 由at this is
because the precision machinery indus甘y trades mainly through the traditional
business channel (828) that frequent trading and cooperation between enterprises
and raises the importanωof company goodwill in this industry. Then,
“
management capability" is thought to be the most crucial dimension inbiotechnology industry with the weights at 0.346 due to its industry characteristics
of high R&D investrnent risks. In other words, there are many other potential
factors that may reduce the technology e叮orts, and thus, dimensions, such as asset
manageme肘, laws and regulations, intemal control, commercialization process, integration capabil 旬, and management capabil 旬, are much greater concems in
this indus甘y 出個 the technical concem
The result of our research also reflects the fact that the relative importance
of intangible asset at甘ibutes varies among technology industries. Take IC foundry,
communication and optoelectronic industries for example.
“
key technology" and“
R&D capability" are emphasized when they evaluate their intangible assets, andamong which, the optoelectronic industry also pays much attention to the
“
intemal con缸。1" criterion in order to accord with the characteristics of quali旬,Innovatl凹, and fast development that high-tech industries pursue. ln addition, IC
found旬, computer and peripherals, and preclslOn machinery industries thi他
highly of “goodwill" 的 well, and specifically, the precision machinery indus甘y
even places more emphasis on the
“
customer loyalty" criterion. F凶由errnore, “ asset management capabil ity," “ operation quality capability, " “technology update capability," “patent," and “employee R&D" criterion are highly valued inbiotechnology industry to cohere with the indusuγ5 emphasis on criteri
a,
such asChiao Da Managemenl Review Vol. 29 No. 2, 2009 149
ranked intangible asset concem is indicated as
“
key technology" among five technology industries in our investigation, including IC foundry, communication, computer 缸ld peripherals, optoelectronic, 缸ld precision machinery indus甘ies. See Tables 6 and 7 for ideal value weights in the light of intangible assets appraising dimensions and criteria in each technology industry from our su凹eyTable 5
Statistics of Questionnaires Recollected in Each lndustry
Copies of Copies of Copies of
Percentages of
Indus信y Questionnaire Questionnaire Effective
Effective Copies Issued Recollected Questionnaire
IC Foundry 220 90 83 37.73"1色 Comm山l1ca白 on 23 10 7 30.4 3唔也 Computer and 36 14 10 27.78"1忘 Peripherals Optoelectronic 19 10 8 42.11 ~也 Precision 14 9 5 35. 71 ~也 Machinery Biotechnology 16 9 5 31.25% To旭l 328 142 118 35.98~也 Table 6
The Weights of Appraising Dimensions of Intangible Assets in Different Technology lndustries
Industty
Technology M個agement Employee Customer
Category/ Goodwill
lnnovation Capability Capability Relationship Dimension IC [0叩dry 。 277(1) 。 205 (2) 。 185 (3) 。 169(4) 。 164 (5) Communication 0.337(1) 。 277(2) 。 126 (5) 。 130 (3) 。 129 (4) Computer and 。 385 (1) 。 171 (2) 。 168 (3) 。 119(5) 。 158(4) Peripherals Optoelectronic 0.422 (1) 。 178(3) 。 182 (2) 。 142 (4) 0.076 (5) Precision 。 232 (2) 。 185 (3) 。 182 (4) 。 119 (5) 。 281 (1) Machinery Biotechnology 。 191 (2) 。 346 (1) 。.150 (4) 。 186 (3) 0.126 (5)
150 Constructing and Employi悍的eAppraising Model ollnta悍的leAssels
Table 7
The Weights of Appraising Criteria ofIntangible Assets in DilTerent Technology
Industries
Appraising
Computer
(Dimension) 1C
Communication and Opt明l配tronic Precision Biotechnology I Criterion! foundry Peripheral Machinery Industry Key 0.095 。 111 (2) 。 151 (1) 。 131 (2) 。 110(1) 0 個 1 (10) E < g Technology ( 1) R&D
。“3
。 116ω 0.062 (4) 。 134 (1) 0.053 (8) 0.033 (13) Capabi1ity J 3) S3 已凶 Manufacturing 0.041 。“。 (6) 0.052 (7) 。“7(3) 0.023 (15) 0.032 (14) E•
耳
昌。~
Pr阻ess ( 11) Servi自 0.035 0.022 (15) 。但9 (9) 0.042 (10) 0.018 (20) 0.028 (17) Pr,由ess (13) Patenting 0.040 0.028 (14) 0.072 (3) 0.047 (8) 0.028 (13) 0,057 (4) (9) Asset 0.043 Management (10) 0,072 (4) 0.059 (5) 0.036 (13) 0.033 (11) 的“ (1) Capability lntemal 0.048S
Control (7) 。 097 (3) 0.035 (12) 。但 1 (11) 0.053 (8) 0.048 (6) Capability Operation 0.059 Qu副tty (4) 0.045 (7) 0.027 (14) 0.045 (9) 0.058 (7) 0.070 (2) Capability Technology 0.055 Update (5) 0.063 (5) 0.049 (9) 0.056 (6) 0.040 (10) 0.063 (3) CapabilityE
Employ自 。師6 0.037 (9) 0.056 (6) 0.061 (4) 0.069 (5) 0.056 (5) R&D (2) Employee 0,046 0,036 (10) 。但 1 (11) 。但9 (7) 0.077 (4) 。但刊的 lnnovation (8)E
dp z Employee 0.040 0.032 (11) 0.048 (10) 0.040 (1 月 0.021 (18) 0.029 (16) Knowledge (11 ) Employ∞ 0.033 0.020 (16) 0.023 (16) 0.032 (14) 0,015 (21) 0.022 (18) Trainingí..I21
2
Contract with 0.051 0.036 (10) 0,050 (8) 0.057 (5) 0.024 (14) 0.048 (6) Customers (6) Contract with 。 028 0.030 (13) 0,016 (20) 0.030 (15) 0.019 (19) 0.022(18) Supp1iers (19)、間
。
gm gω
=3 a r Distribution 0,028 0.015 (18) 。 019 (18) 0.018 (17) 0.031 (12) 。但 5(7) Right (19) C∞perauon 0.032 0.031 (12) 0.018 (19) 0.017 (18) 0.022 (17) 0.030 (15) Contract (16) Agr目ment 0.030 with (17) 0,018(17) 0.015 (21) 0.022 (16) 0.023 (16) 0 個2 (9) ShareholdersChiao Da Managemenl Review Vol. 29 No. 2, 2009 151
E
Company's 。師3 0.039 (8) 0.082 (2) 0.036 (13) 0.0制 (3) 0.032 (14) Reputation (3) Customer's 0.039 0.018 (17) 0.029 (13) 0.018 (17) 。 ω0(2) 0.041 (11) Loyalty (12) Business 0.034 0.060 (6) 0.025 (15) 0.014 (19) 。。“ (6) 0.035 (12) Culture (14) Trademark 0.029 0.012 (19) 0.022 (17) 0.008 (20) 0.044 (9) 0.019 (19) (18)5.3 Reliability and Validity
Our results in this section can be deemed trustworthy. Regarding the reliabili旬, this research uses intemal consistency reliability as the testing method.
The CI and the CR of AHP are also applied to estimate the intemal consistency
reli的ility. The inequations, C.l 歪 0.1 and C.R 主 0.1 , are used to test the reliability ofthe questionnaire. In addition, the questionnaire meets the theoretical requirements with acceptable intemal ∞nsistency reliability
The validity is concemed with both nomological validity and content
validity. Since this research integrates theories from other researchers (mainly
Kala
“
t and Low, 2001), while developing the questionnaire on different levels,the contents ofthe questionnaire should be reasonable in terms of the nomological
叫 idity. Furthermore, under the review of sever剖 experts and scholars, the
constructs and criterion are affirmed to have a c1ear expression and to effectively
measure the objectives. Thus, the questionnaire should have a certain degree of content validity
6.
The Aoalysis of Virtual CaseAfter obtaining the ideal weights of intangible assets survey by AHP, the
VIKOR method can be used to assess the way in which the distribution of specific
company's intangible assets is diverged 合om the ideal 5甘ucture; th肘, this
assessment can serve as a helpful reference for business valuation while
encountering business mergers and acquisitions. Particularly,自e VIKOR method
152 C0l1s1rucling and Employing the Appraising Model 01 Jnla咚ibleAssets
results with better quality. This research takes IC foundry industry as a virtual
case to simulate an empirical 個alysis based on the research results for this
indus甘y conducted in the previous section
6.1 The Description of Empirical Analysis Design
It is assumed that the intangibles of n companies in a certain industry are
evaluated based on the ideal weights of 22 criteria in Table 7 in order to obtain the
effective values of each ∞mpany. These companies' effective values are
conducted by the larg缸-the-better method of grey relational analys 時, and each
company' s best and worst e仟ective value on every criterion are generated by the
VIKOR
method. Finally, the distribution of evaluated ∞mpanJ郎, intangibles isassessed in order to rank their performance on the management of intangible
卸的 in this specific indus叮 ln the
VIKOR
method,
the 叫 ueQ
,
could be the indicator of m句。rity rule with bigger parameter v (v > 0.5 )的 opposed tominority rule with smaller v. Hence, the decision maker can adjust v according to
the need, and usually v = 0.5
6.2 The Virtual Case Analysis
The study takes IC foundry industry with the highest tumover in Hsinchu
Science Park as an application case to the resulted intangible asset 台ame derived
from the previous section. We invite five experts who are the mutual consultants
of five selected IC foundry companies as the evaluators of the distribution of
these intangibles in firms. The 5 consultants are the experts of
“
innovation andtechnology, " “management capability, " “employee capability," “customer
relationsh恥" and
“
goodwill" respectively. They are also quite aware of the actualarrangement of the five categories of intangibles for these evaluated companies.
Hence, through the expert questionnaire, the five experts are invited to assess the
allocation of intangible assets for the five companies in different noted aspects.
The effective values for the 22 criteria are the larger the better; thus, the
larger-the-better method is adopted to conduct the five companies' data of each
criterion (see Table 8). The S
,
and R,
value of the five evaluated companiesChiao Da Managemenl Review Vol. 29 No. 2, 2009 153
eva1uation values are over 0.5, which means the three compani郎, dis甘ibution of
intangible as凹的 is more efficient or more competitive than others in the industry (see Table 10)
6.3 Summary
This study takes IC foundry industry as an example to integrate theory and practice in order to demonstrate the applicability of the proposed evaluation model, as well as further comparing the proposed eva1uation method with traditional method (simple average weight). Through the ∞mparison, we find the
d能rence between the two methods (see Table 11); that 芯, company 1 and
company 3 have opposite priorities. Evaluated company 1, 3 and 4's VIKOR values and simple average weight (SA W) va1ues are over 0.5 and 80, respectively However, it is hard to distinguish good and bad among the eva1uated ∞mpanles
sm∞ the five evaluated companies seem fine on the performance of intangible
assets in terms of their SA W va1ues approximately 80. In contras
t,
VIKOR method can c1early identify the difference in these evaluated companies because甘le VIKOR values of company 2 and company 5 are lower th徊。 5. In addition, applying VIKOR method to rank not only avoids the bias of minority rule but reflects the most optima1 viewpoints of majority rule
7. Conclusions and Suggestions
This paper has ∞nstructed a tentative model for the evaluation of intangible assets, which helps businesses avoid bias due to mainly relying on financial statements when measuring an entity's va1ue. In view ofthe significant proportion of intangible assets over total assets in high-technology industries, this research then uses six industries and a virtua1 case in Hsinchu Science Par
k,
Taiwan as 郎research objects in order to test the applicability of its model, as well as exploring the va1ue weights of intangible assets and its eva1uation among different high-technology industries. According to the execution of the above research, we,
154 Constructing and Employing the Appraising Model olIntangible Assets
Table 8
The Best and Worst Effective Values for Evaluated Companies
Effective value
Itemlcriterion Company Company Company Company Company
f
j,
-2 3 4 5 Kcy Technology 75 80 88 85 70 88 70 R&D Capability 90 80 85 85 70 90 70 Manufacturing 90 86 85 87 70 90 70 proc自S Service proc自S 90 84 85 85 70 90 70 Patenting 90 80 85 85 70 90 70 A且et Management 50 60 70 80 90 90 50 臼戶bility Inten祖JControl 90 88 85 85 80 90 80 Capabili秒 句erationQt凶ity 90 80 85 85 80 90 80 C得ability Technology 90 70 85 85 80 90 70 UpdateCapahlity
、‘"E。自
<3 1 Employ間's R&D 80 60 85 86 80 86 60 Employ間's 90 80 80 88 80 90 80 Jnnovationi
Employee's 90 82 85 85 80 90 80 Knowledge Employ間's 90 50 80 89 80 90 50 Training Con甘act W1世1 90 80 80 89 80 90 80E
ω
門
。
eE司
司
cus阻m=
。C白L COI1個ct W1白 90 83 80 80 85 90 80 Suppli=ijM
…
95 70 85 90 80 95 70 C∞P自由on 85 90 85 75 70 90 70 C四1甘act Agreement wi血 88 85 70 50 90 90 50 Sharehold= Company's 90 90 90 75 85 90 75 Re醉l扭扭on。主
Customer's 95 75 90 90 70 95 70 Loyalty Busin自sC叫叫起 90 90 90 70 90 90 70 Trademark 75 90 70 80 85 90 75155
Chiao Da Management Review Vol. 29 No. 2, 2009
and
Company 5 Table 9
Values for Evaluated Companies
Company 4 Company 3 Company 2
R
,
Company S,
The 0.095 0.063 0.051 0.066 0.071 。 705 。 390 。 380 。 586 。 168 0.095 0.024 0.010 0.000 0.071 Key Technology 0.063 0.016 0.016 0.032 0.000 R&D Capability Manufacturing Process 0.000 0.008 0.010 0.006 0.041 戶口口。〈胸口。 DmwS 已 → onFD 。一。個詞 0.035 0.009 0.009 0.011 0.000 Service Process 0.044 0.011 0.011 0.022 0.000 0.000 0.011 0.022 0.032 0.043 0.048 0.059 0.028 0.014 0.014 0.055 0.000 Asset Management Capabi1ity lntemal Control Capability Operation Quality Capability Technology Update 生且也包 Employee's R&D Patenting 0.024 0.030 0.024 0.030 0.010 0.059 0.000 0.000 玄 gamg2 月 nmWHumwgzq 0.015 0.000 0.003 0.066 0.015 0.046 0.009 0.046 0.046 0.000 0.040 0.020 0.020 0.032 0.000 0.008 0.001 0.008 0.033 0.000 0.051 0.005 0.051 0.051 0.000 0.014 0.028 0.028 。 020 0.000 Emp1oyee's Innovation Emp1oyee's Knowledge Employee's Z型型且 Contract with Customers Con甘actwith Suppliers 開呂立。〕 Eo nmw 們Moz--q 0.017 0.006 0.011 0.028 0.000 。 032 0.024 0.008 0.000 0.008 0.000 0.030 0.015 0.004 0.002 0.021 。 .063 。 .000 0.000 0.000 Cooperation Contract Agreement with Shareholders Company's Reputation Customer's Loyalty Distribution Right 的巴巴。 2 月間已 EEDω 玄可 街口已〉 =-mDno 。。。已'之三 0.039 0.008 0.008 0.031 0.000 0.000 0.034 。.000 0.000 0.000 Busine品 Culture 0.010 items!evaluated ∞mp卸y/evaJuation criteria
-R,
• S,
0.019 0.039 0.000 0.029 Trademark156 Construcling and Employing Ihe Appraising Model 01 Jnlangible Assels
TablelO
The Evaluation ResuIt by the VIKOR Method
Ev叫且扭d companyl evaluation 1.0 。 9 0.8 。 7 0.6 。 5 0.4 0.3 0.2 。 l result and rankJv Company 1 1.0∞ 0.955 。.909 。.864 。 818 0.773 (2) 。 727 0.682 0.636 。.591 Company 2 0.222 。 241 。 261 。 281 。 301 。 321(4) 0.341 。 361 0.381 0.401 Company 3 0.913 0.905 。 897 0.889 0.881 0.873 0.865 。.858 0.850 0.842
。(610)
4 Company 4 0.5
99 0.6ω 0.601 0.602 0.603 (3) 0.606 0.607 0.608 。.609Company 5 0 個到 。“)() 。“)() 。“)() 0.0∞ 。 α)() o.仗)() o.仗沁 。。∞ o.叫)()
且
Table 11
The Evaluation Methods and the Comparison
Evaluated companyl
evaluation methodl VIKOR (v~0.5) Traditional Evaluation Me曲。d
evaluation value and rank:ing (Simple Average Wei阱。
Company 1 。 773 (2) 86.1(1)
Company 2 。 321 (4) 78.6(4)
Company 3 0.873 (1) 83.8(2)
Company 4 0.604 (3) 83.1(3)
Company 5 0.000 (5) 78.3(5)
7.1
The Hierarchization ofValue DriversThe financialliterature presents several altematives for the intangible assets
valuation. One such altemative is based on the discounted cash flow method.
Through such criterion, the intangibles valuation may be described by at least fo叮
steps, which are as follows: (J) the total cash flow forecast (financial and
economical results), (2) the identi日cation and separation of tangible assets, (3) the
intangible a泌的“hierarchyzatioI丸" and (4) the discount value of the intangible
assets cash flow, with the appropriate cost of capital rate that reflects its risk level.
Chiao Da Management Reνiew Vol. 29 No. 2, 2009 157
procedure involves subjective analysis that may considerably influence the results
of the valuation process. The concem of the subjectivism may be softened by
applying the AHP method when determining the hierarchy of the value drivers.
The pu中ose of this study is to show the application of the AHP method as a
supporting instrument for the intangible assets valuation process. AHP allows
quantitatively
“
hierarchizing" non-financial value drivers7.2 The Ideal Distribution Structure of Intangible Assets
The resulted weights in the structure of intangible asset evaluation cons仕ucted
by this research represent the expected intangible asset dis甘ibution structure in each
industry. Based on the resulted intangibles s甘uctu間, the same indus虹y management
may accomplish research among the decision maJ峙的“ to qualitatively eval阻te
several value drivers inside a ∞mpany's context in order to establish a reference for
reso叮ce distribution regarding business managerial decision making and,
如吋祖口nore, to properly manage and accumulate its intangible assets
7.3 The Improvement ofValues-Based Management
Value Based Management (VBM) is the management approach 也at ensures
∞rporations are managed consistently on value. VBM is dependent on 出e corporate
purpose and the corporate value埠. As noted, the ∞rporate p山pose can either be
economic (shareholder value) or can also aim at other constituents dire芯tly
(stakeholder value). Evidence reveals that, under the culture of values-based
management, employees can make better decisions with authorization and work more
efficiently in their team due to the complete devotion, risk taking, and sharing of
owner百hip ofwork by 目ch employee. 切1e values-based management can, therefore,
∞mbine employees' interests with 叫ue and profitlloss in business. Fur也ermore, the
improper value management cannot provide the entity with clear objective direction
Thereafter, in order to maintain long-term business value, decision makers should
realize the correct direction and coming challenges for the enterprise (Kelso and
Adler, 1958). Ac∞ rding to the analysis and mock demonstration in this paper,
indus師的 or even firms can more closely understand their s甘.engths and weakness in
158 Constructing and Employing the Appraising Model o/Intangible Assets
improvement in order to ass叮'e sustainable business value.
7
.4 Attributes o
fI
ntangible AssetsOur empirical research reflects that intangible asset at甘ibutes that technology
industries emphasize 訂e different. For example, IC foundry, communication,
computer and peripherals, optoelec甘onic, and precision machinery industries think
highly of“key technology,"“R&D capability," and “employee R&D" criterion so
as to accord with 甘le ch訂acte吋 stics of pursuing innovation and fast development in
high-tech ind凶甘ies. Biotechnology indus旬, on the other hand, considers the criterion of “asset management capability," “operation quality capability,"
“technology update capability,"“patents," and “employee R&D" critical because
the indus甘y faces higher R&D risks and unce巾inty. However, most of the technology indus制的 through our survey reveal that their
“
key technology" is the intangible asset criterion of the first or second rank. As a result, the dimensions andcriterion of this research model can be viewed as a character reference of evaluating
the high-tech intangible assets. More importantly, the value weights are coordinated
m自由e at甘ibutes and needs of each industry in order to achieve diversity and
solidity in appraising the intangible assets. Besides
,
the refe叮ed weights can help anentity formulate decisions for the p叮poses of mergers and acquisitions, with the
addition ofthe calculation of economic value-added (EVA) ofbusiness, the genuine
intangible asset values can be more completely valuated
7.5 Support ofBusiness Evaluation
Traditionally
,
in the merging pr∞ess, a merged company has an intangiblevalue estimaled through the market and the book value of its 甜甜This is due 10 the
fact tha
t,
usually, the inability of the merging p討ce to reflect the genuine value of themerged firm ∞mes from the. simple concem of the ∞mpany book value instead of
∞V叮ing the intangibles. The VIKOR method applied in this study can be employed
to estimate candidale merged ∞mpanies by merging ∞mpanles,的 exempli自己din
the virtual case, in order ωobtain more objective b的iness evaluation Îrlformation
than it derived 企om financial stalement. However, in the real world, it is di伍cult 10 find experts who understand the arrangement of intangible assets in each evaluated
Chiao Da Management Reνiew Vol. 29 No. 2, 2009 159
∞mpany unless the evaluated ∞mpanies are not so many. Therefore, it is suggested
that the merged company 囚的 the VIKOR me曲。d to selιeval凶.te. With the use of
weight s仙cture delivered by the AHP and VIKOR meth吋s applied in 血is paper, the
merged finn can carry out the selιevaluation, which can assist in traditional 自nancial
valuation, in order to proceed with a win-win situation for both sides of the merger
case by reaching a more reasonable merging price.
8. Future Research Directions
In spite of the fact that our research model cannot thoroughly resolve all
problems of intangible asset evaluation, none of the related literatures reach the
consensus of the evaluation method. Nevertheless, the appralsmg model of
intangible assets constructed by this research, which is based on mult卜 level and
multi-criterion methods and with the approval of 118 professional executives, is
said to be useful as a temporary reference for technology industries to plan and
execute their intangible asset evaluation. On the other hand, it is advisable to
expand the indus訂y domain in future research, such as the comparison of
intangible attributes and formations between technology industry and
conventional industry; moreover, we can even make transnational comparisons,
for instance, in terms of the same industry between nations. 00 national policies
or ∞mpetitiveness have impacts on the relative weights of these intangible value
drivers? If the answer is yes, what are the intents of the influence? These issues
deserve further discussions and exploration in the 缸ture
9. References
Chan, L. K. C., Lakonishok, J. and Sougiannis, T. (2001),“The Stock Market
Valuation of Research and Development Expenditures, " Journal 0/
Finance, 56(6), 2431-2456.
160 Const月Icfingand Employing fhe Appra山ng Model
0/
Jn的ngibleAssefsor/and Process Optimization Using the Grey Rational Analysis, " Journal of
Grey System, 3, 235-260.
Chiu, Y. J. and Chen, Y. W. (2007). “Using AHP in Patent Valuation"
Mathematical and Computer Modelling, 46(7-8), 1054-1062
Deng, J. (1990), A Course on Grey 秒'stem Theo吵, Wuhan, China: HUST Press
Dubin, J. A. (2007),“Valuing 1ntangible Assets with A Nested Logit Market
Share Model, " Journal of Econometrics, 139(2),285-302.
Feltham, G. A. and Ohlson, J.A. (1995), “Valuation and Clean Surplus
Accounting for Operating and Financial Activities, " Contempormγ
Accounting Research, 11 (2), 689-731.
Hamel, G. (1991),
Wl此thin lnt紀ema剖tlωona叫1 Strategic Alliances, " Strategic Management Journal,
12(Surnmer)
,
83-103Johnson, L. D., Neave, E. 旺, and Pazder恤, B. (2002),“泌的wled阱, lnnovation and
Share Value,叮'nternationalJournal of Management Reviews, 4(2), 101-134.
Johnson, W. H. A. (1999),“An lntegrative Taxonomy of lntellectual Capital:
Measuring the Stock and Flow of lntellectual Capital Components in the
Firm, " Jnternational Journal ofTechnology Management, 18(5), 562-575.
Kalafut, P. C. and Low, J. (2001), “The Value Creation lndex: Quantifying
Intangible Value," Strategy & Leaders峙, 29(5), 9-15.
Kaplan, R. S. and Norton, D. P. (2004), “Measuring the S甘ategic Readiness of
lntangible Assets, " Harvard Business Review , 82(2),但 -63
Kayo, E. K. (2002), Capital Structure and Risk of Tangible and Jntangible-intensive Companies: A Contribution of Stu咚ling of Firm
Valuation, PhD Dissertation, University ofSao Paulo.
Kel鉤, L. O. and Adler, M. J. (1958), The Capitalist Mani戶sto, New York, NY: Random House
Kotler, P. (2003), Marketing Management: Ana加旬, Planni嗯, lmplementation,
and Control, 11 th ed., Upper Saddle River, NJ: Prentice-Hall Inc.
Lev, B. (2001), lntangibles: Management, Measurement and Reporting,
Washingt凹, DC: Brookings
Chiao Da Managemenl Review Vol. 29 No. 2, 2009 161
Barriers, " Journal of Business Ethic芯,的 (1 ),的 -105 回
Luthy, D. H. (1998),“lntellectual Capital and Its Measurement, " in Proceedings
。f the Asian Pacific lnterdisciplinary Research in Accounting Conference (APlRA) Osaka, Japan.
Mathis, R. L. and Jackson, J. H. (2003), Human Resource Management,
Cincinnati, Ohio: South-Western College Pub.
Opricovic, S. (1998), Multi-criteria Optimization of Civil Engineering Systems,
Belgrade, Yugoslavia: Faculty ofCivil Engineering
Opricov此, S. and Tzeng, G. H. (2002), “Multicriteria Planning of Post-Earthquake Sustainable Reconstruction, " Computer-Aided Civil and Infrastructure Engineering, 17(3), 211-220.
Opricovic, S. and Tzeng, G. H. (2004), “Compromise Solution by MCDM Methods: A Comparative Analysis of VIKOR and TOPSlS, " European Journal ofOperational Rω earch, 156(2),445-455.
Opricovic, S. and Tzen皂, G. H. (2007), “Extended VIKOR Method in Comparison with Outra放1月 Methods, " European Journal of Operational Research, 178(2), 514-529
Saaty, T. L. (1980), The Analytic Hierarchy Process, New York, NY McGraw-Hill.
S詞句, T. L. (1996), Decision Making with Dependence and Feedback: The
Analytic Network Process, Pittsburgh, PA: RWS Publications.
Stewart, T. A. (1999), The Intellectual Capital: The New Wealth of Organization, New York, NY: Doubleday.
Sveiby, K. E. (1997), The New Organization Wealth: Managing and Measuring, San Francisco, CA: Berrett-Koehler.
Sveiby, K. E. (2002),“Methods for Measuring Intangible Assets," Working Paper,
Hanken Business School, Helsinki, Finland
William, S. (2001), “On-Line Professional Development for Ohio's K-12 Educators: A Key to Student Success on The Ohio Graduation Test,"
presented to The National Association of Science Teachers Regional Meeting (SECO), February 16, 2001, Association of Science Teachers Regional Meeting (SECO), February 16,2001