國 立 交 通 大 學
材料科學與工程學系
博 士 論 文
氮化鋁與鈦介面相的生成機構與微觀結構的演變
Phase Formation Mechanisms and Microstructural Evolution of
the AlN/Ti Interface between 1000
oand 1500
oC
研究生
: 邱家祥
指導教授
: 林健正 教授
氮化鋁與鈦介面相的生成機構與微觀結構的演變
Phase Formation Mechanisms and Microstructural Evolution of
the AlN/Ti Interface between 1000
oand 1500
oC
研 究 生 : 邱家祥 student : Chia-Hsiang Chiu 指導教授 : 林健正 Advisor : Chien-Chang Lin
國立交通大學 材料科學與工程學系
博士論文
A Thesis
Submitted to Department of Materials Science and Engineering National Chiao Tung University
in partial Fulfillment of the Requirements for the Degree of
Doctor of Philosophy in
Materials Science and Engineering June 2008
Hsinchu, Taiwan, Republic of China
氮化鋁與鈦介面相的生成機構與微觀結構的演變 研究生 : 邱家祥 指導教授 : 林健正 國 立 交 通 大 學 材 料 科 學 與 工 程 學 系 摘 要 本研究係利用解析式掃描式電子顯微鏡(SEM/EDS)與穿透式電子顯微鏡 (TEM/EDS),深入分析不同熱處理溫度的介面微觀結構,並利用Ti-Al-N平 衡相圖以及擴散路徑圖,探討AlN與Ti介面微觀結構的演化及生成機構。 AlN與Ti介面處反應主要是由於AlN中的Al與N原子經擴散進入Ti側,而造 成在Ti側產生一系列的氮化物與鋁化物。AlN與Ti經1000oC之擴散反應,
δ-TiN首先生成在介面處,而α2-Ti3Al會在δ-TiN/Ti介面處產生。隨熱處理時
間 增 加 , τ1-Ti3AlN 會 在 δ-TiN 反 應 層 中 生 成 , 其 方 位 關 係 為
TiN AlN Ti − − δ τ //[111] ] 111
[ 1 3 與(110)τ1−Ti3AlN //(110)δ−TiN 。隨著N原子擴散進入α2-Ti3Al,
δ-TiN與雙晶結構α2-Ti3Al(N)會在α2-Ti3Al反應層中生成。當N原子進入
α2-Ti3Al 的 八 面 體 間 隙 位 置 , 會 造 成 τ1-Ti3AlN 的 生 成 而 形 成 兩 相 區
(τ1-Ti3AlN+α2-Ti3Al) , 其 方 位 關 係 為 [111]τ1−Ti3AlN //[0001]α2−Ti3Al(N) 與 ) ( 3 2 3 1 //(1120) ) 1 1 0 ( τ−TiAlN α −TiAl N 。 AlN與Ti金屬經1300℃擴散反應,其反應生成物從AlN側至Ti側依序為 δ-TiN、τ2-Ti2AlN、τ1-Ti3AlN、α2-Ti3Al,與兩相區(α2-Ti3Al+α-Ti)。在兩相
Al Ti -Ti - //(1100) 2 3 00) 1 (1 α α 。在1400℃反應下,反應生成物τ1-Ti3AlN逐漸消失,而
γ-TiAl與層狀結構(γ-TiAl+α2-Ti3Al)生成,其中層狀結構(γ-TiAl+α2-Ti3Al)的
方位關係為[011]γ−TiAl //[2110]α2−Ti3Al與(111)γ−TiAl//(0110)α2−Ti3Al。比較1500℃與1400℃ 反應後反應區的差異,並未發現γ-TiAl的存在。
為了進一步研究N原子對於AlN/Ti介面所造成的影響,進行氮化鋁與鈦金屬 (箔)在1400℃的擴散反應,可發現γ-TiAl逐漸受到N的影響而產生fiber-like τ2-Ti2AlN 。 γ-TiAl 與 τ2-Ti2AlN 的 方 位 關 係 為 [011]γ−TiAl //[1120]τ2−Ti2AlN 與
AlN Ti TiAl //(1103) 2 2 ) 1 1 1 ( γ− τ − 。隨著τ2-Ti2AlN的生成而釋放出Al原子,使γ-TiAl變成富
鋁相的Ti3Al5。此外在α-Ti(Al, N)受到氮化而形成兩相區(α-Ti+δ-TiN),α-Ti
Phase Formation Mechanisms and Microstructural Evolution of the AlN/Ti Interface between 1000o and 1500oC
Student : Chia-Hsiang Chiu Advisors: Prof. Chien-Cheng Lin Department of materials science and Engineering National Chiao Tung
University, Hsinchu, Taiwan
Abstract
The diffusional reaction between aluminum nitride (AlN) and titanium (Ti) was carried out isothermally in argon at temperatures ranging from 1000o to 1500oC. The microstructural characterization and phase development were investigated using analytical scanning electron microscopy (SEM) and analytical transmission electron microscopy (TEM), both attached with an energy-dispersive spectrometer (EDS).
It is well known that the decomposition of AlN and the diffusion of Al and N atoms into Ti gave rise to various reaction layers at the interface. After annealing at 1000oC, a δ-TiN layer was initially formed in the reaction zone between AlN and Ti, and the α2-Ti3Al layer subsequently developed between
δ-TiN and Ti. Then an intergranular τ1-Ti3AlN phase was formed in the δ-TiN
layer with the orientation relationships [111]τ1−Ti3AlN //[111]δ−TiN and
TiN AlN Ti − − δ τ //(110) ) 0 1 1 ( 3
1 . The further diffusion of N atoms into the α2-Ti3Al layer
led to the growth of δ-TiN and a twinned α2-Ti3Al(N) solid solution, wherein N
atoms went to one of the octahedral interstitial sites in an orderly manner upon cooling, resulting in the formation of τ1-Ti3AlN. The orientation relationships
) ( 3 2 3 1 //(1120) ) 1 1 0 ( τ−TiAlN α −TiAl N .
After annealing at 1300oC, an interfacial reaction zone, consisting of TiN, τ2-Ti2AlN, τ1-Ti3AlN, α2-Ti3Al, and a two-phase (α2-Ti3Al + α-Ti) region in
sequence, was observed in between AlN and Ti. The α2-Ti3Al region revealed
equiaxed and elongated morphologies with
[
0001]
equiaxed //[ ]
1100elongated and( )
1010 equiaxed //( )
1122 elongated. In the two-phase (α2-Ti3Al + α-Ti) region, α2-Ti3Aland α-Ti were found to satisfy the following orientation relationship:
Al Ti Ti 3 2 ] 0001 [ // ] 0001 [ α− α − and -Ti -TiAl 3 2 00) 1 //(1 00) 1
(1 α α . The γ-TiAl and a lamellar
two-phase (γ-TiAl+α2-Ti3Al) structure, instead of τ1-Ti3AlN, were found in
between τ2-Ti2AlN and α2-Ti3Al after annealing at 1400oC. The orientation
relationship of γ-TiAl and α2-Ti3Al in the lamellar structure was identified to be
as follows: [011]γ−TiAl //[2110]α2−Ti3Al and TiAl
TiAl //(0110) 2 3 ) 1 1 1 ( γ− α − . Compared with
the reaction zone after annealing at 1400ºC, the γ-TiAl was not found at the interface after annealing at 1500oC.
In the other respective, AlN was bonded with a titanium foil at 1400ºC for up to 1 h in Ar. It was noted that the diffusion of N atoms into the reaction zone played an important role to the microstructural development at the AlN/Ti/AlN interface. The diffusion of N atoms into the reaction zone led to the precipitation of a chopped fiber-like τ2-Ti2AlN in the matrix of γ-TiAl, with
AlN Ti TiAl //[1120] 2 2
] 110
[ γ− τ − and (111)γ−TiAl //(1103)τ2−Ti2AlN, by substituting N atoms for
one-half Al atoms after annealing at 1400oC for 1 h. The released Al atoms, due to the precipitation of τ2-Ti2AlN, resulted in an ordered Al-rich γ-TiAl or
Ti3Al5. Furthermore, the α-Ti (Al, N) was nitridized into a lamellar layer
The microstructural development at the AlN/Ti interface is elucidated with the aid of the Ti-Al-N ternary phase diagram and a modified Ti-Al binary phase diagram. Finally, diffusion paths are proposed for the interfacial reactions at various stages.
誌謝 在博士班研究生涯中,首先最感謝我的指導教授林健正博士的指導與鼓 勵,在研究方向、實驗方法、同時在待人處世的態度方面,亦使我受益良 多,使我能順利完成博士學位,更衷心感謝諸位口試委員對本論文的指正 與建議。 同時感謝實驗室一起奮鬥的夥伴,對我的砥礪與協助。另外更感謝所有 幫助與關心我的朋友們。 更感謝阿瑤的陪伴與鼓勵,讓我的研究所的生活多采多姿,沒有你我的 研究所的回憶將不會這麼甜美。 最後我要特別感謝我的父母,多年來辛苦的教導與栽培,並且長久在我 背後默默支持與關懷,不時地給予我鼓勵,使我能順利完成學業。 謹以此篇論文,獻給所有曾協助過我的師長與朋友們。
CONTENTS page Chapter 1 Introduction... 1 1.1 Introduction... 1 1.2 Literature Data ... 2 1.3 Thesis Outline ... 3
Chapter 2 Microstructural Development of the AlN/Ti Diffusion Couple Annealed at 1000oC... 8
2.1 Introduction... 8
2.2 Experimental Procedures ... 11
2.3 Results and discussion ... 12
2.4 Conclusions... 21
Chapter 3 Microstructural Characterization and Phase Development at the Interface between Aluminum Nitride and Titanium after Annealing at 1300o–1500oC... 30
3.1 Introduction... 30
3.2 Experimental Procedure... 33
3.3 Results and Discussion ... 34
3.4 Conclusions... 45
Chapter 4 Formation Mechanisms and Atomic Configurations of Nitride Phases at the Interface of Aluminum Nitride and Titanium... 56
4.1 Introduction... 56
4.2 Experimental Procedures ... 58
4.3 Results and Discussion ... 60
4.4 Conclusions... 66
Chapter 5 Summary... 74
References... 76
List of Tables
page Table 1. 1. Ti-Al crystal structure and lattice parameter data ... 5 Table 1. 2. Ti-N crystal structure and lattice parameter data... 6 Table 1. 3. Ti-Al-N crystal structure and lattice parameter data ... 7 Table 2. 1. Summary of some previous studies on the AlN/Ti interfacial
reactions... 22 Table 3. 1. New phases formed in the interfacial reaction zone of AlN/Ti
List of Figures
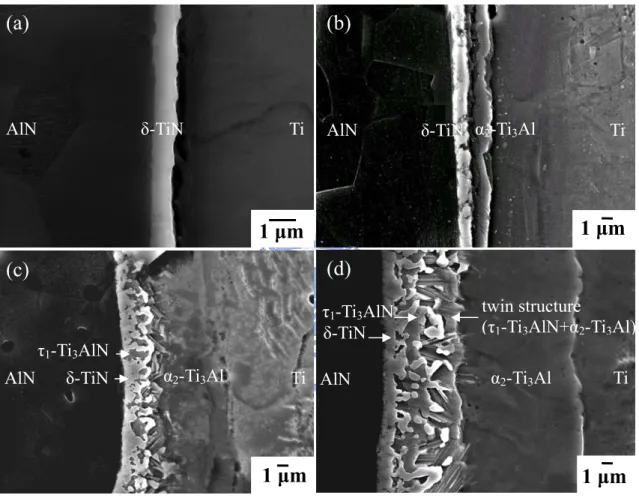
page Fig. 2. 1. SEM micrographs showing the AlN/Ti interfaces after annealing at 1000 oC for (a) 0.1 h; (b) 0.5 h; (c) 3 h; (d) 36 h, respectively... 23 Fig. 2. 2. (a) A bright field image of the residual δ-TiN phase in τ1-Ti3AlN
after annealing at 1000°C/10 h; (b) an SADP of δ-TiN, z=[111]; (c) an SADP of τ1-Ti3AlN, z=[111]; (d) the SADPs of τ1-Ti3AlN and
δ-TiN, showing the orientation relationships of
TiN AlN Ti − − δ τ //[111] ] 111
[ 1 3 and (110)τ−TiAlN //(110)δ−TiN
3
1 ; (e) the EDS
spectrum of δ-TiN; (f) the EDS spectrum of τ1-Ti3AlN... 24
Fig. 2. 3. After annealing at 1000oC/10 h: (a) the bright field image of the (τ1-Ti3AlN + α2-Ti3Al) twinned structure; (b) the SADPs of
τ1-Ti3AlN (z=[1101]) and α2-Ti3Al (z=[011]) with the orientation
relationships [011]τ1−Ti3AlN //[1101]α2−Ti3Al and (100)τ1−Ti3AlN //(1102)α2−Ti3Al ;
(c) the schematic illustration of the SADPs in (b) (●: α2-Ti3Al
matrix, ○: α2-Ti3Al twin, Δ: τ1-Ti3AlN); (d) the SADPs of
τ1-Ti3AlN (z=[111]) and α2-Ti3Al (z=[0001]) with the orientation
relationships [111]τ1−Ti3AlN //[0001]α2−Ti3Al and
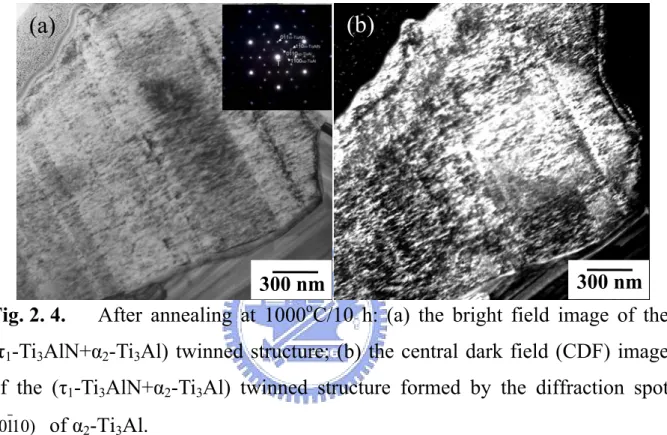
Al Ti AlN Ti3 2 3 1 //(1120) ) 1 1 0 ( τ − α − . ... 25 Fig. 2. 4. After annealing at 1000oC/10 h: (a) the bright field image of the
(τ1-Ti3AlN+α2-Ti3Al) twinned structure; (b) the central dark field
(CDF) image of the (τ1-Ti3AlN+α2-Ti3Al) twinned structure
formed by the diffraction spot (0110) of α2-Ti3Al. ... 26
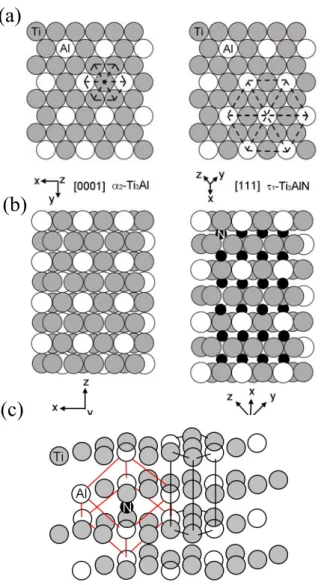
Fig. 2. 5. (a) Crystal structures of α2-Ti3Al and τ1-Ti3AlN projected along the
Al Ti3
] 0001
[ α− or [111]τ1−Ti3AlN direction; (b) the stacking sequence of
closely packed planes viewed along [0110]α2−Ti3Al or [121]τ1−Ti3AlN; (c) the lattice relationship of the cubic τ1-Ti3AlN (red line) and the
hexagonal α2-Ti3Al (black line)... 27
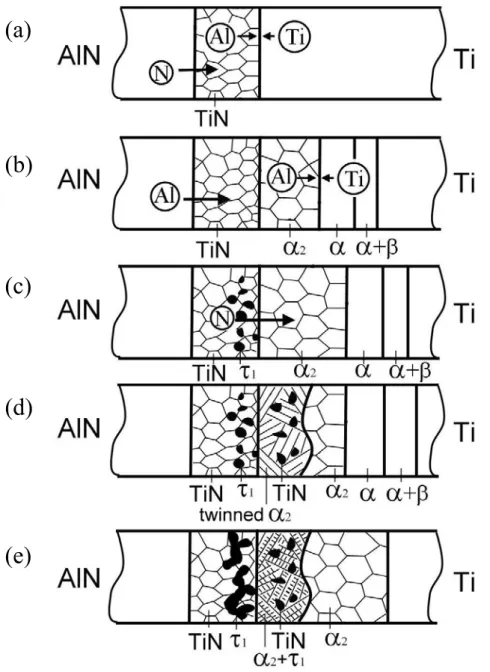
Fig. 2. 6. Microstructural development in the AlN/Ti diffusion couple after annealing at 1000oC for 0.1-36 h; (a) formation of the δ-TiN layer; (b) formation of the α2-Ti3Al layer and various titanium aluminides;
(c) formation of τ1-Ti3AlN in the δ-TiN layer; (d) formation of
δ-TiN and twinned α2-Ti3Al due to the nitridization of the α2-Ti3Al
layer; (e) formation of (τ1-Ti3AlN+α2-Ti3Al) twinned structure
during cooling... 28 Fig. 2. 7. (a) An isothermal section of the Ti-Al-N system at 1000oC, and
the diffusion paths (path 1: A-B-C-H for 0.1h; path 2: A-B-C-G-H for 0.5h; path 3: A-B-C-D-E-F-G-H for 36h); (b) Schematic microstructure at the AlN/Ti interface on annealing at 1000oC/36h; (c) Schematic microstructure of the AlN/Ti interface after cooling.
... 29 Fig. 3. 1. SEM micrographs of the interface between AlN and Ti after
annealing at: (a) 1300°C/36 h; (b) 1400°C/36 h; (c) 1500°C/36 h.48 Fig. 3. 2. (a) BF image of the AlN/Ti interface after annealing at 1300°C for 3 h; (b) SADP of TiN, Z=[001]; (c) SADP of τ2-Ti2AlN, Z=[1120];
and (d) SADP of τ1-Ti3AlN, Z=[001]... 49
Fig. 3. 3. After annealing at 1300°C for 3 h: (a) BF image of the equiaxed α2-Ti3Al (abutting the τ1-Ti3AlN layer in Fig. 3.1(a)); (b) BF image
of the elongated α2-Ti3Al (abutting the two-phase (α2-Ti3Al + α-Ti)
layer in Fig. 3.1(a)); (c) Variation in the grain size of the equiaxed α2-Ti3Al along the direction from the AlN side (bottom) to the Ti
side (top); (d) SADP of both elongated and equiaxed α2-Ti3Al,
showing the orientation relationship of
[
0001]
equiaxed //[ ]
1100elongated and( )
1010 equiaxed //( )
1122 elongated . ... 50(α2-Ti3Al + α-Ti) region in Fig. 3.1(a); (b) DF image of α2-Ti3Al
from the
( )
1120Ti3Al diffraction spot; (c) Superimposed SADPs obtained from the two-phase (α2-Ti3Al + α-Ti) region, showing theorientation relationship of [0001]α−Ti //[0001]Ti3Al and
Al Ti Ti - //(1100) 3 00) 1
(1 α ; (d) Schematic illustration of α-Ti and α2-Ti3Al
crystals structure. ... 51 Fig. 3. 5. (a) BF image of γ-TiAl between the τ2-Ti2AlN and the lamellar
structure after annealing at 1500°C/0.5 h; (b) BF image of the lamellar two-phase (γ-TiAl + α2-Ti3Al) structure; (c) Superimposed
SADP’s of γ-TiAl (Z = [011]) and α2-Ti3Al (Z = [2110]) from the
lamellar structure region, and the orientation relationship of γ-TiAl and α2-Ti3Al was identified to be as follows: [011]TiAl //[2110]Ti3Al and
Al Ti TiAl //(0110) 3 ) 1 1 1
( ; (d) Schematic illustration corresponding to the SADP’s in (c)... 52 Fig. 3. 6. (a) Isothermal section of the Ti-Al-N phase diagram at 1300oC.30
The diffuse path was drawn as arrows; (b) the microstructure of an AlN/Ti diffusion couple at 1300oC; (c) the microstructure of an AlN/Ti diffusion couple after cooling. ... 53 Fig. 3. 7. A modified Ti-Al phase diagram because of the stabilization of α-Ti by dissolving N (see the dashed line), showing the cooling processes of the various aluminides after annealing at 1300oC (lines 1-3 ) and at 1400°C (lines 4 and 5). The increase in the α Æ β transformation temperature has been exaggerated for clarification.
... 54 Fig. 3. 8. Proposed reaction mechanisms of the AlN and Ti diffusion couple
annealed at 1300oC: (a) first stage: formation of TiN; (b) Second stage: formation of τ1-Ti3AlN, α-Ti(Al, N)+β-Ti(Al, N), and
formation of α2-Ti3Al and/or the two-phase layer (α2-Ti3Al + α-Ti)
during cooling. (τ1: Ti3AlN; τ2: Ti2AlN; α2:Ti3Al; α: hexagonal
Ti(Al, N); β: cubic Ti(Al, N)). ... 55 Fig. 4. 1. Secondary electron images showing the interfacial microstructures
of the AlN/Ti/AlN specimens: (a) after annealing at 1400oC/0.1 h; (b) after annealing at 1400oC/1 h [A: δ-TiN, B: τ2-Ti2AlN, C:
τ2-Ti2AlN+γ-TiAl+Ti3Al5, D: a lamellar structure (δ-TiN+α-Ti), E:
α-Ti]. (c) A magnified secondary electron image of reaction layer C in Fig. 1(b) showing a chopped fiber like τ2-Ti2AlN in the
(Ti3Al5+γ-TiAl) matrix; (d) a magnified secondary electron image
of reaction layer D showing a lamellar structure of (δ-TiN+α-Ti). All specimens were etched by the Kroll reagent... 68 Fig. 4. 2. (a) The isothermal section of the Ti-Al-N phase diagram at 1400oC and (b) the Ti-Al binary phase diagram... 69 Fig. 4. 3. (a) A bright field image showing a residual γ-TiAl grain embedded in τ2-Ti2AlN after annealing at 1400oC/1 h; (b) the alternating (001)
layers of Ti and Al viewed along the direction [110] in γ-TiAl; (c) the stacking sequence AB’ABAB’AB… of the (0001) layers viewed along the direction
[ ]
1120 in τ2-Ti2AlN. ... 70Fig. 4. 4. (a) A bright field image showing the precipitation of τ2-Ti2AlN in
the matrix of Ti3Al5+γ-TiAl, taking place in reaction layer C in Fig.
4.1(b) after annealing at 1400oC/1 h; (b) the superimposed selected area diffraction patterns (SADPs) of τ2-Ti2AlN and a two-phase
(Ti3Al5+γ-TiAl), showing the orientation relationships
AlN Ti TiAl//[1120]2 2
] 110
[ γ− τ − and (111)γ−TiAl//(1103)τ2−Ti2AlN... 71
Fig. 4. 5. After annealing at 1400oC/1 h: (a) a bright field image of the modulated structure of Ti3Al5+γ-TiAl; (b) the superimposed SADPs
a central dark field image of Ti3Al5+γ-TiAl formed by the 1/4(100)
superlattice diffraction of Ti3Al5, as marked by a circle in Fig. 4.5
(b)... 72 Fig. 4. 6. (a) A bright field image of the lamellar structure (δ-TiN+α-Ti) after annealing at 1400oC/1 h; (b) the SADPs of δ-TiN (Z=[110]δ−TiN) and
α-Ti (Z=[1120]α−Ti); (c) the schematic illustration of the SADPs in
(b); (d) the atomic configuration at the δ-TiN/α-Ti interface viewed along the [110]δ−TiN or [1120]α−Ti direction. The TEM specimen
was acquired from a cross-sectional SEM specimen along the direction perpendicular to the precipitate using FIB... 73
Chapter 1 Introduction 1.1 Introduction
Aluminum nitride (AlN) shows a wide range of engineering applications, including piezoelectric, optical, semiconducting, structural, and/or mechanical purposes. It belongs to a group of the hexagonal wurtzite structure with the 6mm symmetry. Among these group III nitrides, AlN has a wide band gap and has a variety of potential applications. It is a hard material with bulk hardness similar to quartz about 20 GPa. Pure AlN is chemically stable to attack by atmospheric gases at temperatures less than 700°C. The combination of these mechanical and chemical properties has stirred a considerable interest in practical applications of AlN in both bulk and thin film forms. These applications include use in integrated circuit packaging, ignition modules, r.f./microwave packages, heat sinks, cutting tools, and laser diode heat spreaders.1, 2
AlN exhibits a very good resistance with respect to a wide variety of materials. It is wetted by molten Al but does not react with it. Most metals, including Cu, Li, U, ferrous alloys and some superalloys, do not attack AlN. In spite of the obvious scientific and technological importance, interdiffusional reactions at AlN ceramic/metal interfaces have not been subjected to an extensive study. Among all the metals, reactions between Ti and AlN arouse the greatest interest due to the high affinity of Ti to both aluminum and nitrogen, and the stability of the resultant titanium aluminides and nitrides. This work focuses on the phase formation mechanisms and phase development of the AlN-Ti interfaces.1, 2
applications, for example, in package, in composites, in coating or joining technology. The reliability of these systems depends on the interfacial properties between the ceramic and metal, e.g. adhesion properties and thermal stability. Therefore a better understanding of the reaction at these interfaces is of essence. In order to optimize the joining technique, the knowledge of the interfacial reactions occurring between AlN and Ti during joining is of great importance.
1.2 Literature Data
The solubility of nitrogen in Al(s) and Al(l) is very small. Only one compound AlN exists in the Al-N binary system.
The equilibrium phases in the Ti-Al system are: the disordered solution phases, liquid, α-Ti, β-Ti, and Al, and the ordered intermetallic compounds, α2-Ti3Al, which
has an ordered hexagonal close-packed superlattice structure, γ-TiAl and TiAl3,
both of which have an ordered face-centered cubic (fcc)-based superlattice structure. Crystal structure data on the Ti-Al binary phases are summarized in Table 1.1.
The solubility of nitrogen both in (α-Ti) and (β-Ti) is significant. The congruently melting δ-TiN1-x compound with wide homogeneity range and incongruently
melting Ti2N compound exist in this binary system. Crystal structure data on the
Ti-N binary phases are summarized in Table 1.2.
Three compounds (τ1-Ti3AlN, τ2-Ti2AlN and τ3-Ti3Al2N2) are formed in this system.
τ1-Ti3AlN which exhibits a negligible range of homogeneity has a cubic structure.
observed to exist over the temperature range from 700-1600oC. τ3-Ti3Al2N2 is
stable only in a narrow temperature range between 1250o and 1400oC with hexagonal structure. Crystal structure data on the Ti-Al-N ternary phases are summarized in Table 1.3.3-6
1.3 Thesis Outline
The present work focuses on the phase evolution and formation mechanism between AlN and Ti at 1000o-1500oC using analytical scanning electron microscopy (SEM) and analytical transmission electron microscopy (TEM), both attached with an energy-dispersive spectrometer (EDS). All these results, obtained at elevated temperatures, can be explained on the basis of the ternary Ti-Al-N phase diagram and the diffusion paths that connect the phases formed by the reaction between AlN and Ti.
Chapter 2 studies the morphologies, crystal structures, chemical compositions, and formation mechanisms of various formed phases in the AlN/Ti interface after annealed at 1000oC for various periods. The twinned α2-Ti3Al(N) solid solution
and τ1-Ti3AlN are first found to exist in the α2-Ti3Al layer after annealing, and
studies their relationships.
Chapter 3 describes the phase formation mechanisms at the AlN/Ti interface after annealed at temperatures ranging from 1300o to 1500oC. The distinct microstructures were found at the AlN/Ti interface after annealing. The microstructural evolution at the AlN/Ti interface can be explained with the aid of Ti-Al-N phase diagram and a modified Ti-Al binary phase diagram.
Chapter 4 will further discuss the effect of nitridization at the AlN/Ti interface after annealing. It was found that the microstructure in the AlN/Ti interface strongly
depended on the inward diffusion of N. The phase transformation mechanisms at the AlN/Ti interface are explained from the viewpoint of N atom inward diffusion into the Ti-Al reaction layers.
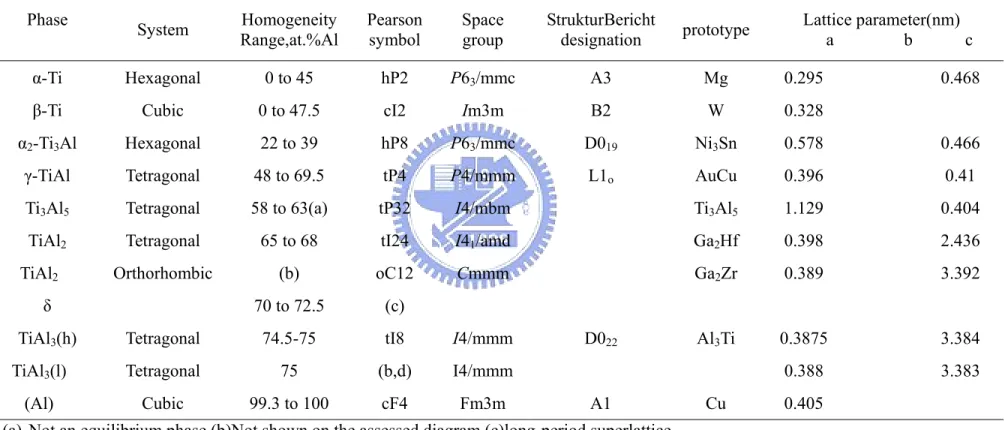
Table 1. 1. Ti-Al crystal structure and lattice parameter data.4, 5
Phase System Homogeneity Range,at.%Al Pearson symbol Space group StrukturBericht designation prototype Lattice parameter(nm) a b c α-Ti Hexagonal 0 to 45 hP2 P63/mmc A3 Mg 0.295 0.468
β-Ti Cubic 0 to 47.5 cI2 Im3m B2 W 0.328 α2-Ti3Al Hexagonal 22 to 39 hP8 P63/mmc D019 Ni3Sn 0.578 0.466
γ-TiAl Tetragonal 48 to 69.5 tP4 P4/mmm L1o AuCu 0.396 0.41
Ti3Al5 Tetragonal 58 to 63(a) tP32 I4/mbm Ti3Al5 1.129 0.404
TiAl2 Tetragonal 65 to 68 tI24 I41/amd Ga2Hf 0.398 2.436
TiAl2 Orthorhombic (b) oC12 Cmmm Ga2Zr 0.389 3.392
δ 70 to 72.5 (c)
TiAl3(h) Tetragonal 74.5-75 tI8 I4/mmm D022 Al3Ti 0.3875 3.384
TiAl3(l) Tetragonal 75 (b,d) I4/mmm 0.388 3.383
(Al) Cubic 99.3 to 100 cF4 Fm3m A1 Cu 0.405 (a) Not an equilibrium phase.(b)Not shown on the assessed diagram.(c)long-period superlattice
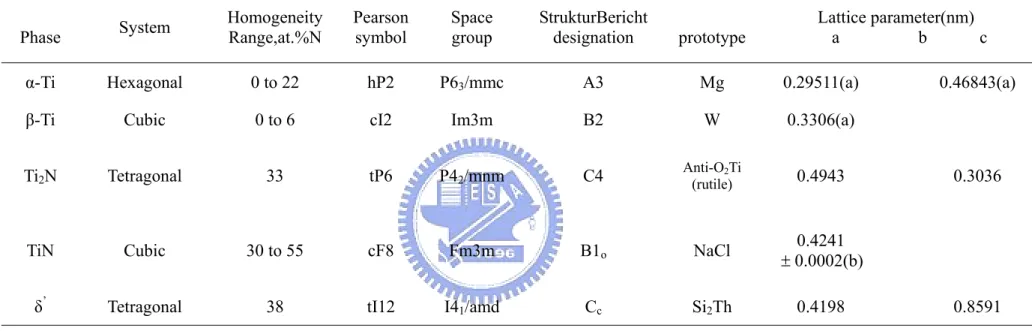
Table 1. 2. Ti-N crystal structure and lattice parameter data.4 Phase System Homogeneity Range,at.%N Pearson symbol Space group StrukturBericht designation prototype Lattice parameter(nm) a b c
α-Ti Hexagonal 0 to 22 hP2 P63/mmc A3 Mg 0.29511(a) 0.46843(a)
β-Ti Cubic 0 to 6 cI2 Im3m B2 W 0.3306(a)
Ti2N Tetragonal 33 tP6 P42/mnm C4 Anti-O(rutile) 2Ti 0.4943 0.3036
TiN Cubic 30 to 55 cF8 Fm3m B1o NaCl ± 0.0002(b) 0.4241
δ’ Tetragonal 38 tI12 I41/amd Cc Si2Th 0.4198 0.8591
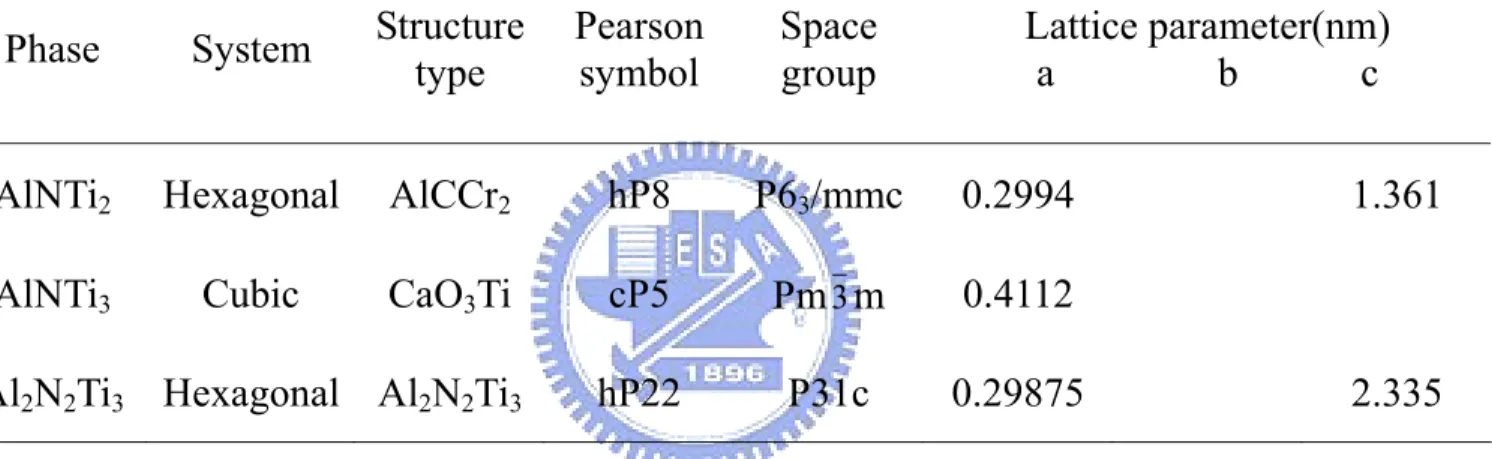
Table 1. 3. Ti-Al-N crystal structure and lattice parameter data.3
Phase System Structure type Pearson symbol Space group Lattice parameter(nm) a b c AlNTi2 Hexagonal AlCCr2 hP8 P63/mmc 0.2994 1.361
AlNTi3 Cubic CaO3Ti cP5 Pm3m 0.4112
Chapter 2 Microstructural Development of the AlN/Ti Diffusion Couple Annealed at 1000oC
2.1 Introduction
A low dielectric constant and good thermal dissipation are the two most important requirements for electronic packaging materials, since small modern VLSIs are operated at high power and high speed. AlN has been used as a replacement for alumina in electron packaging applications because it can fulfill these requirements.7-9 Highly reactive Ti has been used as an interlayer because of good wetting and adhesion between Cu and AlN, while retaining a ductile layer to minimize residual stresses that are caused by the difference in thermal expansion coefficients.10-12
The reaction mechanisms and products at the AlN/Ti interface mentioned previously were inconsistent or conflicting because of variations in reactant types, annealing conditions, and methods of analysis. Table 2.1 summarizes some experimental results on the AlN/Ti interfaces.12-22 As was noted, previous investigations were focused on the reaction of AlN with Ti thin film or foil.12, 14, 17,
18 Pinkas et al.14 demonstrated that TiAl
3, ε-Ti2N, α2-Ti3Al, and α-Ti(Al) solid
solutions were formed in sequence at the Ti(film)/AlN interface after annealing at 600oC for 1-10 h. Imanaka and Notis12 noted that τ2-Ti2AlN was formed at the
Ti(film)/AlN interface after annealing at 800°-950°C. El-Sayed et al.17 found δ-TiN, τ1-Ti3AlN and α2-Ti3Al at the Ti(foil)/AlN interface after annealing at
1050o-1200oC for 2-20 h in a vacuum. After annealing at 1200oC for 11 h, the Ti foil (20 μm) was completely consumed, and another ternary compound, τ2-Ti2AlN,
τ1-Ti3AlN were present in the reaction zone after AlN/Ti(150 μm)/AlN sandwiched
specimens were annealed at 1000°C for 200 h in a vacuum.
Several researchers have investigated the AlN/Ti interfacial reactions in bulk or powder.18, 20, 21, 23 Paransky et al.20, 21, 23 found that δ-TiN, τ1-Ti3AlN and α2-Ti3Al
were formed between AlN (powder) and Ti (powder) after annealing at 900°-1100°C for 1-40 h. A lamellar (α2-Ti3Al + τ1-Ti3AlN) layer was observed
between τ1-Ti3AlN and α2-Ti3Al after annealing at 1000º or 1100°C. Han et al.18
observed δ-TiN, τ1-Ti3AlN and α2-Ti3Al after the mixtures of AlN and Ti powders
(AlN:Ti = molar ration of 1:2) were annealed at 1000°C for 200 h under vacuum. However, the crystallographic relationships and mechanisms of phase transformation among these phases have not yet been fully explored.
As Table 2.1 indicates, x-ray diffraction (XRD) and scanning electron microscopy/energy dispersive spectrometry (SEM/EDS) are most frequently used to investigate the AlN/Ti interface. However, chemical SEM/EDS analyses and crystallographic XRD analyses are based on microscopic and macroscopic scales, respectively.20 In addition, SEM/EDS analysis is complicated by the coexistence of several binary and ternary phases with similar compositions (Ti3AlN, Ti3AlN1-x,
Ti2AlN, Ti2N, and TiN1-x) and by the overlap of titanium L and nitrogen K spectral
series.20 As a result, the combination of XRD and SEM/EDS does not allow for full characterization of the AlN/Ti interface.
Recently, Paransky et al.8-10 investigated the AlN-Ti interface using the electron backscatter diffraction (EBSD) attached to the SEM. One major advantage of the EBSD technique is its ability to provide crystallographic information which is supplementary to traditional SEM/EDS analyses. However, the EBSD can only
be operated over a very limited range of incident angles, and cannot provide resolution on a submicron scale, such as a fine precipitate and/or a fine lamellar structure at the AlN-Ti interface.
Selected electron diffraction patterns can be conducted over a wide range of incident angles and on a submicron scale using a transmission electron microscope (TEM). Since TEM/EDS can provide simultaneous microstructural observation, crystallographic and compositional analyses with good resolution, it is a much more effective tool for microstructural characterization than methods such as SEM/EDS, XRD, and EBSD. However, TEM/EDS has only been applied to the investigation of the AlN/Ti interface in very few studies12, 14 since it is very challenging to prepare the cross-sectional TEM specimens.
Recently, Chiu and Lin proposed the phase formation mechanisms in the AlN/Ti diffusion couple at 1300º-1500°C based on microstructural characterization using TEM/EDS and SEM/EDS.22 An interfacial reaction zone, consisting of δ-TiN, τ2-Ti2AlN, τ1-Ti3AlN, α2-Ti3Al and a two-phase (α2-Ti3Al + α-Ti) region in
sequence, was observed in the AlN/Ti diffusion couple after annealing at 1300ºC. The γ-TiAl and a lamellar two-phase (γ-TiAl + α2-Ti3Al) structure were present
between τ2-Ti2AlN and α2-Ti3Al after annealing at 1400oC, while no γ-TiAl was
present at the interface after annealing at 1500oC.
In this work, TEM/EDS was utilized to examine the phase evolution of the interfacial reaction zone between AlN and Ti after annealing at 1000ºC for 0.1-36 h in an Ar atmosphere. The interfacial reactions for various periods are described in terms of diffusion paths, which are depicted in an isothermal Al-N-Ti ternary phase diagram. The crystallographic relationships and phase transformation
mechanisms of δ-TiN, τ1-Ti3AlN and α2-Ti3Al are also elucidated.
2.2 Experimental Procedures
AlN plates (SH-15, with a nominal composition of 62.8 % Al, 32.1 % N, 3.4 % Y, 1.7 % O, Tokuyama Soda Corp., Tokyo, Japan) and commercially pure Ti billets (99.7% purity, Alfa Aesar, Ward Hill, MA) were cut into pieces with dimensions of approximately 15 × 10 × 4 mm. Using a precision polishing machine (Model Minimet 1000, Buehler Ltd., Lake Bluff, IL), all of the pieces were ground with a 15 μm diamond matted disc and then polished with 3 μm diamond paste and a 1 μm alumina suspension. After they were rinsed ultrasonically in an acetone bath and distilled water, the sandwiched samples, with the Ti metal placed between two pieces of AlN, were annealed under a low pressure of 2 MPa at 1000oC for various periods in an atmosphere of argon (with O2 < 1 ppm, H2O < -76 ppm/oC and N2 < 3
ppm).
A slice with a thickness of approximately 300 μm was cut from each annealed sample perpendicular to the interface of AlN and Ti. The slice was then ground and polished down to a thickness of 80~100 μm following the standard metallographic procedures described above. Each metallographic sample was etched using the Kroll reagent (10 ml HF + 30 ml HNO3 + 60 ml H2O) for
SEM/EDS analyses. The cross-sectional slab was further thinned to a thickness of 20~30 μm by dimpling, and was finally argon-ion-milled at 5 kV and 20 μA for TEM/EDS analyses.
The AlN/Ti interfacial microstructures were characterized using a transmission electron microscope (Model 2000FX, JEOL, Tokyo, Japan) and a scanning electron microscope (Model JSM-6500, JEOL, Tokyo, Japan), both equipped with an
ultra-thin window EDS detector (Model 9900, EDAX International, Prairie View, IL). The Cliff–Lorimer standardless technique was applied to analyze the compositions of various phases at the thin edge of the TEM samples.
2.3 Results and discussion
(1) Microstructures of the AlN/Ti interface
Figure 2.1 illustrated the variation in the interfacial microstructures of AlN and Ti after annealing at 1000°C for various periods. Figure 2.1(a) presented the secondary electron image (SEI) of the cross section of the AlN/Ti interface after annealing at 1000°C/0.1 h, revealing that the reaction zone consisted of one well-defined reaction layer, which was identified as δ-TiN with less than 2 at.% Al in solid solution. A similar result was also demonstrated in previous works.24, 25 Figure 2.1 (b) displayed the interfacial reaction zone of AlN/Ti after annealing at 1000°C/0.5 h, indicating the presence of δ-TiN and α2-Ti3Al at the AlN/Ti interface.
Some investigations13, 14, 26 have reported that δ-TiN and TiAl3 are initially formed
at the AlN/Ti interface after annealing between 600º and 800oC. Pinkas et al.14 investigated the early stage of interface reactions between AlN and Ti thin films at 600oC for 1-10 h, indicating that the phase sequence was AlN/TiAl3/Ti2N/Ti3Al/α-(Ti, Al)ss. However, TiAl3 was not observed in the
reaction zone between AlN and Ti after annealing at 1000oC/0.5 h, as shown in Fig. 2.1(b). Figure 2.1(c) revealed that the insular τ1-Ti3AlN began to precipitate in the
δ-TiN layer after annealing at 1000°C/3 h. The τ1-Ti3AlN in the δ-TiN layer
became interconnected during annealing at 1000°C/36 h, as displayed in Fig. 2.1(d). Moreover, the twinned structure (τ1-Ti3AlN + α2-Ti3Al) and insular δ-TiN were
present at the interface between δ-TiN and α2-Ti3Al after annealing at 1000°C/36 h.
The insular δ-TiN grains, mentioned above, appeared as the brightest phase in Fig. 2.1(d). It was believed that the formation of the twinned structure (τ1-Ti3AlN +
α2-Ti3Al) and insular δ-TiN was caused by the nitridization of the α2-Ti3Al layer, as
discussed below in detail. The comparison between Figs. 2.1(c) and (d) revealed that the δ-TiN layer hardly grew at the AlN/Ti interface at 1000oC, although the thickness of the α2-Ti3Al layer increased with annealing time.
According to the Ti-Al-N ternary phase diagram at 1000oC, ternary compounds such as τ1-Ti3AlN and τ2-Ti2AlN exist in the equilibrium system. Han et al.18
reported that the formation energies of τ1-Ti3AlN and τ2-Ti2AlN at 1000oC were
-360 and -323 kJ/mol, respectively, revealing that their formation was thermodynamically favorable. Magnan et al.27 indicated that α2-Ti3Al could be
nitridized to τ1-Ti3AlN upon annealing at 1000oC, and τ1-Ti3AlN was gradually
replaced by τ2-Ti2AlN with time. However, no τ2-Ti2AlN was found in this study.
Only limited Al and N atoms diffused through δ-TiN to react with α2-Ti3Al in the
AlN/Ti diffusion couple. This prohibited the further formation of any Al and N rich phase, e.g., τ2-Ti2AlN, in the AlN/Ti diffusion couple.
As mentioned above, τ1-Ti3AlN was formed at the grain boundaries of the δ-TiN
layer during annealing at 1000°C/3 h [Fig. 2.1(c)], and became interconnected during annealing at 1000°C/36 h [Fig. 2.1(d)]. Figure 2.2(a) revealed that the residual δ-TiN was embedded in the growing τ1-Ti3AlN during annealing at
1000°C/10 h, suggesting that the τ1-Ti3AlN grew as the δ-TiN layer was consumed.
The lattice parameter of τ1-Ti3AlN deviated from that of δ-TiN by less than 3% (a =
4.24 nm for δ-TiN and a = 4.11 nm for τ1-Ti3AlN). The selected area diffraction
patterns (SADPs) of τ1-Ti3AlN and δ-TiN were distinguished by whether the
superlattice diffractions were present in the SADPs, as shown in Figs. 2.2(b) and (c). No superlattice diffractions such as (110) and (101) were present in the SADPs of the δ-TiN with the NaCl-like structure, while the SADPs of the
τ1-Ti3AlN were typical (001)* patterns for the pervoskite-like structure, revealed by
the superlattice diffractions (100), (010), (110) and others. The SADPs in Fig. 2.2(d) revealed that the orientation relationships of δ-TiN and τ1-Ti3AlN were
TiN AlN Ti − − δ τ //[111] ] 111 [ 3
1 and (110)τ1−Ti3AlN //(110)δ−TiN . Both δ-TiN and τ1-Ti3AlN could
be discernible based upon elemental quantitative analyses using TEM/EDS because δ-TiN dissolved a very limited amount of Al (≈ 0.3 at.%) and τ1-Ti3AlN contained
approximately 20 at.% Al, as shown in Fig. 2.2(e) and (f), respectively. From the crystallographic viewpoint, the phase transformation from δ-TiN to τ1-Ti3AlN can
be understood as follows: one Ti atom (at a corner) in a unit cell of δ-TiN was replaced by Al and three N atoms (at the octahedral interstitial sites) were evolved, based upon the following chemical reaction.
4δ-TiN + Al → τ1-Ti3AlN + 3N + Ti (1)
Paransky et al.20, 21, 23 alleged that a lamellar structure was present at the interface between AlN and Ti powders after annealing at 900º-1100oC for 1-40 h, revealing that the τ1-Ti3AlN phase precipitated from supersaturated α2-Ti3Al with N in solid
solution during cooling. However, Fig. 2.3(a) revealed that the system existed as a twinned rather than lamellar structure after annealing at 1000°C/10 h. Figure 2.3(b) displayed the superimposed SADPs of α2-Ti3Al (Z=[1101]) and τ1-Ti3AlN
(Z=[011]), with the electron beam in the edge-on direction of the twin plane
Al Ti3 2 ) 1 1 01
( α − . The twinned structure was implied by the streaking of the diffraction
spots along the direction perpendicular to the twin plane and the presence of extra spots symmetrical with respect to the twin plane in the SADPs, as shown in Fig. 2.3(b). For clarity, the superimposed SADPs in Fig. 2.3(b) were redrawn and indexed in Fig. 2.3(c). The superimposed SADPs, shown in Figs. 2.3(b) and (d),
clearly illustrated that the twinned structure contained two phases, identified as hcp ordered α2-Ti3Al and cubic τ1-Ti3AlN, respectively, and that they were orientated
with the relationships [111]τ1−Ti3AlN //[0001]α2−Ti3Al and (011)τ1−Ti3AlN //(1120)α2−Ti3Al.
Figures 2.4(a) and (b) presented the bright field image (BFI) and central dark field image (CDFI), respectively, of the twinned structure as shown in Fig. 2.3(a). The bands of the twin and the matrix were somewhat discernible while comparing Figs. 2.4(a) and (b) with Fig. 2.3(a). The central dark field image was formed by the diffraction spot
(
0110)
of α2-Ti3Al such that the α2-Ti3Al phase appeared bright inFig. 2.4(b). Two phases appeared to be present and the chopped fiber-like α2-Ti3Al was aligned with τ1-Ti3AlN in the direction perpendicular to the twin
plane.
The mechanism of phase transformation from α2-Ti3Al to τ1-Ti3AlN could be seen
with the help of Fig. 2.5. The ordering of N atoms was responsible for the formation of τ1-Ti3AlN. At high temperatures, α2-Ti3Al could dissolve a
significant amount of N atoms, which occupied one of the octahedral interstitial sites of α2-Ti3Al in an orderly manner during cooling. The crystal structures of
α2-Ti3Al and τ1-Ti3AlN were hexagonal and pervoskite, respectively. The most
closely packed {0001} planes of α2-Ti3Al and the most closely packed {111}
planes of τ1-Ti3AlN were parallel based on the SADPs in Fig. 2.3(d). The {0001}
interlayer distance of hexagonal α2-Ti3Al was calculated as c/2 or 0.233 nm, while
the {111} interlayer distance of cubic τ1-Ti3AlN was calculated as the diagonal
length 3a divided by 3 or 0.237 nm. The equality of their closely packed interlayer distances was consistent with the crystallographic relationships mentioned above. The closely packed planes of α2-Ti3Al and τ1-Ti3AlN, lying in
the plane of the paper, could be seen in Fig. 2.5(a) along the [0001]α2−Ti3Al or AlN Ti3 1 ] 111
[ τ − , while the stacking sequences of closely packed planes in Fig. 2.5(b) were viewed along [0110]α2−Ti3Al or [121]τ1−Ti3AlN. Although Ti and Al atoms were
not redistributed during the phase transformation, N atoms were inserted between two neighboring closely packed planes. Figure 2.5(c) presented the crystallographic relationships between pervoskite τ1-Ti3AlN (red line, with Al
atoms at corners, Ti at face-center positions and N at body-center positions) and hexagonal α2-Ti3Al (black line), indicating that N atoms occupied one of the
octahedral interstitial sites of α2-Ti3Al in an orderly manner during cooling.
(2) Microstructural development of the AlN/Ti interface
The microstructural development at the AlN/Ti interface at temperatures from 1300° to 1500°C has been described elsewhere.22 Very different microstructures were obtained after annealing at 1000°C, and the reactions and phase formations at the interface between AlN and Ti at 1000ºC are described in the following sections.
(a) Stage 1: formation of the δ-TiN layer
The formation mechanism of the δ-TiN layer has been described in a previous study,22 and is again schematically illustrated in Fig. 2.6(a). According to the Ti-N binary phase diagram,4 α-Ti is stable with up to 23 at.% N in solid solution at 1000°C, beyond which there exists a two-phase (α-Ti + δ-TiN) region in the range of 23 – 30 at.% N. This implies that the δ-TiN is not formed until more than 23 at.% N is dissolved in α-Ti at 1000°C. The δ-TiN phase, with an NaCl-like structure, has a non-stoichiometric composition (designated as δ-TiN1-x) in the wide
range of 30-55 at.% N. The δ-TiN layer can be thought of as a nitrogen sponge that responds to diffusing nitrogen atoms in the same way as a sponge responds to
water. Essentially, the δ-TiN layer can also be regarded as a “trap” or a “garbage can” for nitrogen atoms at this stage, explaining why the δ-TiN layer growth at the AlN/Ti interface is not evident at 1000oC.
(b) Stage 2: formation of the α2-Ti3Al layer
Since the solubility of Al in δ-TiN is rather limited, Al atoms are not dissolved in the δ-TiN layer but diffuse through the δ-TiN layer into Ti, resulting in the formation of α2-Ti3Al between δ-TiN and Ti in the second stage, as displayed in Fig.
2.6(b). Excess Al atoms may proceed further beyond the α2-Ti3Al layer into Ti,
forming an α-Ti(Al) solid solution and probably a two-phase region (α-Ti + β-Ti), according to the Ti-Al-N ternary phase diagram.25 While Al or N atoms diffuse into β-Ti (A2, bcc) during annealing at 1000oC, the dissolution of up to 5 at.% Al and/or N atoms makes α-Ti (A3, hcp) relatively stable with respect to β-Ti. The α2-Ti3Al grows if more than 23 at.% Al is dissolved in α-Ti at 1000ºC.
(c) Stage 3: formation of τ1-Ti3AlN in the δ-TiN layer
Following the formation of α2-Ti3Al, some Al atoms tend to accumulate at the
δ-TiN grain boundaries and then react with δ-TiN to form τ1-Ti3AlN, as shown in
Fig. 2.6(c). The τ1-Ti3AlN gradually becomes continuous over a long period.
The formation of intergranular τ1-Ti3AlN in δ-TiN is given by chemical reaction (1)
mentioned above.
The aluminization of the δ-TiN layer gives rise to the formation of intergranular τ1-Ti3AlN accompanied with the exsolution of nitrogen. The τ1-Ti3AlN is
expected to be generated by the nitridization of the α2-Ti3Al layer previously
formed, but in this stage, the formation obviously proceeds through a different mechanism.
(d) Stage 4: formation of δ-TiN and twinned α2-Ti3Al(N) in the α2-Ti3Al layer
The excess nitrogen atoms, as described by reaction (1), diffuse into the α2-Ti3Al
layer and react with α2-Ti3Al to become the α2-Ti3Al(N) solid solution. As the
concentration of N atoms increases, the twinning of α2-Ti3Al(N) is triggered, as
shown in Fig. 2.3(a). The nitridization of α2-Ti3Al also generates δ-TiN in the
α2-Ti3Al layer, because nitrogen atoms have a high affinity to Ti atoms [Fig.
2.6(d)].
The small interstitial atoms, such as nitrogen and hydrogen, behave very similarly when they are dissolved in α2-Ti3Al. Xiao et al.28 stated that at 373-473 K,
deuterium was readily dissolved in α2-Ti3Al as a solid solution and that increasing
the deuterium concentration to D/α2-Ti3Al ≥ 0.18 caused the twinning of deuteride
with DO19. Additionally, δ-Ti3AlDx and twinned deuteride coexisted at
D/α2-Ti3Al ≥ 0.59. It is believed that the phase transformation induced by the
dissolution of N atoms in α2-Ti3Al corresponds to that induced by the dissolution of
deuterium in α2-Ti3Al. In this study, the twinned structure was first found in
literature at the AlN-Ti interface, and it is comparable to the twinned deuteride in α2-Ti3Al as D/α2-Ti3Al ≥ 0.59.
(e) Stage 5: formation of τ1-Ti3AlN in twinned α2-Ti3Al(N) during cooling
The high-temperature α2-Ti3Al(N) solid solution undergoes an incongruent phase
transformation or phase separation during cooling, yielding a high-N phase and a low-N phase. The N atoms in the low-N phase or α2-Ti3Al(N) are randomly
distributed in an hcp crystal structure, whereas the N atoms in the high-N phase or τ1-Ti3AlN occupy one of the octahedral interstitial sites in each unit cell.
τ1-Ti3AlN and α2-Ti3Al have very similar crystal structures, and their
composition of τ1-Ti3AlN (60.1 at.% Ti, 19.9 at.% Al, and 20.0 at.% N) differs
substantially from that of α2-Ti3Al(N) (71.5 at.% Ti, 23.2 at.% Al, and 5.3 at.% N).
Notably, the twinning of α2-Ti3Al occurs before τ1-Ti3AlN is formed, since the
twinning will not take place across different phases. Figure 2.6(e) schematically depicts the final microstructure developed at the AlN/Ti interface after cooling. (3) Diffusion path in the Ti-Al-N ternary phase diagram
The microstructural development at the AlN/Ti interface is related to the diffusion path in the isothermal section of the Al-N-Ti ternary phase diagram.29 Figure 2.7(a) presents three diffusion paths, represented by the arrowed lines on the isothermal Ti-Al-N phase diagram, in the AlN/Ti diffusion couple upon annealing at 1000oC for various periods. Based on the experimental results, when the diffusion couples of AlN and Ti are isothermally annealed at 1000oC, the diffusion paths associated with the compositions along the longitudinal direction perpendicular to the interface are proposed as follows: (a) A→B→C→H (path 1) for 0.1 h; (b) A→B→C→G→H (path 2) for 0.5 h, and (c) A→B→C→D→E→F→G→H (path 3) for 36 h. It is noted that all diffusion paths do not go through Ti2N based upon present results. A magnified section of
Ti-Al-N ternary phase diagram proposed by Schuster and Bauer259 are redrawn in the upper right hand corner of Fig. 2.7(a), indicating the coexistence of δ-TiN with τ1-Ti3AlN and/or α2-Ti3Al in an equilibrium state at 1000ºC. For the case of
annealing at 1000oC/36 h, the diffusion path crosses the fields AlN+δ-TiN, δ-TiN, δ-TiN+τ1-Ti3AlN, δ-TiN+τ1-Ti3AlN+α2-Ti3Al, δ-TiN+α2-Ti3Al, α2-Ti3Al,
α2-Ti3Al+α-Ti, α-Ti, β-Ti+α-Ti and β-Ti between AlN and Ti. The three-phase
region and the tie lines in the two-phase region correspond to the interface between the two reaction layers in the diffusion couple.
Figures 2.7(b) and (c) present the microstructures that developed in the AlN/Ti diffusion couples upon annealing at 1000oC/36 h and subsequent cooling, respectively. The connecting lines delineate the relationship between the microstructure [Fig. 2.7(b)] and the isothermal section of the Ti-Al-N phase diagram [Fig. 2.7(a)]. As displayed in Fig. 2.7(b), the layers of δ-TiN, δ-TiN + τ1-Ti3AlN, δ-TiN + twinned α2-Ti3Al, α2-Ti3Al and Ti (α-Ti, β-Ti + α-Ti, β-Ti, etc.)
were formed in sequence from AlN to Ti upon annealing at 1000oC/36 h. Figure 2.7(c) shows the final microstructure, indicating that the twinned α2-Ti3Al was
transformed to the (α2-Ti3Al+τ1-Ti3AlN) structure from the two phase region
(δ-TiN+α2-Ti3Al) during subsequent cooling. β-Ti and β-Ti+α-Ti were absent
between α2-Ti3Al and α-Ti after cooling, because β-Ti was transformed to α-Ti at
the phase transformation temperature (883oC) upon cooling. For other annealing periods, the relationship between microstructural development and diffusion path can be explained in a similar way.
Based upon the foregoing discussion, it was worth mentioning that some new findings were obtained in the present study. For an example, the phase transformation and orientation relations were definitely recognized between δ-TiN and τ1-Ti3AlN (or between α2-Ti3Al and τ1-Ti3AlN) at the AlN/Ti interface on
behalf of TEM/EDS works. For the first time, it revealed a twinned α2-Ti3Al
structure on annealing at 1000°C/10 h, while an ordered cubic τ1-Ti3AlN was
precipitated from the twinned α2-Ti3Al during cooling. This study also illustrated
the phase transformation mechanism from α2-Ti3Al to τ1-Ti3AlN due to the
2.4 Conclusions
1. The microstructures of various reaction layers in the AlN/Ti diffusion couples after annealing at 1000ºC were thoroughly investigated using analytical SEM and TEM.
2. In the initial stages, one δ-TiN layer was formed between AlN and Ti, and then a α2-Ti3Al layer was formed between δ-TiN and Ti.
3. As more Al atoms diffused into the δ-TiN layer, τ1-Ti3AlN was formed at the
grain boundaries of δ-TiN, together with the exsolution of nitrogen atoms. The orientation relationships of δ-TiN and τ1-Ti3AlN were identified as
TiN AlN Ti − − δ τ //[111] ] 111 [ 3
1 and (110)τ1−Ti3AlN //(110)δ−TiN.
4. The nitridization of the α2-Ti3Al layer due to the inward diffusion of the released
N gave rise to the formation of δ-TiN and a twinned α2-Ti3Al(N) solid solution
in the α2-Ti3Al layer upon annealing. The α2-Ti3Al(N) solid solution was
transformed to the chopped fiber-like τ1-Ti3AlN structure during subsequent
cooling. The orientation relationships of τ1-Ti3AlN and α2-Ti3Al in the twinned
structure were as follows: [111]τ1−Ti3AlN //[0001]α2−Ti3Al and (011)τ1−Ti3AlN //(1120)α2−Ti3Al.
5. Finally, the various stages of the interface reaction between AlN and Ti during annealing and cooling at 1000ºC were proposed. The microstructural development of the AlN/Ti interface was related to the diffusion path in the isothermal section of the Al-N-Ti ternary phase diagram.
Table 2. 1. Summary of some previous studies on the AlN/Ti interfacial reactions
Authors Type of samples Annealing conditions Analyzing instruments Reaction products References He et al. Ti thick film/AlN thin film or
substrate Annealing at 600º-800
oC for a short time XRD, XPS, RBS and TEM TiAl
3-TiN-Ti4N3-x-Ti2N 13
Imanaka and Notis Ti thin film/AlN substrate Annealing at 600º to 950oC for 2-30 min RBS, XRD and TEM Ti
2AlN 12
Pinkas et al. Ti thin film/AlN thin film Annealing at 600oC for 1-10 h in N
2 AES, XRD and TEM TiAl3-Ti2N-Ti3Al-α-(Ti, Al)ss
14
Yasumoto et al. Ti thin film/AlN substrate Annealing at 700º-950oC for 60 min XRD TiAl
3, Ti2N, TiN 15
Yue et al. Ti thin film/AlN substrate Annealing at 200º-850oC for 1-4 h SIMS, RBS and XRD TiN
0.3, Ti3Al2N2, Ti2AlN, Ti3Al, TiN and Ti2N
16
El-Sayed et al. Ti foil/AlN substrate Annealing at 1050º to 1200
oC for 2~20 h
in vacuum XRD, SEM and EPMA TiN-Ti3AlN-Ti3Al
17
Han et al. Ti foil and AlN bulk Annealing at 1000oC for 200 h SEM, XRD and EPMA TiN-Ti
3AlN 18
Han et al. Ti powder and AlN powder Annealing at 1000oC for 200 h SEM, XRD and EPMA TiN-Ti
3AlN-Ti3Al 18
Paransky et al. Ti powder and AlN powder Annealing at 900 and 1100oC for 1-40 h SEM/EDS/EBSD, XRD and EPMA TiN-Ti
3AlN-lamellar (Ti3AlN+Ti3Al)-Ti3Al
19-21
Paransky et al. Ti bulk and AlN bulk Annealing at 900 and 1100oC for 1-40 h SEM/EDS/EBSD, XRD and EPMA TiN-Ti
3AlN-lamellar (Ti3AlN+Ti3Al)-Ti3Al
21
Paransky et al. Ti powder and AlN bulk Annealing at 900 and 1100oC for 1-40 h SEM/EDS/EBSD, XRD and EPMA TiN-(Ti) Ak
21
Chiu and Lin Ti bulk and AlN bulk Annealing at 1300º-1500oC/0.5-36 h SEM/EDS and TEM/EDS TiN-Ti2AlN-Ti3AlN-Ti3Al-two phase (Ti3Al+Ti)
at 1300oC
TiN-Ti2AlN-TiAl-lamellar
(TiAl+Ti3Al)-Ti3Al-two phase (Ti3Al+Ti) at
1400oC
TiN-Ti2AlN- lamellar (TiAl+Ti3Al) -Ti3Al-two
phase (Ti3Al+Ti) at 1500oC
)
Fig. 2. 1. SEM micrographs showing the AlN/Ti interfaces after annealing at 1000 oC for (a) 0.1 h; (b) 0.5 h; (c) 3 h; (d) 36 h, respectively.
(a) δ-TiN AlN Ti 1 μm (c) Ti AlN δ-TiN α2-Ti3Al
τ1-Ti3AlN
1 μm
(b)
AlN Ti δ-TiN α2-Ti3Al
1 μm Ti AlN α2-Ti3Al τ1-Ti3AlN δ-TiN twin structure (τ1-Ti3AlN+α2-Ti3Al)
(d)
Fig. 2. 2. (a) A bright field image of the residual δ-TiN phase in τ1-Ti3AlN
after annealing at 1000°C/10 h; (b) an SADP of δ-TiN, z=[111]; (c) an SADP of τ1-Ti3AlN, z=[111]; (d) the SADPs of τ1-Ti3AlN and δ-TiN, showing the
orientation relationships of [111]τ−TiAlN //[111]δ−TiN
3
1 and (110)τ1−Ti3AlN //(110)δ−TiN; (e)
the EDS spectrum of δ-TiN; (f) the EDS spectrum of τ1-Ti3AlN.
0 2 4 6 8 10 0 200 400 600 800 1000 1200 1400 in te n s ity energy (keV) Cu Ti Ti N
(e)
0 2 4 6 8 10 0 200 400 600 800 1000 1200 1400 1600 1800 Al in te n s it y energy (keV) Cu Ti Ti N(f)
(c)
[111]τ1-Ti3AlN(b)
[111]δ-TiN(d)
[111]τ1-Ti3AlN//[111]δ-TiN
τ
1(a)
τ
1τ
1δ-TiN
300 nmFig. 2. 3. After annealing at 1000oC/10 h: (a) the bright field image of the (τ1-Ti3AlN + α2-Ti3Al) twinned structure; (b) the SADPs of τ1-Ti3AlN (z=[1101])
and α2-Ti3Al (z=[011]) with the orientation relationships [011]τ1−Ti3AlN //[1101]α2−Ti3Al
and (100)τ1−Ti3AlN //(1102)α2−Ti3Al; (c) the schematic illustration of the SADPs in (b) (●:
α2-Ti3Al matrix, ○: α2-Ti3Al twin, Δ: τ1-Ti3AlN); (d) the SADPs of τ1-Ti3AlN
(z= [111] ) and α2-Ti3Al (z= [0001] ) with the orientation relationships
Al Ti AlN Ti3 2 3 1 //[0001] ] 111 [ τ − α − and TiAlN Ti Al 3 2 3 1 //(1120) ) 1 1 0 ( τ − α − .
(d)
(c)
(b)
(a)
300 nmFig. 2. 4. After annealing at 1000oC/10 h: (a) the bright field image of the (τ1-Ti3AlN+α2-Ti3Al) twinned structure; (b) the central dark field (CDF) image
of the (τ1-Ti3AlN+α2-Ti3Al) twinned structure formed by the diffraction spot
) 10 1 0 ( of α2-Ti3Al.
(b)
(a)
300 nm 300 nmFig. 2. 5. (a) Crystal structures of α2-Ti3Al and τ1-Ti3AlN projected along the
Al Ti3
] 0001
[ α− or [111]τ1−Ti3AlN direction; (b) the stacking sequence of closely packed
planes viewed along [0110]α2−Ti3Al or [121]τ1−Ti3AlN; (c) the lattice relationship of the cubic τ1-Ti3AlN (red line) and the hexagonal α2-Ti3Al (black line).
(a)
(b)
Fig. 2. 6. Microstructural development in the AlN/Ti diffusion couple after annealing at 1000oC for 0.1-36 h; (a) formation of the δ-TiN layer; (b) formation of the α2-Ti3Al layer and various titanium aluminides; (c) formation of τ1-Ti3AlN
in the δ-TiN layer; (d) formation of δ-TiN and twinned α2-Ti3Al due to the
nitridization of the α2-Ti3Al layer; (e) formation of (τ1-Ti3AlN+α2-Ti3Al)
twinned structure during cooling.
(a)
(b)
(c)
(d)
Fig. 2. 7. (a) An isothermal section of the Ti-Al-N system at 1000oC, and the diffusion paths (path 1: A-B-C-H for 0.1h; path 2: A-B-C-G-H for 0.5h; path 3: A-B-C-D-E-F-G-H for 36h); (b) Schematic microstructure at the AlN/Ti interface on annealing at 1000oC/36h; (c) Schematic microstructure of the AlN/Ti interface after cooling.
Chapter 3 Microstructural Characterization and Phase Development at the Interface between Aluminum Nitride and Titanium after Annealing at 1300o–1500oC
3.1 Introduction
Aluminum nitride has been considered one of the most promising substrate materials for use in semiconductor, microwave, optic, electronic and other high performance applications, because of its high thermal conductivity (≈ 320 W/m·k), low dielectric constant (≈ 8.8), high electric resistivity (≦ 1012 ~ 1014 Ω·cm), and coefficient of thermal expansion similar to that of silicon.1, 30, 31 Meanwhile, Ti is a highly active metal and easily reacts with almost all ceramics,16, 32-37 and a high adhesion or bond strength can be achieved by the interface reactions between titanium and the substrate materials. In some applications for microelectronics such as ceramic packaging and metallization,38-42 where aluminum nitride is placed in direct contact with titanium, the interfacial properties of AlN and Ti are crucial in determining the quality and reliability of electric package and its high temperature applications. Previous investigations on the interfacial reaction of AlN and Ti are very limited, most of them concerning the reaction of AlN with Ti thin films7, 12, 15, 43, 44 or Ti-containing brazing foils.45-47 While available data on the microstructure of the AlN-Ti interfacial reaction zone are often controversial, it is imperative to explore the interdiffusion reactions and mechanisms in the AlN/Ti bonding process in order to make more effective use of AlN and Ti as well.
Some previous studies regarding the thin-film metallization of AlN have been published.7, 12, 15, 43, 44 As far as the interface reaction between the Ti thin film and the AlN substrate was concerned, Westwood and Notis43, 44 found the
formation of δ-TiN and TiAl3 at the interface after annealing at 600ºC for 30 min
in oxygen-free sample. He et al.13 investigated the interface reactions of Ti thin films with AlN substrate in the temperature range of 600° to 800°C using x-ray diffractometry (XRD) and Ruthford backscattering spectroscopy (RBS). They indicated that the TiAl3 phase was formed at the interface adjacent to the AlN
substrate, while δ-TiN, Ti4N3-x, and Ti2N were formed above the TiAl3 layer.
Yasurnoto et al.15 deposited a Ti thin film on AlN with radio frequency (rf) sputtering, revealing that under an argon atmosphere, TiAl3 was formed at 700ºC
for 60 min, and TiAl3, Ti2N, and δ-TiN were detected after annealing at 830ºC
for 60 min by using XRD. In the study of the interdiffusion and reaction of Ti (thin film) and AlN (substrate) using RBS and transmission electron microscopy (TEM), Imanaka and Notis12 found τ2-Ti2AlN at the interface after annealing at
800°-950ºC. Recently, Pinkas et al.14 worked on the early stages of interface reactions between Al and Ti thin films after annealing at 600°C for 1-10 h. They claimed that the AlN decomposed at the AlN/Ti interface and its products, Al and N, reacted with Ti to produce an AlN/Al3Ti/Ti2N/Ti3Al/α-(Ti, Al)ss phase
sequence.
As for the brazing of AlN,45-47 Carim and Loehman45 reported that continuous δ-TiN and (Ti, Cu, Al)6N at the interface of AlN and Ag-Cu-Ti foil were formed
after annealing at 900ºC for 5-30 min. By using TEM and electron probe microanalysis (EPMA), Loehman and Tomsia46, 47 indicated that TiN0.7 was
detected at the interface of AlN and Ag-26.7Cu-4.5Ti after reaction at 900ºC for 30 min in an argon atmosphere.
Among other previous studies on the interfacial reaction of AlN and Ti, El-Sayed et al.17 characterized the reaction zone microstructure of AlN/Ti (20 or 50 μm thick)/AlN joints after annealing at 1050°-1200ºC for 2-20 h in vacuum. The reflection peaks of δ-TiN, τ -Ti AlN, τ -Ti AlN, and α -Ti Al, were
observed in the X-ray diffraction spectra taken from the fracture surfaces of annealed joints. Up to 1200oC for 20 h, both δ-TiN1-x and τ1-Ti3AlN did not
grow significantly, but the growth kinetics of α2-Ti3Al followed the parabolic
law. Paransky et al.20, 21, 23 investigated the interfacial reactions between AlN particles and the Ti matrix, as well as AlN-Ti diffusion couples, after annealing in the temperature range from 900° to 1100oC using energy-dispersive spectroscopy (EDS) and electron back-scattered diffraction (EBSD) attached in an scanning electron microscopy (SEM). A phase sequence of δ-TiN, Ti3Al0.8N0.8, and α2-Ti3Al was observed at the interface of Ti and AlN. While
the binary nitride δ-TiN and the ternary nitride τ1-Ti3AlN exhibited a complex
interpenetrating morphology, a lamellar two-phase region was also observed between τ1-Ti3AlN and α2-Ti3Al layers after annealing at 1000° and 1100oC.
Many applications of the industrial AlN/Ti joints, such as metallization, brazing, and composites mentioned above, are determined by the characteristics of the interface between AlN and Ti. In the last few decades, extensive studies have been carried out on the interface reaction between aluminum nitride and titanium. However, the microstructure evolution at the interface has not been elucidated to date, even though fundamental understanding of reaction and diffusion mechanisms is of great importance for industrial applications and scientific meaning.
The present study is devoted to the microstructural characterization of the interfacial reaction zone in AlN and Ti diffusion couples after annealing at temperatures ranging from 1300° to 1500ºC by SEM/EDS and TEM/EDS. We will try to explain the microstructural development at the Ti/AlN interface on the basis of the ternary Al-Ti-N phase diagram and the diffusion paths that connect the phases formed by the reaction between AlN and Ti. The present study is to expect to contribute to the understanding of the ternary Ti-Al-N system at high
temperatures and to aid in the processing of ceramic-metal joints. 3.2 Experimental Procedure
Highly pure AlN plates (SH-15, Tokuyama Soda Corp., Japan) and Cp-Ti plates (99.7% purity, Alfa Aesar, Ward Hill, MA) were used in this study. All the plates (about 15 x 10 x 4 mm in dimension) were ground with a diamond (15 μm) matted disk and then polished with the diamond paste (3 μm) and an alumina suspension (1μm) using a precision polishing machine (Model Minimet 1000, Buehler Ltd, Lake Bluff, IL). The specimens were then rinsed in acetone (ultrasonic bath) and distilled water, and then air-dried.
In order to characterize the microstructure of the Ti/AlN interface, samples were prepared as a sandwich mode with the Ti metal placed in between two pieces of AlN. Then, the samples were annealed in an argon atmosphere (with O2 < 1
ppm, H2O < -76 ppm, THC < 0.5 ppm and N2 < 3 ppm) under a pressure of 2
MPa at temperatures ranging from 1300° to 1500°C with holding time from 0.5 to 36 h, and then the specimen was continuously cooled down to room temperature at a rate of 10°C/min.
The cross-sectional TEM and SEM samples were prepared as follows: each annealed sample was cut into two halves in a direction perpendicular to the interface of AlN/Ti, and then ground and polished by the standard procedures as mentioned above. The samples were etched with the Kroll reagent (10 mL HF + 30 mL HNO3 + 60 mL H2O) in order to emphasize the features of different
phases and to remove the deformed surface layer. Thereafter the samples were rinsed in acetone (ultrasonic bath) and distilled water, and then air-dried. To avoid charging, all the SEM samples were coated with a thin layer of platinum (finished preparation of SEM samples). The cross-sectional slab was ground down to an 80~100 μm thickness using a precision polishing machine, then the
sample was thinned to 20~30 μm by dimpling, and finally argon ion milled at 5 kV and 20 μA (finished preparation of TEM samples).
Microstructural characterization of the cross-sections of AlN/Ti was carried out using a high-resolution scanning electron microscope (Model JSM-6500, JEOL, Tokyo, Japan) and an analytical TEM (Model 2000Fx, JEOL, Tokyo, Japan). The Cliff–Lorimer standardless technique was used to analyze the compositions of the various phases. The technique was performed on the TEM, equipped with an ultra-thin window EDS detector (Model 9900, EDAX International, Prairie View, IL). A conventional ZAF correction procedure included in the LINK ISIS software was used for the quantitative analyses.
3.3 Results and Discussion
The products formed in the AlN/Ti interfacial reaction zone are listed in Table 3.1, after annealing at 1300°-1500°C for various periods. The reaction zone consisted of δ-TiN, τ2-Ti2AlN, τ1-Ti3AlN, α2-Ti3Al, and a two-phase (α2-Ti3Al +
α-Ti) region in sequence after annealing at 1300°C. The γ-TiAl and a lamellar two-phase (γ-TiAl + α2-Ti3Al) structure were found instead of τ1-Ti3AlN in
between τ2-Ti2AlN and α2-Ti3Al after annealing at 1400oC. In comparison with
the results after annealing at 1400ºC, γ-TiAl was not formed at the interface after annealing at 1500oC. It was noted that there were some exceptions for the initial transition stage. For instance, no τ2-Ti2AlN had been found after
annealing at 1350°C for 0.5 h, while γ-TiAl and the lamellar two-phase (γ-TiAl + α2-Ti3Al) layer did not existed after annealing at 1400°C for 0.5 h, whereas a
layer of γ-TiAl was found after annealing at 1500°C for 0.5 h. In contrast to the reaction of AlN and α-Ti thin films annealed at lower temperatures (e.g., 600°-800°C),13, 14 no TiAl

![Fig. 2. 2. (a) A bright field image of the residual δ-TiN phase in τ 1 -Ti 3 AlN after annealing at 1000°C/10 h; (b) an SADP of δ-TiN, z=[111]; (c) an SADP of τ 1 -Ti 3 AlN, z=[111]; (d) the SADPs of τ 1 -Ti 3 AlN and δ-TiN, showing the orientation rel](https://thumb-ap.123doks.com/thumbv2/9libinfo/8560890.188480/39.892.180.763.120.943/bright-field-residual-annealing-sadp-sadps-showing-orientation.webp)
![Fig. 2. 3. After annealing at 1000 o C/10 h: (a) the bright field image of the (τ 1 -Ti 3 AlN + α 2 -Ti 3 Al) twinned structure; (b) the SADPs of τ 1 -Ti 3 AlN (z= [ 1 1 01 ] ) and α 2 -Ti 3 Al (z= [ 011 ] ) with the orientation relationships [ 011 ] τ](https://thumb-ap.123doks.com/thumbv2/9libinfo/8560890.188480/40.892.187.703.281.773/annealing-bright-field-twinned-structure-sadps-orientation-relationships.webp)