國
立
交
通
大
學
管理科學系
博
士
論
文
比較台灣公民營機構員工工作滿意與離職傾向:
低層次需求假設的檢定
COMPARING PUBLIC AND PRIVATE EMPLOYEES’ JOB
SATISFACTION AND TURNOVER INTENTION IN TAIWAN:
TESTING THE ASSUMPTION OF LOWER-ORDER NEED
研 究 生:王桂英
指導教授:王耀德 楊 千 教授
比較台灣公民營機構員工工作滿意與離職傾向:
低層次需求假設的檢定
COMPARING PUBLIC AND PRIVATE EMPLOYEES’ JOB
SATISFACTION AND TURNOVER INTENTION IN TAIWAN:
TESTING THE ASSUMPTION OF LOWER-ORDER NEED
研 究 生:王桂英 Student:Kuei-Ying Wang
指導教授:王耀德 楊 千 Advisor:Dr. Yau-De Wang
Dr. Chyan Yang
國 立 交 通 大 學
管理科學系
博 士 論 文
A Proposal
Submitted to Department of Management Science College of Management
National Chiao Tung University in Partial Fulfillment of the Requirements
for the Degree of Doctor of Philosophy
in Management
Jan 2009
Hsin-Chu, Taiwan, Republic of China
比較台灣公民營機構員工工作滿意與離職傾向:
低層次需求假設的檢定
研 究 生:王桂英 指導教授:王耀德 楊 千
國立交通大學管理科學系博士班摘 要
本研究目的在比較公民營機構員工的工作滿意和離職傾向。使用兩個研究,都用問 卷收集各類公民營機構員工的資料進行分析比較。第一個研究結果是:1.公家機構員工 的外在滿意和離職傾向,都小於民營機構員工;但是內在滿意卻大於民營機構員工。2. 公家機構員工的外在滿意和離職傾向的負向關係,低於民營機構員工。 第二個研究結果是:1.公家機構員工的離職傾向小於民營機構員工;但是內在滿意 卻大於民營機構員工。2.公家機構員工的外在滿意與離職傾向的負向關係,低於民營機 構員工。以上與第一個研究結果雷同。3.公家機構員工的低層次需求強度高於民營機構 員工;公民營機構員工的低層次需求與離職傾向都有負向關係。4.公家機構員工的低層 次需求,不是造成外在滿意與離職傾向負向關係低於民營機構員工的原因。所以,有關 公家機構員工因為有較強的低層次需求,所以會使外在滿意與離職傾向負向關係轉弱的 論點被拒絕。 因此本研究建議,公家機構應該建立制度,協助那些不滿意的員工在組織內部轉換 工作或轉至民營機構。此機制可以健全公家機構的離職率,更重要的是可以提供機會給 那些外在不滿意的員工,轉換至更適合他們的工作位置。 關鍵詞 :公家機構員工、民營機構員工、工作滿意、離職傾向、需求層級。COMPARING PUBLIC AND PRIVATE EMPLOYEES’ JOB
SATISFACTION AND TURNOVER INTENTION IN TAIWAN:
TESTING THE ASSUMPTION OF LOWER-ORDER NEED
Student:Kuei-Ying Wang Advisor:Dr. Yau-De Wang
Dr. Chyan Yang
Department of Management Science
National Chiao Tung University
ABSTRACT
The purpose of this research is to compare the job satisfaction and turnover intention of public - and private -sector employees. Questionnaire survey was used to collect data from employees of various private enterprises and public organizations in the two studies, which compose of this research. The results of the first study show that, first, public employees have a lower extrinsic satisfaction and lower turnover intention, but higher intrinsic satisfaction compared to their counterparts in the private sector. Second, the negative relationship between the extrinsic satisfaction and turnover intention is weaker in public employees than in private employees.
The results derived from the second study show that, first of all, similar to the findings from the first study, public employees have a higher intrinsic satisfaction but a lower turnover intention compared to private employees. Secondly, the negative relationship between extrinsic satisfaction and turnover intention is weaker in public employees. Thirdly, the lower-order need is stronger in public employees than in private employees; the lower-order need and turnover intention is negatively related with each other in both public and private employees. Fourthly, the lower-order need does not cause a weaker negative relationship between extrinsic satisfaction and turnover intention in public employees. The argument concerning that a stronger lower-order need in public employees weakens their extrinsic satisfaction—turnover intention relation is rejected. The public employees’ lower mobility in job market is proposed as an alternative viable explanation.
On the basis of the findings from the two studies, we suggest that public sector should create mechanisms to assist their dissatisfied employees to transfer to other jobs within their organizations or to the private sector. The mechanisms will induce a healthy turnover rate in public sector. More importantly, these mechanisms will provide those who are dissatisfied with the extrinsic aspects of their jobs an opportunity for moving onto other jobs that are better suited for them.
Keywords: Public Employees, Private Employees, Job Satisfaction, Turnover Intention, Hierarchy of Needs.
ACKNOWLEDGEMENTS
本論文得以順利完成,特別感謝兩位指導教授:王耀德教授和楊 千教授。王耀德 教授督導我嚴謹的理論基礎和研究方法;楊 千教授啟發我邏輯思考和跨領域整合的學 術研究能力,兩位指導老師使我在博士生涯中得到最好的教導與照顧。另外感謝諶家蘭 教授、楊維楨教授和林君信教授等口試委員對於論文內容的鼓勵與指正,使博士論文更 加完美,這是學習生涯中非常珍貴的體驗與資產。 其次,在職進修攻讀博士學位期間,感謝國家提供公費和新竹高商校長協助我辦理 公假,讓我在生計方面無後顧之憂。還有同學們在修習課業與論文寫作上的相互扶持, 謝謝您們豐富了我的求學生涯。 最後,感謝我親愛的父母與海內外的家人。八十高齡的雙親至今仍能耕作不息,其 勤勞、健朗、樸實的身教是我在學習生涯上能勤奮不懈的典範。還有海內外的家人及細 心體貼的先生,總是在我學習上最困頓時,能不眠不休的付出與協助,有您們力量支持, 才能成就我的博士學位。 因之,謹以本論文獻給在求學路上協助我、鼓勵我的每個人。 桂英 謹誌 中華民國九十八年元月CONTENTS
中文摘要……….……….……….……….……….….……i
ABSTRACT……….……….……….……….………..…..…ii
ACKNOWLEDGEMENTS……….……….……….………iii
CONTENTS……….……….……….……….………...…iv
TABLE CONTENTS……….……….……….……….….vi
FIGURE CONTENTS……….……….……….……….……..…vii
1. Introduction……….………1
1.1 Overview of the Research ... 1
2. STUDY 1…….……….……….……….……….……….……….……….……….………3
2.1 Introduction ... 3
2.2 Hypotheses ... 7
2.2.1 Comparing Job Satisfaction between Public and Private Employees... 7
2.2.2 Comparing Turnover Intentions between Public and Private Employees ... 9
2.2.3 Comparing the Satisfaction–Turnover Intention Relationship between Public and Private Employees ... 10
2.3 Methods ... 12
2.3.1 Sampling and Survey Procedures ... 12
2.3.2 Measurement ... 15
2.4 Results... 19
2.4.1 Characteristics of Participants ... 19
2.4.2 Validity and Reliability of Variables ... 21
2.4.3 Results from Hypothesis Testing ... 21
2.5 Discussion ... 28
3.1 Introduction ... …30
3.2 Methods ... 34
3.2.1 Definition of Variables ... 34
3.2.2 Sample and Data Collection ... 34
3.2.3 Characteristics of the Sample ... 36
3.2.4 Validities and Reliabilities of Variables ... 39
3.3 Analyses and Results ... 42
3.4 Discussion and Implications ... 49
4. General Discussion and Managerial Implications of the Research…….……….……….…51
4.1 Discussion ... 51
4.2 Managerial Implications ... 55
5. Limitations and Suggestions for Future Research…….……….……….……….…57
Reference…….……….……….……….……….……….……….……….……….……….…59
Appendix A…….……….……….……….……….……….……….……….…….………..…69
TABLE CONTENTS
Table 1: Distribution of the Sample of Public Employeesa ... 15
Table 2: Distribution of the Sample of Private Employeesa ... 15
Table 3: Characteristics of the Public Employees and Private Employees ... 20
Table 4.1: Means, Standard Deviations, and Correlation Matrix for Public Employees ... 23
Table 4.2: Means, Standard Deviations, and Correlation Matrix for Private Employees... 23
Table 5: T-test on the Means of Job Satisfaction and Turnover Intention between Public and Private Employees ... 24
Table 6: Regression Analysis Predicting Turnover Intention ... 27
Table 7: Characteristics of the Public and Private Employees ... 37
Table 7 (continued): Characteristics of the Public and Private Employees ... 38
Table 8: Factor Analysis on the Lower-order and Higher-order Needs ... 40
Table 9: Reliabilities of the Variables... 41
Table 10.1: Descriptive Statistics and Inter-correlations of the Variables for Public Employees ... 43
Table 10.2: Descriptive Statistics and Inter-correlations of the Variables for Private Employees ... 44
Table 11: T-test on Levels of Needs, Job Satisfaction, and Turnover Intention between Public and Private Employees ... 45
Table 12: Hierarchical Regression Analysis on Turnover Intention of Both Public and Private Employees ... 47
FIGURE CONTENTS
Figure 1. Conceptual framework of study 1 ... 11 Figure 2. Conceptual framework of study 2 ... 33
1. Introduction
1.1 Overview of the Research
This research comprises two studies. The first study was conducted to compare the job satisfaction and turnover intention between public employees versus private employees. The results of the first study showed that public employees had a higher level of intrinsic satisfaction than private employees. However, their extrinsic satisfaction and turnover intention were lower than the private employees’. In addition, the negative relation between extrinsic satisfaction and turnover intention was found weaker in public employees. The previous empirical research in the literature concerning the differences between public and private employees has shown that public employees place a higher value than private employees on employment security, which is a lower-order need. We assumed that the finding of public employees’ weaker negative relation between extrinsic satisfaction and turnover intention in the first study came from their stronger lower-order need.
The second study was conducted to examine whether the public employees do have stronger lower-order need and whether the stronger lower-order need causes a weaker negative extrinsic satisfaction-turnover intention relationship in public employees. In addition to replicate the finding for this weaker relationship in the first study, the results of the second study showed that public employees indeed had
stronger lower-order need than private employees. However, when the effects of the lower-order need on turnover intention were accounted, the negative relation between extrinsic satisfaction and turnover intention did not become stronger in public employees. This result rejected the explanation concerning the effects of lower-order need on the public employees’ extrinsic satisfaction and turnover intention relationship. The job mobility explanation was suggested as an alternative explanation for accounting the weaker negative relationship that was found in the first study and replicated in the second study of this research. The results of the two studies are summarized as follows.
1. Public employees in Taiwan were higher on their intrinsic satisfaction and lower turnover intention compared to private employees.
2. The negative relationship between extrinsic satisfaction and turnover intention was weaker in public than in private employees.
3. Public employees were stronger on their lower-order need than private employees; the lower-order need and turnover intention is negatively related with each other in both public and private employees..
4. The conjecture concerning that the lower-order need causing a weaker negative relationship between extrinsic satisfaction and turnover intention in public employees was not supported.
2. STUDY 1
2.1 Introduction
Economic theories generally consider the public sector to be less efficient and productive than the private sector (Drucker, 1990; Gupta, 2005; Cho, 2007; Rousseau, & Xiao, 2008). The public sector in Taiwan is no exception (Chou, 1999; Cho, 2007; Wu, 2007). To reform its public sector, the government of Taiwan has launched a major privatization effort (Chang & Chaing, 1999; Cho, 2007; Wu, 2007). However, parts of the public sector, e.g., public schools and governmental offices cannot be privatized. Therefore, other strategies need to be formulated and incorporated into the reform process. To design the strategies for resolving the problem effectively, the causes of the problem must first be explored.
Literature proposes different arguments to account for the causes of low productivity in the public sector. One of these arguments is that public employees’ job satisfaction is often lower than that of private employees’ because jobs in the public sector lack motivating potential (Perry & Porter, 1982; Cacioppe & Mock, 1984; Solomon, 1986; Aryee, 1992; Holtom & Tanova, 2008). Although low job satisfaction is not necessarily related to low productivity at the individual level, it is often associated with a higher level of absenteeism and turnover (Michaels & Spector, 1982; Lee, Wise, & Fireman, 1996; Hom & Kinicki, 2001), which in turn can reduce
productivity at the organizational level. High job satisfaction, on the contrary, may lower employees’ absenteeism and turnover rate and increase their organizational citizenship behaviors. All of these can lead to enhanced overall organizational performance (Kim, 2005). If public employees’ job satisfaction is lower than that of private employees’, public institutions should redesign their employees’ jobs to enhance motivating potential (Cho, 2007). Because of the implications of job satisfaction to productivity at the organizational level, one purpose of this study is to compare the differences in job satisfaction, both extrinsic and intrinsic, between public and private employees.
Another argument concerning the causes for lower productivity in the public sector is derived from Baldwin’s findings (Baldwin, 1991). Baldwin reviewed many empirical studies (Kilpatrick, Cummings, & Jennings, 1964; Grupp & Richards, 1975; Rawls, Ullrich, & Nelson Jr., 1975; Rainey, 1977; Smith & Nock, 1980) and concluded that public employees have a greater need for job security than private employees do. A higher need for job security could result in a lower turnover rate in the public sector. The literature on general personnel management suggests that a lower turnover rate can save personnel costs in the recruitment, selection, and training of replacement personnel. In addition, it can induce the individual employee’s loyalty and commitment to the organization, in turn leading to better organizational
performance (Abbasi & Hollman, 2000). However, an excessively low turnover rate is unhealthy to organizations. It may stifle opportunities for internal promotions and for infusing new blood from external labor markets into the organizations. Hence, it may hamper performance at the organizational level (Staw, 1980; Dalton & Todor, 1986). It can be inferred that with a stronger need for job security, public employees’ turnover intentions are lower, which results in a lower level of turnover rate that dampens the public sector’s productivity. Another purpose of this study is to compare public and private employees’ turnover intentions, which few studies have attempted before.
The higher need for job security in public employees also hampers organizational performance through influencing the job satisfaction–turnover relationship. In the literature, job satisfaction is found to be negatively associated with turnover intention (Michaels, & Spector, 1982; Lee, Wise, & Fireman, 1996; Hom & Kinicki, 2001). When employees are dissatisfied, they think more of quitting their jobs. For public employees, dissatisfaction may stimulate less of an intention to quit because of their greater need for security. If those who are dissatisfied continue to stay on in their jobs, their low work motivation will decrease the overall performance of the organization. In Taiwan, there may be many public employees who are dissatisfied with their jobs but continue to stay, and hence decrease the productivity of their organizations
(Hwang & Kuo, 2006). There have been no empirical studies conducted to compare the differences in the strength of the job satisfaction–turnover intention relationship between the public and the private sectors. The third purpose of this study is to examine these differences in Taiwan.
This study tests the above three arguments that contribute to the low productivity in the Taiwanese public sector. The results of this study add to the literature by testing the validity of these arguments. The following section elaborates the arguments and proposes hypotheses for empirical testing.
2.2 Hypotheses
2.2.1 Comparing Job Satisfaction between Public and Private
Employees
Studies comparing the job satisfaction of public versus private employees have resulted in mixed outcomes. Many studies have found that public employees are less satisfied with their jobs than private employees (Kovach, 1990; Aryee, 1992; Rainey & Bozeman, 2000; Dimitris, 2008). On the other hand, some studies have discovered that public employees are more satisfied than private employees with certain aspects of their jobs (Newstrom, Reif & Monczka, 1976; Smith & Nock, 1980; DeSantis & Durst, 1996). Yet other studies have resulted in a no-difference finding between the job satisfaction of public employees and that of private employees. For example, Schneider and Vaught (1993) found that although public-sector managers in Missouri showed a lower level of satisfaction with regard to their pay, their overall job satisfaction and intrinsic satisfaction were equal to those of private-sector managers. Cho and Lee (2001) found that government managers and private bank managers in Korea were equally satisfied with their jobs.
Existing research has failed to clearly show whether the job satisfaction of public employees is lower than, equal to, or higher than that of private employees’. It is
likely that the intrinsic versus the extrinsic aspects of job satisfaction cause the inconsistency in findings. Schneider and Vaught (1993) argued that the intrinsic and extrinsic aspects of jobs moderate the sector–job satisfaction relationship. Public employees are more satisfied with intrinsic aspects of their jobs, but less satisfied with the extrinsic aspects than are private employees. Posner and Schmidt (1982) found that public administrators experience more satisfaction than private corporate administrators from the intrinsic aspects of their jobs—task variety, challenge, and worthwhile accomplishment. Employment in the public sector offers opportunities for serving the public (Perry & Wise, 1990), a significant intrinsic satisfaction that is not available in the private sector. In their empirical study, Rainey and Bozeman (2000) concluded that public employees were less satisfied with the extrinsic facets of their jobs because of restrictions imposed on their job autonomy and promotional opportunities by bureaucratic rules. In addition, public-sector employees are often rewarded less abundantly than private-sector employees are (Solomon, 1986). Lower rewards could result in lower extrinsic satisfaction of public employees (Dimitris, 2008). Taking the moderating effect of the intrinsic and extrinsic aspects of job satisfaction into consideration, we propose that
Hypothesis 1: Public employees have a higher level of intrinsic satisfaction than private employees.
Hypothesis 2: Public employees have a lower level of extrinsic satisfaction than private employees.
2.2.2 Comparing Turnover Intentions between Public and Private
Employees
Although Baldwin (1987) found that the need for security had no negative effect on the work motivation of public employees, he did not fully explore the implications of a greater need for security on the work behavior of public employees. A greater need for security could lead to a lower turnover rate in the public sector (Gambrel & Cianci, 2003; Fenner Jr. & Selmer, 2008). According to Shore and Tetrick (1994),an employee seeking long-term employment is more likely to form a relational contract with his or her employer. The relational contract stabilizes the employment relationship and results in lower turnover intentions among public employees. In addition, Hammer and Tassell (1983) noted that public employees’ stronger need for security often reflects a higher level of risk aversion. This can make them more reluctant to meet the uncertainty involved in changing jobs, and they will be less likely to leave their jobs than private employees. In line with the need for security argument, we propose that
Hypothesis 3: Public employees have a lower level of turnover intention than private employees.
2.2.3 Comparing the Satisfaction–Turnover Intention Relationship
between Public and Private Employees
Empirical evidence has shown that when an employee’s job satisfaction decreases, his or her turnover intention increases (Michaels & Spector, 1982; Tett & Meyer, 1993; Elangovan, 2001; Lee, Gerhart, Weller, & Trevor, 2008). However, because of their stronger attachment to their jobs and their aversion for the risk involved in changing jobs, one may suspect that even at low levels of job satisfaction, public employees will continue to stay on in their jobs because of their stronger need for job security (Fenner Jr. & Selmer, 2008). This suggests that the negative relationship between job satisfaction and turnover intention is weaker in the public sector than in the private sector. Based on the above argument, we propose that
Hypothesis 4: The negative relationship between intrinsic satisfaction and turnover intention is weaker in public than in private employees.
Hypothesis 5: The negative relationship between extrinsic satisfaction and turnover intention is weaker in public than in private employees.
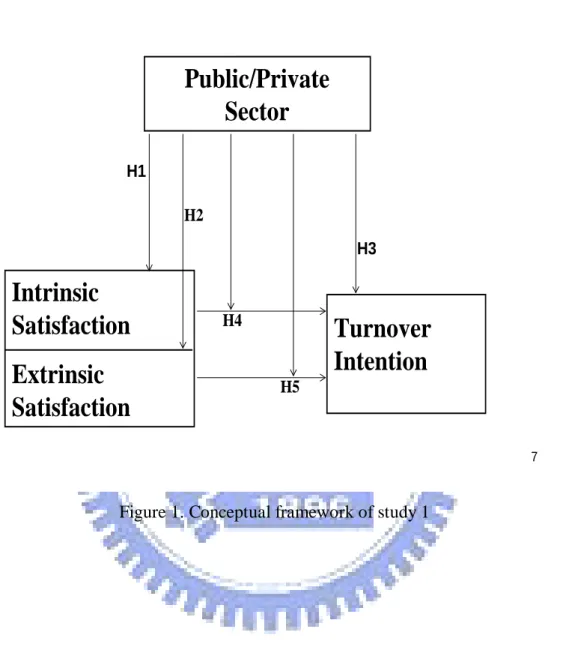
The framework of Study 1 is shown in Figure 1. 7
Public/Private
Sector
Intrinsic
Satisfaction
Extrinsic
Satisfaction
Turnover
Intention
H1 H3 H2 H4 H52.3 Methods
2.3.1 Sampling and Survey Procedures
The sample for this study included employees from public and private organizations in Taiwan. The large size of the population of both private and public employees in Taiwan (10 millions and 530 thousands, respectively) prevented the use of random sampling. To ensure the representativeness of the sample, this study collected data from employees of various types of public and private organizations. In Taiwan, the following four main types of public organizations exist: administrative organizations, hygienic and medical services, public schools, and public enterprises (The Examination Yuan of R.O.C. Taiwan, 2007). The first three types of organizations provide free services to citizens. The last type, public enterprises, provides services for basic needs (e.g., utilities, railway transportation, and postal services) to citizens at affordable costs. The aim of the enterprises is not to make profits but to provide services. They are subsidized if losses are incurred, and profits generated belong to the government. The employees of public enterprises are governed by a personnel management system similar to that of public employees in other organizations. Employees in both enterprise and non-enterprise organizations
are all considered as public employees. To increase the representativeness of the sample, the participation of employees from all four types of public organizations was solicited. Private employees in Taiwan work mainly in the service, manufacturing, and electronics and semi-conductor industries. The sample therefore included many employees from these industries.
The sample included employees from all position levels (high, middle, and low). The study aimed to sample 50% of the subjects from the low level, 30% from the medium level, and the remaining (20%) from the top level. According to reports published by the Directorate-General of Budget, Accounting and Statistics, Executive Yuan, R. O. C. (2007),
The questionnaires were distributed to 500 employees in the public sector and another 500 employees in the private sector. Two hundred and forty-three (243) questionnaires were received from public employees, resulting in a response rate of 48.6 percent. Six of those were incomplete, and were excluded from data analysis. the relative ratio of these percentages represented a pyramidal hierarchical structure commonly seen in both public and private organizations. Anonymous questionnaires were given to managers, who then distributed them to other managers and workers in their organization. Participation was voluntary. Anonymity was further insured by providing the participants with stamped envelops to mail the completed questionnaires directly to the researchers.
Two hundred and forty (240) questionnaires were received from the private employees, giving a response rate of 48 percent. Six of them were incomplete and were excluded from analysis. This resulted in a total of 483 responses, i.e. an overall response rate of 48.3 percent. As shown in Table 1, the public-sector sample included employees from all four main types of public organizations in Taiwan. It included 66 enterprise employees and 177 non-enterprise employees. Twenty of the enterprise employees were from four public banks, 36 from seven post offices, and 10 from two public utilities companies. In the group of non-enterprise employees, 27 were from four administrative offices, 10 from two hygienic and medical services, and 140 from twenty-seven public schools. For private sector, the distribution of sample was shown in Table 2. Twenty-one participants were from five private banks, 5 from a metal manufacturer, 24 from four automobile manufacturing companies, 42 from seven materials/parts manufacturers, and 148 from fourteen electronics and semiconductor manufacturing companies. Overall, the distribution of sample shows a broad coverage of employees from the main types of industries in Taiwan.
Table 1: Distribution of the Sample of Public Employees Type of Industry a Type of Business # of Institute # of Respondent Total # Respondent Response Rate Enterprise Public Bank 4 20 66 48.6 Post Office 7 36 Public Utility 2 10 Non- enterprise Administrative Office 4 27 177 Hygienic/ Medical Service 2 10 School 27 140 a
Tab le 2: Distribution of the Sample of Private Employees
Questionnaires were distributed to 500 employees in 46 public organizations.
Type of Industry a Type of Business # of Company # of Respondent Total # of Respondent Response Rate Manufacturing Metal Manufacturer 1 5 71 48.0 Automobile Manufacturer 4 24 Materials/Parts Manufacturer 7 42
Service Private Banks 5 21 21
Electronics and Semi-conductor Electronics or Semiconductor Manufacturer 14 148 148 a
2.3.2 Measurement
Questionnaires were distributed to 500 employees in 31 private companies.
Sector referred to the type of organization from which the subjects were sampled:
private or public. Ownership was used to define whether an organization is public or private (Rainey, Backoff & Levine, 1976; Solomon, 1986). Public organizations are
owned collectively by members of public communities, funded by taxation, and controlled by political forces (Boyne, 2002). On the other hand, private organizations are owned mainly by entrepreneurs or shareholders and controlled by market forces. “1” was used to code for public organizations and “0” to code for private organizations.
Job satisfaction included intrinsic and extrinsic satisfaction. Intrinsic satisfaction
is a state of pleasure gained from the work itself, such as interesting work activities, achievement, autonomy, responsibility, and opportunities for making important decisions. Extrinsic satisfaction refers to pleasure gained from outside of work itself, such as comfortable working conditions, good salaries and benefits, promotional opportunities, effective leadership, and efficient organizational procedures and policies (Weiss, Dawis, England & Lofquist, 1967). The Chinese version of the Minnesota Satisfaction Questionnaire,translated and modified by Liao (1978),was used to measure job satisfaction. According to Liao,the Cronbach α was 0 .7 6 for intrinsic satisfaction, 0.87 for extrinsic satisfaction, and 0.82 for overall satisfaction. The items were in a 5-point Likert scale.
Turnover intention referred to the intention of quitting one’s job. The
measurement of turnover intention often includes items assessing thoughts about quitting, intentions of searching for alternative employment, and intention to quit
(Mobley, Griffeth, Hand & Meglino, 1979; Michaels & Spector, 1982; Meyer, Allen & Smith, 1993). Chen’s (1994) scale was used to measure turnover intention. On the scale, one item (I have considered quitting my job) measures thoughts about quitting, two of the items (I have planned to search for alternative employment; I will start to search for alternative employment within one year) measure the intent of searching for new employment, and the remaining two items (I have carried out my plan for quitting; I will quit my job within one year) measure the intent of quitting. All five items were in a 5-point Likert scale. The Cronbach α of the scale was 0.89 (Chen, 1994).
Control variables included age, gender, education, career tenure, and level of
position. According to literature, these variables are significantly related to employees’ work attitudes (Parasuraman, 1982; DeSantis & Durst, 1996; Tanova & Holtom, 2008). To manifest the differences in job satisfaction and turnover intention between public and private employees, these demographic factors were used as the control variables in our regression analyses. An eight-point scale was used to code for age, ranging from “1” for twenty-five years old or below to “8” for fifty-six years old or above. For gender, “1” was used to code for male and “0” to code for female employees. A four-point scale, ranging from “1” for junior college or below to “4” for Ph.D., was used to code for the level of education. Job tenure was coded using an
five-point scale, ranging from “1” for five years and below to “5” for twenty years and above. Because the positions in public organizations in Taiwan are classified into three main levels with many grades in each, a three-point scale was used to code the position level of public employees. “1” was used for low level, “2” for mid-level, and “3” for high level. Private organizations in Taiwan have a more refined position classification system. The coding for private employees ranged from “1” for operative personnel to “5” for division manager, general manager, or plant manager.
2.4 Results
2.4.1 Characteristics of Participants
The characteristics of the sample are described in Table 3. The gender distribution of the surveyed respondents was about equal for both private and public employees. For private employees, the age range of 26-30 was the largest group (38.7 %) whereas in the case of public employees, the largest group (21.9 %) fell in the age range of 41-45. More than half (52.6 %) of the private employees in the sample were single. In contrast, the majority (90.4 %) of the public employees were married. In terms of education, 71.2% of public employees had a college-level education or higher as opposed to 58.1% of private employees. About one third (31.8 %) of the public employees had a career-tenure longer than thirty years, while a career tenure of 2-3 years counted for the highest percentage (23.1 %) among private employees. In the sample of public employees, 44.5% of them held low-level jobs, 50.4% mid-level, and the remaining (5.1%) held high-level jobs. In the sample of private employees, 36.3% were low-level, 47.9% were mid-level, and 15.8% were high- level.
Tab le 3: Characteristics of the Public Employees and Private Employees
Category Public Employee Private Employee
#
%
#
%
Gender Male Female 135 102 57.0 43.0 Male Female 130 104 55.6 44.4 Age 25 years or below 26-30years 31-35 years 36-40 years 41-45 years 46-50 years 51-55 years 56 years or above 1 13 42 33 52 49 25 22 0.4 5.5 17.7 13.9 21.9 20.7 10.5 9.3 25 years or below 26-30years 31-35 years 36-40 years 41-45 years 46-50 years 51-55 years 56 years or above 37 91 53 37 13 3 1 0 15.7 38.7 22.6 15.7 5.5 1.3 0.4 0 Marital Status Married Unmarried 216 23 90.4 9.6 Married Unmarried 111 123 47.4 52.6 EducationHigh School or below University/College Graduate 69 83 87 28.9 34.8 36.4
High School or below University/College Graduate 98 88 48 41.9 37.6 20.5 Job Tenure 5 years or less 6-10 years 11-15 years 16-20 years 21-25 years 26-30 years 31 years or more 8 25 28 19 43 40 76 3.3 10.5 11.7 7.9 18.0 16.7 31.8 1 year or less 2-3 years 4-5 years 6-7 years 8-9 years 10-15 years 16 years or more 51 54 30 28 20 38 13 21.8 23.1 12.8 12.0 8.5 16.2 5.6 Position Level Low Middle High 106 121 12 44.5 50.4 5.1 Low Middle High 85 112 37 36.3 47.9 15.8
2.4.2 Validity and Reliability of Variables
To test the validities of job satisfaction and turnover intention, factor analysis was performed. Job satisfaction was separated into and measured as two factors: intrinsic satisfaction and extrinsic satisfaction (Weiss, Dawis, England & Lofquist, 1967; Porter, Steers, Mowday & Boulian, 1974; Michaels & Spector, 1982). Turnover intention converged on a single factor. Twelve items were loaded on intrinsic satisfaction (see item 1, 2, 3, 4, 7, 8, 9, 10, 11, 15, 16, and 20 in Section 1 of Appendix A); 8 items on extrinsic satisfaction (item 5, 6, 12, 13, 14, 17, 18, and 19 in Section 1 of Appendix A); and 5 items on turnover intention (see item 1-5 in Section 2 of Appendix A). The reliability test found satisfactory results for each of the variables. The Cronbach α was 0.88 for intrinsic satisfaction, 0.82 for extrinsic
satisfaction, and 0.89 for turnover intention.
2.4.3 Results from Hypothesis Testing
The t-test was used to verify Hypotheses 1, 2 and 3 whereas hierarchical regression was applied to examine Hypotheses 4 and 5. In the regression analysis, the control variables consist of career tenure, age, gender, education, and position level. The moderating variable is the type of sector, i.e. public or private. The procedures
employed by Schoonhoven (1981) were used to examine the moderating effect stated in Hypotheses 4 and 5. As an example, to verify Hypothesis 5 (the negative relationship between extrinsic satisfaction and turnover intention is weaker in public than in private employees), it was first examined whether the effect of extrinsic satisfaction on turnover intention was negative and significant. If yes, it was further examined whether the interaction between extrinsic satisfaction and sector was significant. Finally, if the interaction was significant, it was examined whether the relationship was positive. Because it was hypothesized that there is a weaker relationship between extrinsic satisfaction and turnover intention in public employees than there is in private employees, an interaction in the positive direction meant that the negative relationship of extrinsic satisfaction and turnover intention was attenuated in public employees and thereby the hypothesis was supported.
The means, standard variations, and correlations for all variables are reported in Tables 4.1 and 4.2. In the case of public employees, job tenure was positively related to extrinsic satisfaction, but negatively related to intrinsic satisfaction. Age was related positively with extrinsic satisfaction in public employees and with intrinsic satisfaction in private employees. Gender was positively related with intrinsic and extrinsic satisfaction only in private employees. Level of education was positively related with intrinsic and extrinsic satisfactions in private employees but was
negatively related with extrinsic satisfaction in public employees. Position level was positively related with extrinsic satisfaction in public employees and with intrinsic satisfaction in private employees. Consistent with our expectations, intrinsic and extrinsic satisfactions were negatively associated with turnover intention in both public and private employees.
Tab le 4.1: Means, Standard Deviations, and Correlation Matrix for Public
Employees Variable Mean S D 1 2 3 4 5 6 7 1.Job Tenure 5.20 2.05 -- 2.Age 5.02 1.70 0.66*** -- 3.Gender 0.57 0.50 0.12* 0.20** -- 4.Education 2.62 1.24 -0.55*** -0.02 -0.04 -- 5.Position Level 1.93 0.99 0.09 -0.01 0.21** 0.05 -- 6.Intrinsic Satisfaction 3.64 0.52 -0.13* 0.08 0.01 0.25*** 0.12+ -- 7.Extrinsic Satisfaction 3.08 0.73 0.20** 0.14* 0.06 -0.14* 0.14* 0.44*** 8.Turnover Intention 1.70 0.81 0.10 -0.05 -0.02 -0.22*** -0.12+ -0.39*** -0.14* n=237. + p<0.10 ; *p<0.05 ; p<0.01 ; ***p<0.001.
Tab le 4.2: Means, Standard Deviations, and Correlation Matrix for Private
Employees Variable Mean S D 1 2 3 4 5 6 7 1.Job Tenure 3.38 2.05 -- 2.Age 2.62 1.20 0.74*** -- 3.Gender 0.55 0.50 -0.03 0.30*** -- 4.Education 2.02 1.15 -0.28*** 0.04 0.32*** -- 5.Position Level 2.65 0.95 0.20** 0.43*** 0.51*** 0.36*** -- 6.Intrinsic Satisfaction 3.43 0.62 0.10+ 0.20** 0.23*** 0.16** 0.27*** -- 7.Extrinsic Satisfaction 3.30 0.72 0.01 0.12+ 0.17** 0.14* 0.10 0.72*** -- 8.Turnover Intention 2.23 0.97 -0.05 -0.09 -0.05 -0.04 -0.02 -0.45*** -0.50*** n=234. + p<0.10 ; *p<0.05 ; **p<0.01 ; ***p<0.001.
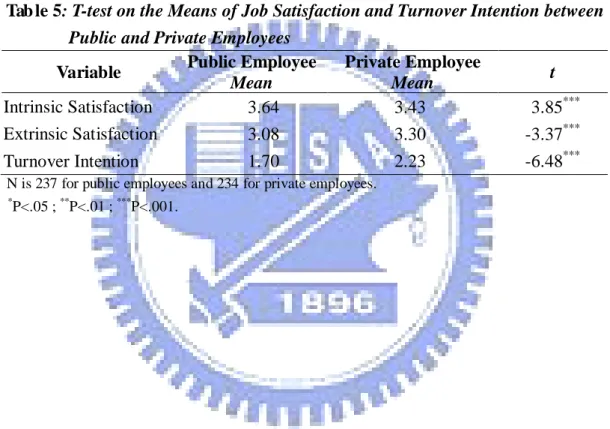
The differences in intrinsic and extrinsic satisfaction between the two sectors.
Tab le 5: T-test on the Means of Job Satisfaction and Turnover Intention between
Public and Private Employees
Table 5 shows that public employees had a level of intrinsic satisfaction higher than that of private employees’ (t = 3.85, p<.001). However, public employees were lower on extrinsic satisfaction than were private employees (t = - 3.37, p<.001). Hypotheses 1 and 2 were supported.
Variable Public Employee
Mean Private Employee Mean t Intrinsic Satisfaction 3.64 3.43 3.85*** Extrinsic Satisfaction 3.08 3.30 -3.37 Turnover Intention *** 1.70 2.23 -6.48***
N is 237 for public employees and 234 for private employees.
*
The difference in turnover intention between sectors. As shown in Table 2,
public employees’ turnover intentions were significantly lower than those of private employees’ (t = -6.48, p<.001). Hypothesis 3 was supported.
The moderating effect of sector on the satisfaction–turnover relationship.
As shown in Table 6, the control variables explained a 5 percent variance in turnover intention, thereby indicating that older employees would have lower intentions to leave their jobs (b = -.20, p<.01). The sector and the intrinsic and extrinsic satisfaction scores were then entered in the second model, thereby increasing the predictive power of the model to 24 percent. Together, sector and intrinsic and extrinsic satisfaction significantly predicted turnover intention. Public employees (b = -.33, p<.01) and those with higher intrinsic satisfaction (b = -.44, p<.001) or higher extrinsic satisfaction (b = -.15, p<.05) had lower intentions to leave. Hypothesis 3 was Hierarchical regression analysis was used to test Hypotheses 4 and 5. Turnover intention was regressed onto the control variables and the independent variables. The control variables (job tenure, age, gender, education, and position level) were entered into the regression model first; then the variables of sector, intrinsic and extrinsic satisfactions, and lastly, the interactions of sector with the variables of intrinsic and extrinsic satisfaction.
supported because public employees’ turnover intentions were lower than those of private employees’.
In the final model, the interactions of sector and intrinsic and extrinsic satisfaction were entered to increase the predictive power of the model to 25 percent. Though intrinsic satisfaction was negatively related with turnover intention (b = -.27, p<.05), its interaction with sector on turnover intention was not significant (b = -.20, p>.05), thereby indicating that public employees were similar to private employees in the sense that they equally had greater intentions to leave their jobs when they were dissatisfied with the intrinsic aspects of their jobs. Hypothesis 4 was not supported. Extrinsic satisfaction, on the other hand, was negatively related with turnover intention (b = -.41, p<.001). The effect of its interaction with sector was significant and positive (b=.40, p<.01). Public employees were less likely than private employees to consider leaving their jobs when they were dissatisfied with the extrinsic aspects of their jobs. Hypothesis 5 was supported. In a separate analysis, we combined intrinsic and extrinsic satisfaction into overall job satisfaction and ran a separate hierarchical regression. Its results showed that compared with private employees, public employees would have weaker intentions to leave their jobs when their overall job satisfaction was lower.
Tab le 6: Regression Analysis Predicting Turnover Intention
Independent Variable Model 1 Model 2 Model 3
Control Variables Job Tenure 0.08 0.05 0.03 Age -0.20** -0.02 -0.02 Gender 0.08 0.09 0.10 Education -0.09 -0.03 -0.02 Position Level 0.02 0.04 0.03 Main Effect Sector -0.33** -0.37
Intrinsic Job Satisfaction
***
-0.44*** -0.27 Extrinsic Job Satisfaction
* -0.15* -0.41
Interaction Effect
***
Intrinsic Job Satisfaction Sector -0.20
Extrinsic Job Satisfaction Sector 0.40
Model F ** 4.89*** 16.72*** 14.62 Adjusted R *** 0.05 2 0.24 0.25 ΔR2 0.19 0.01 F change 34.37*** 4.91** n=471. * P<.05 ; **P<.01 ; ***P<.001.
2.5 Discussion
The results of this study support our hypotheses regarding the lower extrinsic satisfaction and the higher intrinsic satisfaction in public employees. The results also show that public employees have a lower turnover intention than private employees and their extrinsic satisfaction have a weaker negative relationship with their turnover intention than in the case of private employees. These results seem to support the conjecture of a stronger need for security in public employees and, because of this stronger need, public employees are less likely to leave their jobs and are more likely to stay on their jobs when they are extrinsically dissatisfied (Hom & Kinicki, 2001; Fenner Jr. & Selmer, 2008;
Another result that seems to be inconsistent with the need for security argument is from the intrinsic satisfaction. There is no moderating effect from the sector on the relationship between intrinsic satisfaction and turnover intention. The lack of a moderating effect suggests that when public employees are dissatisfied with the intrinsic aspects of their jobs, they will consider quitting their jobs just as the private employees will (Nowlin, 1982; Khojasteh, 1993). Public employees seem to value the intrinsic aspects of their jobs equally strongly as private employees and their need
for security does not prevent them from thinking to quit when they are intrinsically dissatisfied.
In the next study, we will examine whether the lower-order need (including the need for security) is stronger in public employees than in private employees and whether the negative relationship between extrinsic satisfaction and turnover intention in public employees will be strengthened when the effect of lower-order need on their turnover intention is removed.
3. STUDY 2
3.1 Introduction
This purpose of this study is to examine the assumption underlying the weaker negative relationship between extrinsic satisfaction and turnover intention in public employees. In Study 1, we assumed that public employees have a stronger need for employment safety (job security need). When dissatisfied with the extrinsic aspects of their jobs, the public employees would not choose to quit their jobs because of their preference for job security than the uncertainty and risk involved in changing jobs.
In Study 2, we used the same research methods as those in Study 1. The lower-order need (physiological and safety needs) from Maslow’s hierarchy of need theory are added into Study 2 to serve as a moderating variable on the relationship between job satisfaction and turnover intention. Maslow (1954) developed a hierarchical model of needs in which there are five types of needs: physiological need, safety need, social need, esteem need, and self-actualization need. The physiological and safety needs are generally referred as the lower-order need whereas the needs for social belongings, esteem, and self-actualization are referred as the higher-order need.
In this study, we proposed that, at the removal of the influence of lower-order need on turnover intention, if there is a significant increase in the negative
employees, the assumption regarding why public employees are less likely to leave their jobs when they are dissatisfied extrinsically will be supported (Ashford, Lee, & Bobko, 1989; Fenner Jr. & Selmer, 2008)
If the above two hypotheses are supported, the assumption underlying a weaker negative relationship between extrinsic satisfaction and turnover intention in public employees will be tested (Hom and Kinicki, 2001; Fenner Jr. & Selmer, 2008
. On the other hand, if the results show no significant change in the relationship, the above assumption will be falsified. Before validating this assumption, we need, first of all, testing whether the lower-order need are indeed stronger in public employees than in private employees; and secondly, replicating the findings of Study 1— a weaker negative extrinsic satisfaction and turnover intention in public employees. The hypotheses of this study is as follows:
Hypothesis 1: Public employees are stronger on the lower-order need than private employees.
Hypothesis 2: The negative relationship between extrinsic satisfaction and turnover intention is weaker in public than in private employees.
; Holtom, & Tanova, 2008). We will examine first, whether the removal of the effect of
lower-order need on turnover intention will strengthen the negative relationship between extrinsic satisfaction and turnover intention in both public and private employees; and second, whether this removal will strengthen the relationship only in the public employees (Riipinen,1996; Gambrel & Cianci, 2003). If the results from this validation show that the removal of the effect of lower-order need does not strengthen the negative relationship between extrinsic satisfaction and turnover intention in all employees and particularly in public employees, then the assumption regarding the weaker extrinsic satisfaction and turnover intention in public employees can be rejected. We propose the following two hypotheses to test this assumption:
Hypothesis 3: When the lower-order need is stronger, the negative relationship between extrinsic satisfaction and turnover intention becomes weaker.
Hypothesis 4: When the effect of lower-order need on turnover intention is removed, the negative relationship between extrinsic satisfaction and turnover intention in public employees becomes stronger.
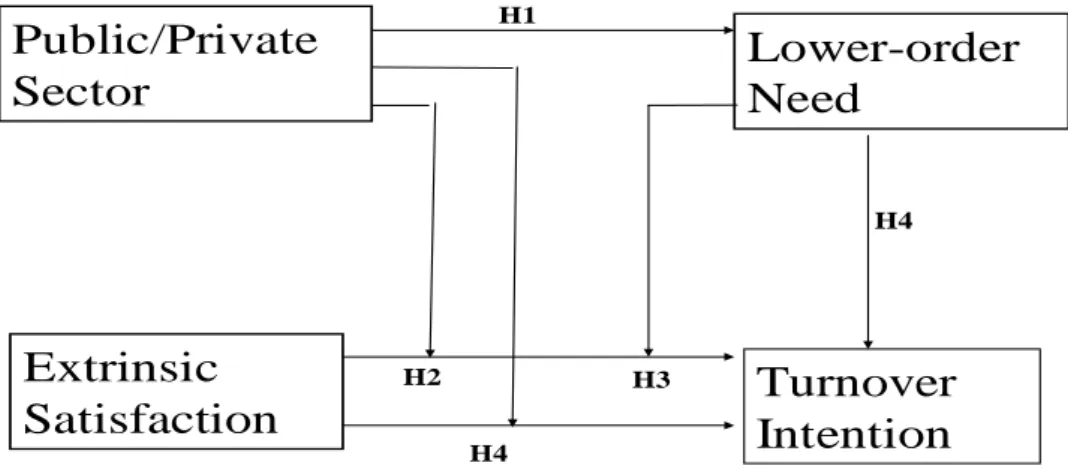
The framework of Study 2 is shown in Figure 2.
Lower-order
Need
Extrinsic
Satisfaction
Turnover
Intention
H3
Public/Private
Sector
H1 H2 H4 H4Figure 2. Conceptual framework of study 2
By comparing the hypothesis models between Study 1 (see Fig. 1) and Study 2 (see Fig. 2), the intrinsic satisfaction and turnover intention was found to be
negatively related with each other in both public and private employees as in Study 1. It is not necessary to continue discussing the same relationship in Study 2. Also, Study 1 showed the negative relationship between the extrinsic satisfaction and turnover intention was weaker in public employees than in private employees. Therefore, lower-order need is added as the variable to predict whether the previous inference is correct.
3.2 Methods
3.2.1 Definition of Variables
The questionnaire is adapted from Mitchell and Moudgill's (1976) Measurement of Maslow's need hierarchy. It consists of twenty-one questions, as shown in Appendix B. The variables are defined as follows.
Lower-order need includes physiological need such as the needs for food, water,
air, and sleep and safety need such as the needs for security, protection and family sustainment.
Higher-order need includes the need for giving and receiving love, the need for a sense of belonging and friendship, the need for self respect, and the need for a sense of achievement, contribution, respect by others, and personal growth and self-fulfillment.
The definitions of other variables are stated in the Method section of Study 1.
3.2.2 Sample and Data Collection
The sample for this study was composed of employees from the public and the private sectors. To ensure representativeness of the sample, we collect data from employees of various organizations in different industry (China Credit Information
Service, 2005; The database of enterprise index in Taiwan, 2008). The sample in public sector includes the employees from public banking, commerce, postal services, public utilities, government institutions, public health, and public educational organizations. The sample in private sector includes the employees from private banking, commerce, metal manufacturing, automobile manufacturing, materials industry, and high-tech companies. In addition, to further enhance the representativeness of our sample, we surveyed the employees from different hierarchical levels including high-level managers, middle-level managers, and low-level employees. The large size of the population of both private and public employees in Taiwan (10 millions and 530 thousands, respectively) prevented the use of systematic, random sampling procedure. The respondents were solicited through the personal network of the researchers. Questionnaires were used to collect data. The questionnaires were handed to the managers who agreed to distribute them to their subordinates. Anonymity was assured for each respondent. The respondent returned the completed questionnaire by mail to the researchers directly.
The questionnaires were distributed to 3,000 employees, two-thirds of them (n=2,000) were from private sector and one third (n=1,000) were from public sector. Four hundred and thirty-six (436) public employees returned their questionnaires for a response rate of 43.6%. We received 1,138 responses from private employees, corresponding to a response rate of 56.9%. A total of 1,574 responses were returned for an overall response rate of 52.4%.
3.2.3 Characteristics of the Sample
The characteristics of the sample are shown in Table 7. The sample of public employees includes 104 respondents from the general administrative offices, 74 from police department, and 181 from public school, to name a few. The sample of private employees consists of 298 respondents from the traditional manufacturing industries, 207 from the high-tech industries, 503 from the finance and services industries, and another 130 from other industries.
The gender distribution is similar in both the private and the public employees. Female respondents are twice more than male respondents. Age group of 31-35 was the biggest group in the private sector (23.99%) as well as in the public sector (22.71%). Job tenure of below 5 years was the largest group (41.30%) in the private sector while job tenure of between 6-10 years was the largest group (29.36%) in the public sector. Job positions are mostly in the lower level for both sectors: about seven out of every 10 respondents are clerical staff. Regarding salary range, 70.18% of public employees are in the salary treatment of below $NT 50, 000 and 27.98% are in the range of $NT 60, 000-100,000. For private employee, about four out of every five respondents (80.3%) receive monthly salary below $NT 50, 000 while 14.25% of them receive $60, 000-100,000. The findings hinted that public employee had better wages treatment than private employee.
Tab le 7: Characteristics of the Public and Private Employees
Category Private Employee Public Employee Number Percent Number Percent Gender Male 307 26.98 133 30.50 Female 831 73.02 303 69.50 Age 25 or below 136 11.95 39 8.94 26-30 202 17.75 67 15.37 31-35 273 23.99 99 22.71 36-40 232 20.39 78 17.89 41-45 174 15.29 87 19.95 46-50 76 6.68 40 9.17 51-55 37 3.25 19 4.36 56 or above 8 0.70 7 1.61 Education High School or below 196 17.22 51 11.70 University/ College 917 80.58 346 79.35 Graduate 25 2.20 39 8.95 Job Tenure (Current) 5 years or less 470 41.30 121 27.75 6-10 years 278 24.43 128 29.36 11-15 years 188 16.52 91 20.87 16-20 years 117 10.28 55 12.61 20 years or more 85 7.47 41 9.40 Job Tenure (Accumulated) 5 years or less 157 13.80 54 12.39 6-10 years 259 22.76 98 22.48 11-15 years 308 27.07 121 27.75 16-20 years 227 19.95 79 18.12 20 years or more 187 16.43 84 19.27 Salary (Monthly, $NT) $50,000 or less 913 80.30 306 70.18 $60,000-$100,000 162 14.25 122 27.98 $110,000-$150,000 31 2.73 2 0.46 $160,000 or more 31 2.72 6 1.38 Position Level Clerical Staff 802 70.47 308 70.64 Supervisor 198 17.40 105 24.08 Middle Manager 83 7.29 8 1.83 Top manager 55 4.83 15 3.44 Region North 369 32.40 181 41.50 Central 449 39.50 152 34.90 South 320 28.10 103 23.60
Tab le 7 (continued): Characteristics of the Public and Private Employees
Category Private Employee Public Employee Number Percent Number Percent
Job Category Marketing 280 24.60 Finance 262 23.02 HRM 93 8.17 Manufacture 212 18.63 R & D 36 3.16 Information Management 40 3.51 Foreign Department 12 1.05 Others 203 17.84 Employees Number Below 10 225 19.79 11-50 265 23.31 51-200 184 16.18 201-1,000 123 10.82 1,001-3,000 114 10.03 Over 3,000 211 18.56 Others 15 1.32 Capital Below 5 million 235 20.72 5-10 million 145 12.79 10-50 million 165 14.55 50-80 million 42 3.70 Over 80 million 416 36.68 Others 131 11.55 Type of Industry Traditional Manufacturing 298 26.19 High- tech 207 18.19 Finance and Service industries 503 44.20 Others 130 11.42 Job Category General Administrative 104 24.02 Medical and Hygiene 7 1.62 Police Department 74 17.09 Public Schools 181 41.80 Public Produce Enterprises 11 2.54 Public Transportation 14 3.23 Public Banks 28 6.47 Others 14 3.23
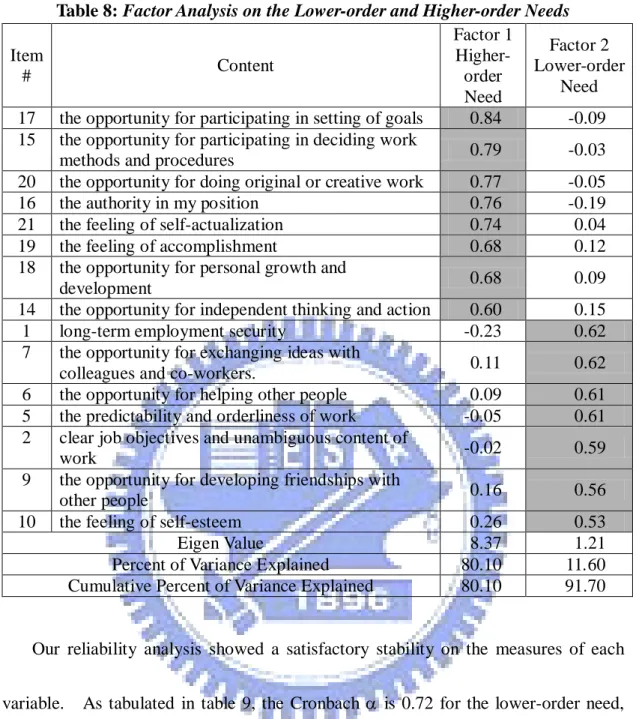
3.2.4 Validities and Reliabilities of Variables
There are five variables involved in this study: lower-order need, higher-order need, intrinsic satisfaction, extrinsic satisfaction, and turnover intention. The validities and reliabilities for the measures of these variables can be found in the literature (Weiss, 1967; Porter et al, 1967; Michael & Spector, 1982). We performed factor analysis on Maslow’s hierarchy of need of the variables in order to examine their convergent and discriminant validities. The results were shown in Table 8. As evident, eight items were loaded on higher-order need and seven items on lower-order need. We did not perform factor analysis on the items on intrinsic and extrinsic satisfactions and turnover intention because those items were identical to those used in Study 1. (Note: the items for turnover intention can be found in Section 2 of Appendix B and the items for intrinsic and extrinsic satisfactions are shown in Section 3 of the appendix.)
Table 8: Factor Analysis on the Lower-order and Higher-order Needs Item # Content Factor 1 Higher- order Need Factor 2 Lower-order Need 17 the opportunity for participating in setting of goals 0.84 -0.09 15 the opportunity for participating in deciding work
methods and procedures 0.79 -0.03
20 the opportunity for doing original or creative work 0.77 -0.05
16 the authority in my position 0.76 -0.19
21 the feeling of self-actualization 0.74 0.04
19 the feeling of accomplishment 0.68 0.12
18 the opportunity for personal growth and
development 0.68 0.09
14 the opportunity for independent thinking and action 0.60 0.15
1 long-term employment security -0.23 0.62
7 the opportunity for exchanging ideas with
colleagues and co-workers. 0.11 0.62
6 the opportunity for helping other people 0.09 0.61 5 the predictability and orderliness of work -0.05 0.61 2 clear job objectives and unambiguous content of
work -0.02 0.59
9 the opportunity for developing friendships with
other people 0.16 0.56
10 the feeling of self-esteem 0.26 0.53
Eigen Value 8.37 1.21
Percent of Variance Explained 80.10 11.60 Cumulative Percent of Variance Explained 80.10 91.70
Our reliability analysis showed a satisfactory stability on the measures of each variable. As tabulated in table 9, the Cronbach α is 0.72 for the lower-order need,
0.92 for the higher-order need, 0.87 for intrinsic satisfaction, 0.88 for extrinsic satisfaction, and 0.92 for turnover intention.
The lower-order need consists of safety need (see item 1, 2, and 5 of Table 8) and social need (see item 6, 7, 9, and 10 of Table 8). Maslow (1954) pointed out that the hierarchy of needs is dynamic; the dominant need is always shifting. Moreover, a
physiological and social. Therefore, the above observation may explain why Cronbach α of lower-order need is lower than others.
Tab le 9: Reliabilities of the Variables
Variab le α Lower-order Need 0.72 Higher-order Need 0.92 Intrinsic Satisfaction 0.87 Extrinsic Satisfaction 0.88 Turnover Intention 0.92
3.3 Analyses and Results
In our statistical analyses, the type of sector and the orders of needs were used as moderating variables. In comparison, job tenure, age, gender, education, salary, and job position level were used as control variables. Note that the variable of section was coded as 1 for public employees and as 0 for private employees. Similar to what was performed in Study 1, we used Schhoonhoven’s (1981) procedures to test the interaction effects stated in Hypotheses 2 and 3. The descriptive statistics and inter-correlations of the variables are reported in Tables 9.1-9.2.
As shown in Table 10.1, for public employees, each of the lower-order need, higher-order needs, job intrinsic satisfaction, and extrinsic satisfaction has negative relation with turnover intention. In contrast, based on the data in Table 10.2, for private employees, their higher-order need has no association with turnover intention while each of the lower-order need, intrinsic and extrinsic satisfactions has a negative relation with turnover intention.
Tab le 10.1: Descriptive Statistics and Inter-correlations of the Variables for Public Employees
Variab le Mean S D 1 2 3 4 5 6 7 8 9 10 11 12
1.Job Tenure
(accumulated) 3.09 1.29 --
2.Job Tenure (current) 2.47 1.27 0.72*** --
3.Age 3.78 1.68 0.79*** 0.60*** -- 4.Gender 1.69 0.46 0.10* -0.01 0.21*** -- 5.Education 2.44 0.82 0.07 0.11* 0.16*** 0.20*** -- 6.Salary 1.34 0.63 0.34*** 0.41*** 0.32*** 0.00 0.25*** -- 7.Position Level 1.38 0.69 0.12* 0.20*** 0.13** -0.03 0.33*** 0.45*** -- 8.Lower-order Need 4.30 0.51 0.10* 0.07 0.11* 0.16** 0.10* 0.12* 0.12* -- 9.Higher-order Need 4.05 0.55 0.07 0.04 0.06 0.13** 0.08 0.08 0.10* 0.51*** -- 10.Intrinsic Satisfaction 4.11 0.65 0.10* 0.07 0.14** 0.08 0.23*** 0.14** 0.19*** 0.17*** 0.27*** -- 11.Extrinsic Satisfaction 3.30 0.82 0.04 0.00 0.08 0.01 0.06 0.03 0.08 0.12* 0.18*** 0.60*** -- 12.Turnover Intention 2.26 0.96 -0.21*** -0.19*** -0.26*** -0.18*** -0.27*** -0.16*** -0.11* -0.19*** -0.10* -0.27*** -0.17*** -- n=436. + P<.10 ; *P<.05 ; **P<.01 ; ***P<.001.
Tab le 10.2: Descriptive Statistics and Inter-correlations of the Variables for Private Employees
Variab les Mean S D 1 2 3 4 5 6 7 8 9 10 11 12
1.Job Tenure (accumulated)
3.02 1.28 --
2.Job Tenure (current) 2.18 1.27 0.65*** --
3.Age 3.46 1.60 0.79*** 0.59*** -- 4.Gender 1.73 0.44 -0.02 -0.01 -0.09** -- 5.Education 2.13 0.71 0.15*** 0.08** 0.20*** -0.02 -- 6.Salary (monthly) 1.29 0.74 0.30*** 0.23*** 0.35*** -0.25*** 0.28***-- 7.Position Level 1.46 0.83 0.33*** 0.23*** 0.38*** -0.21*** 0.22*** 0.58*** -- 8.Lower-order Need 4.19 0.54 0.07* 0.07* 0.05 0.09** -0.03 -0.10** -0.06* -- 9. Higher-order Need 4.04 0.55 0.14*** 0.05 0.10** 0.04 0.06* 0.13*** 0.16*** 0.46*** -- 10.Intrinsic Satisfaction 3.77 0.74 0.17*** 0.12*** 0.22*** -0.07* 0.00 0.19*** 0.32*** 0.10*** 0.24*** -- 11.Extrinsic Satisfaction 3.25 0.85 0.08** 0.08** 0.13*** -0.05 -0.02 0.14*** 0.24*** 0.05 0.12*** 0.67*** -- 12.Turnover Intention 2.77 0.96 -0.30*** -0.26*** -0.30*** -0.00 -0.03 -0.16*** -0.18*** -0.06* -0.05 -0.36*** -0.33*** -- n=1,138. + P<.10 ; *P<.05 ; **P<.01 ; ***P<.001.
We performed the T-test on the levels of needs between public and private employees. As evident in Table 11, public employees have stronger lower-order need than that of private employees (t = -4.27, p<.001). However, their higher-order need is about equal to the private employees’ (b = -.30, p>.05). Therefore, Hypothesis 1 is supported. That is, public employees are stronger on the lower-order need than private employees. .
Tab le 11: T-test on Levels of Needs, Job Satisfaction, and Turnover Intention
between Public and Private Employees
Variables Public Employee Mean Private Employee Mean t Lower-order Need 4.30 4.19 -4.27*** Higher-order Need 4.05 4.04 -0.30 Intrinsic Satisfaction 4.11 3.77 -9.61*** Extrinsic Satisfaction 3.30 3.25 -1.28 Turnover Intention 2.26 2.77 9.59***
n is 1138 for private employees and 436 for public employees. +
P<.10 ;*P<.05 ; **P<.01 ; ***
Extrinsic satisfaction has a significant negative effect on turnover intention P<.001.
Additionally, we performed hierarchical regression analysis to test Hypotheses 2 and 3. The results are shown in Table 12.
According to the results in model 3 of Table 12, extrinsic satisfaction has a significantly negative effect on turnover intention (b=-.13, P<.001) and its interaction with sector is significant (b=.06, p<.01). This means that the negative relationship between extrinsic satisfaction and the turnover intention was weaker in public employees than in private employees. Hypothesis 2 is supported. This result replicates the findings of Study 1.
(b=-.13, p<.001). Its interaction with lower-order need is insignificant (b=-.04, p>.05). This means that the negative effect of extrinsic satisfaction on turnover intention remains unchanged when lower-order need is stronger. Hypothesis 3 is not supported.
Interestingly, the results show that intrinsic satisfaction has a significantly negative effect on turnover intention (b=-.21, p< .001) and its interaction with Higher-order Needis also negative and significant (b=-.07, p<.05). This means that for both private and public employees, those who are stronger on higher-order need are more likely to leave their jobs when they are dissatisfied intrinsically.
Tab le 12: Hierarchical Regression Analysis on Turnover Intention of Both Public
and Private Employees
Variab les Model 1 Model 2 Model 3
Control Variables
Job Tenure (accumulated) -0.04 -0.08* -0.09*
Job Tenure (current) -0.09 -0.06* -0.06*
Age -0.14* -0.07* -0.07* Gender 0.11* 0.13* 0.13** Education -0.06* -0.04* -0.04* Salary -0.03 -0.03* -0.03 Position Level -0.00 0.00 0.01 Main Effect Sector -0.17*** -0.16*** Lower-order Need -0.09*** -0.09** Higher-order Need 0.08** 0.07* Intrinsic Satisfaction -0.22*** -0.21*** Extrinsic Satisfaction -0.13*** -0.13*** Interaction Effect
Intrinsic Satisfaction Sector -0.01
Extrinsic Satisfaction Sector 0.06**
Lower-order Need Sector -0.05 *
Higher-order Need Sector -0.01
Intrinsic Satisfaction Lower-order Need 0.08*
Extrinsic Satisfaction Lower-order Need -0.04
Intrinsic Satisfaction Higher-order Need -0.07*
Extrinsic Satisfaction Higher-order Need 0.00
Model F 28.12*** 41.28*** 25.64*** Adjusted R2 0.11 0.23 0.24 ΔR2 0.08 0.01 F change 53.14*** 1.92* n=1,531. + P<.10 ;*P<.05 ; **P<.01 ; ***P<.001.
Hierarchical regression was again used to test Hypothesis 4. Table 13 shows that lower-order need has a negative effect on turnover intention in public employees (b=-.15, p<.01). Their extrinsic satisfaction is not related with turnover intention (b=-.04, P>.05). This means that for public employees, when the effect of