國立交通大學
土 木 工 程 學 系
博 士 論 文
整 合 式 無 線 感 測 網 路 之 結 構 健 康 監 測 系 統
於 建 築 與 土 木 結 構 之 研 發
DEVELOPMENT OF AN INTEGRATED WIRELESS SENSOR
NETWORK-BASED STRUCTURAL HEALTH MONITORING
SYSTEM FOR BUILDINGS AND CIVIL
INFRASTRUCTURES
研 究 生:林 子 軒
指導教授: 洪 士 林 博士
整 合 式 無 線 感 測 網 路 之 結 構 健 康 監 測 系 統
於 建 築 與 土 木 結 構 之 研 發
DEVELOPMENT OF AN INTEGRATED WIRELESS SENSOR
NETWORK-BASED STRUCTURAL HEALTH MONITORING
SYSTEM FOR BUILDINGS AND CIVIL INFRASTRUCTURES
研 究 生:林 子 軒 Student: Tzu-Hsuan Lin
指導教授:洪 士 林 博士 Advisor: Dr. Shih-Lin Hung
國 立 交 通 大 學 土 木 工 程 學 系
博 士 論 文
A Dissertation
Submitted to Department of Civil Engineering College of Engineering
National Chiao Tung University In partial Fulfillment of the Requirements
for the Degree of Doctor of Philosophy
in
Civil Engineering June 2011
Hsinchu, Taiwan, Republic of China
I
整合式無線感測網路之結構健康監測系統
於建築與土木結構之研發
研究生:林子軒 指導教授:洪士林 博士 國立交通大學 土木工程學系摘要
本研究提出一整合式無線感測網路之結構健康監測系統架構並應用於建築 與土木結構上。此架構主要包含了感測、資訊融合與管理以及決策診斷。在此架 構目標下,本研究發展了一個整合式無線感測網路結構健康監測系統。此系統由 多種無線節點所組成,包含感測結點、簇首節點、傳送節點與基地台。感測結點 主要以 Imote2 平台為基礎,用來量測結構的動態反應或是環境參數。簇首節點 為雙核心之設計結合了 Imote2 平台與額外之嵌入式系統。簇首節點含有額外之 無線通訊模組與 GPS 來進行較長距離之資料接收、交換,並可以進行定位與同步 之用。傳送節點可當作協調者並進行資料的跳躍傳送(Hopping)。基地台主要為 接收所有回傳的感測資料與訊息,其硬體能力為所有結點中最高的。此系統亦包 含了一個三層式的軟體架構,主要可以進行可靠的資料感測與傳輸、資料儲存、 視覺化之使用者介面、資料分析與訊號處理等工作。在此軟體架構下,無線感測 相關的結構健康監測的應用將可以很容易地被實行。此外,能源的消耗亦是無線 感測的一個很重要的問題,因此,本研究發展了一個結合壓電、風車、與磁場的 整合式能源擷取系統來改善能源消耗的問題。 結構健康監測可分為局部與全域 之方法,然而,兩種方法各有其優缺點與應用之時機。因此本研究發展了一個整合式的結構損害評估方法整合全域與局部之結構損害評估法,應用於結構健康監 測上。在全域結構損害偵測方面,本文分別提出了新的子結構頻率響應函數法來 對結構進行大範圍之損害評估。接著,以電機阻抗為主之局部損害評估法則可以 用來進行小範圍局部損害之評估。 在實驗與數值模擬研究中,數值模擬的結果發現本文所提出之結構損壞評估 方法可以成功地找出結構發生損壞的位置。另外無線感測網路結構健康監測系統 亦於一縮尺之建築模型上進行驗證,其實驗結果證實此系統可進行高質量的感測 與資料傳輸並可以精確地獲得結構的相關動態反應參數。為驗證所發展之無線感 測網路結構健康監測系統應用於實際土木結構上之可行性,將此系統佈設於一橋 梁上進行驗證。實驗結果顯示,此系統於實際土木之結構上依然可以獲得相當好 的感測結果,無線傳輸也可以達到預期的效果。在實際土木結構監測的佈設上更 可以發現本系統之優點,在實驗過程中,平均一個節點的建置小於 5 分鐘,比起 傳統有線的監測系統來說,在時間成本的節省上更顯現出本系統的優勢。在六層 樓縮尺模型試驗中,亦可以證實本研究所提出之整合式的結構損害評估方法可以 識別出結構之全域與局部之損害。
III
DEVELOPMENT OF AN INTEGRATED WIRELESS SENSOR
NETWORKS-BASED STRUCTURAL HEALTH MONITORING
SYSTEM FOR BUILDINGS AND CIVIL INFRASTRUCTURES
Student: Tzu-Hsuan Lin Advisor: Dr. Shih-Lin Hung Department of Civil Engineering
College of Engineering National Chiao Tung University
ABSTRACT
The main purpose of this dissertation was to propose a framework for an
integrated wireless sensor network (WSN)-based structural health monitoring (SHM)
system in buildings and civil infrastructures. In this framework, three main parts were
considered: the physical sensing; information fusion and management; and inference
and decision making. To achieve this goal, an integrated WSN-based SHM system
was developed. This system consists of sensing nodes, cluster head nodes, transfer
node, and base station. The sensing node measures structural response or
environmental parameters. Each sensing node is controlled by an Imote2 platform
comprised of a microprocessor, sensor module, and communication device. To
exchange information or to trigger sensing tasks, the cluster head node can
communicate with sensing nodes or cluster heads of neighboring communities. The
cluster head has a dual-core design that combines the Imote2 platform with a second
embedded device. The cluster head has an extra wireless module and GPS. The extra
communication. The GPS is useful for synchronization and localization. The transfer
node functions as a coordinating node for managing cluster heads and data hopping.
The base station is the highest level end device and has the largest memory, the most
powerful processor and the highest communication capability. The base station node
is the gateway between smart sensor networks and the Host computer.
A three-tier software framework is also developed in this work serving as reliable
data-sensing and transmission, data logging and data storage, user interface, data
analyzing, and signal processing. Based on this software framework, a SHM
application for specific purpose can be easily developed. Power sources and power
consumption are the critical issue in WSN if batteries have to be periodically replaced.
Hence, a novel windmill-magnet integrated piezoelectric (WMIP) energy harvesting
system was also proposed.
Since local and global SHM have unique benefits and shortcomings, an
integrated approach may be more effective than using either approach alone. This
work developed a global-local-integrated damage detection approach for localizing
damage. Substructure-based frequency response function approaches were proposed
for global damage detection. Local damage was then identified by
Electro-Mechanical-Impedance (EMI)-Based damage detection method.
Numerical and experimental study is also conducted to complete this study.
Numerical results reveal that the proposed global damage detection approach can
successfully locate damage at a single site and at multiple sites. Experimental analysis
confirms the proposed integrated WSN-based SHM system provides excellent data
V
An experimental validation in building structure confirms that the proposed global
SHM approach can indicate the approximate location of the damaged area in damaged
floor and the EMI-based damage detection approach can check the component of
building structure locally. Subsequently, the proposed WSN-based SHM system is
employed in a bridge structure to test the feasibility in field. This experimental result
confirms good-quality data collection by the proposed system. In experimental period,
the system shows WSN-based SHM system outperforms conventional SHM system,
especially in deploying sensors. Average time for deploying single node only takes
ACKNOWLEDGEMENT
時間飛逝,轉眼間在交大也待了六個年頭了,學生生涯也在此畫下了句點。讀 博士真是一個漫長的過程,其中辛酸只有經歷過的人才能夠體會吧。在博士期間, 受到許許多多的幫助,在此獻上我最深的感謝。 當然最要感謝的是我的指導教授洪士林博士,他在研究上給予我非常大的自由, 讓我可以進行我有興趣的研究,在論文的方向與內容給予我相當大的幫助,並在 在其身上學到一個研究學者該有的風範。在生活方面,洪老師的國科會計畫也幫 助了我減輕經濟上的壓力。感謝黃炯憲老師在我論文中很重要的理論部分給予我 相當大的指導,在黃老師的身上也學到做研究嚴謹的態度。感謝廖德誠老師在電 機領域相關的指導,讓我跨領域的學習能夠如此的順利。另外,在博士班期間很 感謝東京大學的 Fujino 與 Nagayama 教授給我機會,讓我到東京大學訪問兩個 月,這兩個月讓我學習到很多東西,是個難忘的經驗。感謝靜宜大學吳仁彰教授 帶領我進入跨領域的研究,也感謝其時時為我禱告。感謝 Murthy 博士,無論是 在研究或是 paper 的撰寫都給予我相當大的幫助,在他身上也學到很多。感謝中 興工程科技研究發展基金會,中興工程顧問社,中華顧問工程司,給予我的獎學 金。讓我能夠專心於研究上,不用為經濟擔心。 感謝研究室同學勇奇在我研究上有問題時可以互相討論,感謝研究室學弟們在 我實驗上的幫忙,感謝一弘在我修習電機相關課程時給予我幫助,並在 WSN 的領 域一起努力學習,感謝阿銘在天線上面的幫助,感謝秦飛在 Imote2 上給予的協 助。還有許多在我博士班期間幫助過我的朋友,無法在此一一列出,在這一起獻 上我的感謝。也要感謝女友珮茹這幾年來對我的鼓勵與關心。最後要感謝我的家 人,沒有你們的支持,我沒有辦法專心地完成我的博士學位,感謝我的母親,您 辛苦了。VII
CONTENTS
摘要 ... I ABSTRACT... III ACKNOWLEDGEMENT ...VI CONTENTS ... VII LIST OF TABLES ... XILIST OF FIGURES ... XII
CHAPHER 1 INTRODUCTION ... 1
1.1 BACKGROUND OF STRUCTURAL HEALTH MONITORING ... 1
1.2 MOTIVATION AND OBJECTIVE ... 3
1.3 OVERVIEW OF DISSERTATION ... 7
CHAPHER 2 LITERATURE REVIEW ... 10
2.1 INTRODUCTION ... 10
2.2 STRUCTURAL HEALTH MONITORING APPROACH ... 10
2.2.1 Global Damage Detection Method ... 10
2.2.2 Local Damage Detection Method ... 13
2.3 WIRELESS SENSOR NETWORKS-BASED STRUCTURAL HEALTH MONITORING APPLICATIONS ... 15
3.1 INTRODUCTION TO WIRELESS SENSOR NETWORKS (WSN)... 18
3.2 SUBSYSTEM OF SMART WIRELESS SENSOR NODE ... 20
3.3 WIRELESS SENSOR PLATFORMS... 21
3.4 FACTORS INFLUENCING SENSOR NETWORK DESIGN ... 23
3.5 THE 802.15.4 AND ZIGBEE STANDARDS ... 25
3.6 OPERATING SYSTEMS FOR WIRELESS SENSOR NETWORKS ... 29
3.7 TIME SYNCHRONIZATION ... 34
CHAPHER 4 INTEGRATED WSN-BASED SHM SYSTEM ... 37
4.1 INTRODUCTION ... 37
4.2 ARCHITECTURE OF INTEGRATED WSNSHMSYSTEM ... 38
4.3 HARDWARE DESIGN ... 39
4.3.1 Sensing Node ... 40
4.3.2 Cluster Head and Transfer Node ... 44
4.3.3 Base Station... 47
4.3.4 Multi-Sensor Board Design ... 48
4.3.5 Power Module ... 52
4.4 WINDMILL-MAGNET INTEGRATED PIEZOELECTRIC (WMIP)ENERGY HARVESTING SYSTEM... 52
4.4.1 General Theory of Vibration-Based Energy Harvesting Method ... 53
IX
4.4.3 Windmill-Magnet Integrated Piezoelectric Energy Harvesting System ... 57
4.5 THREE-TIER SOFTWARE FRAMEWORK ... 62
4.5.1 Net Micro Frameworks-Based Embedded Development Environment ... 64
4.5.2 Data Logging and Data Storage ... 68
4.5.3 User Interface and Visualized Signal Processing ... 69
4.6 RELIABLE DATA-SENSING AND TRANSMISSION SERVICE ... 72
CHAPHER 5 DEVELOPMENT OF GLOBAL-LOCAL-INTEGRATED DAMAGE DETECTION APPROACH76 5.1 INTRODUCTION ... 76
5.2 SUBSTRUCTURE-BASED FREQUENCY RESPONSE FUNCTION FOR GLOBAL DAMAGE DETECTION ... 78
5.2.1 Substructure-Based Frequency Response Function Approach ... 80
5.2.2 Numerical Study ... 91
5.2.3 Implement of SubFRFDI in Integrated WSN-Based SHM System ... 111
5.3 ELECTRO-MECHANICAL-IMPEDANCE (EMI)-BASED LOCAL DAMAGE DETECTION METHOD ... 114
5.3.1 Fundamental of EMI-Based Model ... 114
5.3.2 Measurement of Piezoelectric-Impedance ... 117
5.3.3 Selection of Frequency Ranges ... 118
CHAPHER 6 EXPERIMENTAL VERIFICATION ... 120
6.1 INTRODUCTION ... 120
6.2.1 Verification of Sensing Node ... 120
6.2.2 Reliability of RF Communication Test ... 127
6.2.3 Field Test in Bridge Structure ... 130
6.2.3.1 Experimental Setup ... 132
6.2.3.2 Experimental Results ... 134
6.3 EXPERIMENTAL STUDY IN BUILDING STRUCTURE ... 140
CHAPHER 7 CONCLUSIONS REMARKS ... 158
7.1 CONCLUSION ... 158
7.2 FUTURE STUDY ... 161
REFERENCE ... 163
XI
LIST OF TABLES
TABLE 3.1DESCRIPTION OF KEYWORDS IN TINYOS. ... 33
TABLE 4.1COMPARISON OF MOTE PLATFORM ... 43
TABLE 4.2SPECIFICATION OF XBEE MODELS. ... 46
TABLE 4.3PHYSICAL AND ELECTRICAL CHARACTERISTICS OF GYRO SENSOR ... 50
TABLE 4.4PHYSICAL AND ELECTRICAL CHARACTERISTICS OF ACCELEROMETER SENSOR ... 51
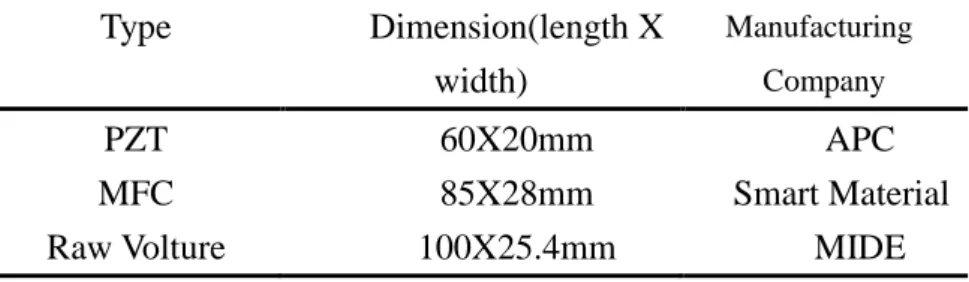
TABLE 4.5DIFFERENT TYPES OF PIEZOELECTRIC PRODUCT ... 58
TABLE 4.6DESCRIPTION OF CLASS LIBRARY ... 66
TABLE 4.7TOSMSG HEADER CONTENTS ... 68
TABLE 4.8SENSOR BOARD HEADER CONTENT ... 69
TABLE 4.9DATA PAYLOAD ... 69
TABLE 5.1DESCRIPTIONS OF SIMULATED DAMAGE CASES. ... 92
TABLE 6.1DESCRIPTION DAMAGE SCENARIOS FOR THE STEEL-FRAME MODEL. ... 144
TABLE 6.2COMPARISONS OF MODAL PARAMETERS IDENTIFIED BY WIRELESS SENSING NODES AND CONVENTIONAL REFERENCE SENSORS. ... 151
LIST OF FIGURES
FIGURE 1.1THE RELATION BETWEEN USAGE MONITORING, STRUCTURAL HEALTH MONITORING, AND DAMAGE PROGNOSIS. 3
FIGURE 1.2A FRAMEWORK OF AN INTEGRATED WIRELESS SENSOR NETWORK-BASED STRUCTURAL HEALTH MONITORING
SYSTEM. ... 7
FIGURE 3.1COMPOSITION OF WIRELESS SENSOR NODE ... 21
FIGURE 3.2802.15.4 AND ZIGBEE ARCHITECTURE ... 26
FIGURE 3.3.STAR TOPOLOGY ... 27
FIGURE 3.4.PEER-TO-PEER TOPOLOGY ... 28
FIGURE 3.5SCHEMA OF TINYOS(CROSSBOW) ... 30
FIGURE 3.6ARCHITECTURE OF TINYOS(CROSSBOW) ... 31
FIGURE 3.7THE PROCESS IN TINYOS(CROSSBOW) ... 32
FIGURE 4.1INTEGRATED WSN-BASED SHM SYSTEM ARCHITECTURE: DIFFERENT ROLES ARE ASSIGNED TO NODES ... 39
FIGURE 4.2PHOTO OF SENSING NODE ... 40
FIGURE 4.3BLOCK DIAGRAM OF SENSING NODE ARCHITECTURE. ... 42
FIGURE 4.4BLOCK DIAGRAM OF CLUSTER HEAD NODE ARCHITECTURE. ... 46
FIGURE 4.5PHOTOGRAPH OF CLUSTER HEAD NODE ON BOX ... 47
FIGURE 4.6BLOCK DIAGRAM OF BASE STATION ARCHITECTURE... 48
FIGURE 4.7SIMPLIFIED BLOCK DIAGRAM OF MULTI-SENSOR BOARD ... 49
XIII
FIGURE 4.9(A)CANTILEVER BEAM WITH TIP MASS,(B) MODEL OF EQUIVALENT LUMPED SPRING MASS SYSTEM ... 54
FIGURE 4.10TYPICAL PIEZOELECTRIC HARVESTING CIRCUIT ... 55
FIGURE 4.11ARCHITECTURE OF ENERGY HARVESTING BASED WIRELESS SENSOR NODE ... 57
FIGURE 4.12SCHEMATIC DIAGRAM OF WINDMILL BASED PIEZOELECTRIC HARVESTING SYSTEM ... 58
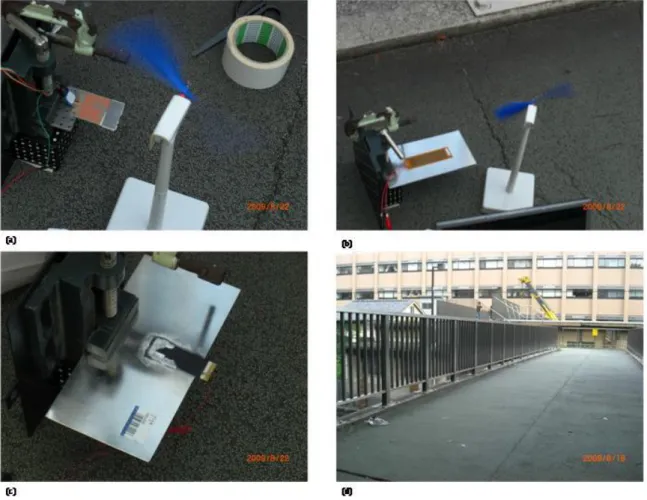
FIGURE 4.13EXPERIMENT SETUP OF WINDMILL BASED PIEZOELECTRIC HARVESTING SYSTEM:(A)RAW VOLTURE,(B)MFC, (C)PZT,(D)OVERPASS IN TOKYO UNIVERSITY. ... 59
FIGURE 4.14OUTPUT VOLTAGE OF PZT ... 60
FIGURE 4.15OUTPUT VOLTAGE OF MFC ... 60
FIGURE 4.16OUTPUT VOLTAGE OF RAW VOLTURE ... 61
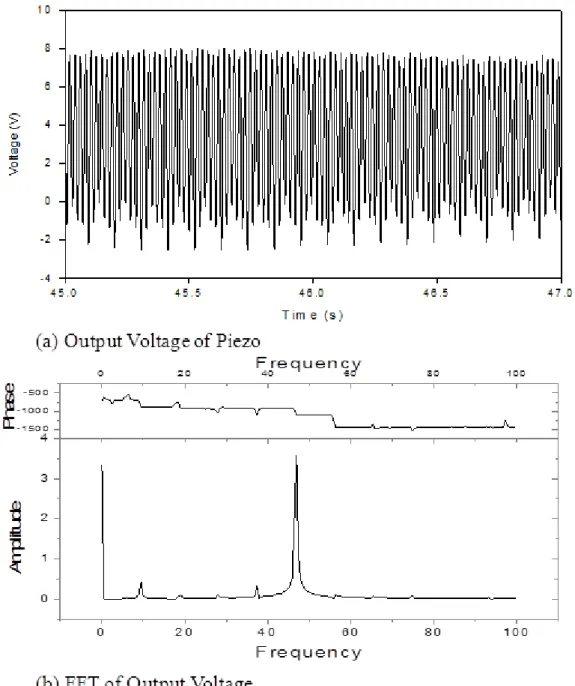
FIGURE 4.17WINDMILL-MAGNET INTEGRATED PIEZOELECTRIC (WMIP) ENERGY HARVESTING SYSTEM ... 61
FIGURE 4.18OUTPUT VOLTAGE AND FFT OF WMIP ENERGY HARVESTING SYSTEM ... 62
FIGURE 4.19THE PROPOSED SOFTWARE ARCHITECTURE ... 63
FIGURE 4.20STRUCTURE OF CLASS LIBRARY ... 65
FIGURE 4.21.PACKET FORMAT ... 68
FIGURE 4.22FUNCTIONS OF PROPOSED USER INTERFACE ... 70
FIGURE 4.23SENSOR DATA REPRESENTATION AND NODE DISTRIBUTION ... 71
FIGURE 4.24SIGNAL PROCESSING INTERFACE ... 71
FIGURE 4.25DAMAGE LOCATION REPRESENTATION ... 72
FIGURE 5.1 GLOBAL-LOCAL-INTEGRATED DAMAGE DETECTION APPROACH ... 77
FIGURE 5.2FREQUENCY RESPONSE FUNCTION MODEL ... 81
FIGURE 5.3.(A)ORIGINAL COMPLETE STRUCTURE,(B) THE ITH SUBSTRUCTURE. ... 87
FIGURE 5.4.FRF OF SUBSTRUCTURE ... 91
FIGURE 5.5COMPARISONS OF CONVENTIONAL FRFS OF THE STRUCTURE IN UNDAMAGED AND DAMAGED STATES FOR CASE 1. ... 95
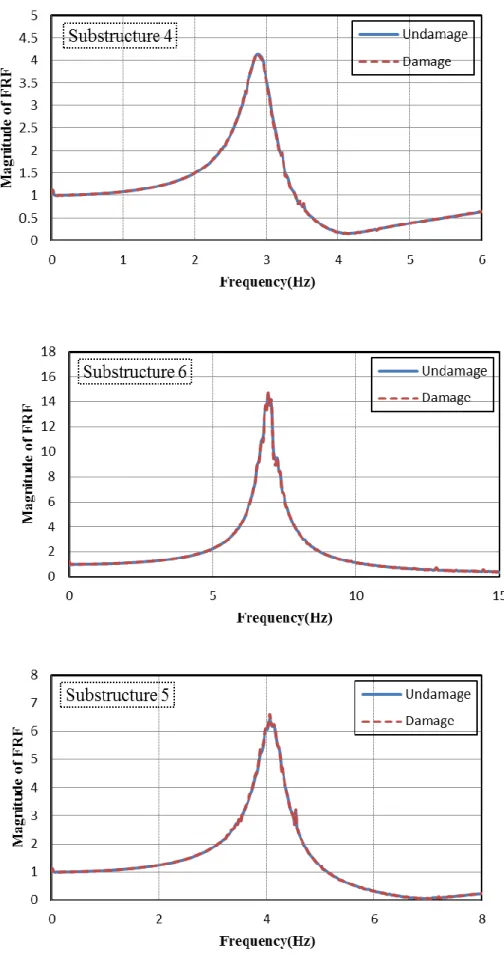
FIGURE 5.6COMPARISONS OF THE SUBSTRUCTURE-BASED FRFS FOR EACH SUBSTRUCTURE FOR CASE 1. ... 97
FIGURE 5.7THE IDENTIFIED DAMAGE LOCATIONS IN SINGLE-DAMAGE CASES 1. ... 98
FIGURE 5.8THE IDENTIFIED DAMAGE LOCATIONS IN SINGLE-DAMAGE CASES 2. ... 98
FIGURE 5.9THE IDENTIFIED DAMAGE LOCATIONS IN SINGLE-DAMAGE CASES 3. ... 99
FIGURE 5.10THE IDENTIFIED DAMAGE LOCATIONS IN SINGLE-DAMAGE CASES 4. ... 99
FIGURE 5.11THE IDENTIFIED DAMAGE LOCATIONS IN SINGLE-DAMAGE CASES 1 FOR DIFFERENT DAMAGE EXTENT. ... 100
FIGURE 5.12THE IDENTIFIED DAMAGE LOCATIONS IN SINGLE-DAMAGE CASES 3 FOR DIFFERENT DAMAGE EXTENT. ... 100
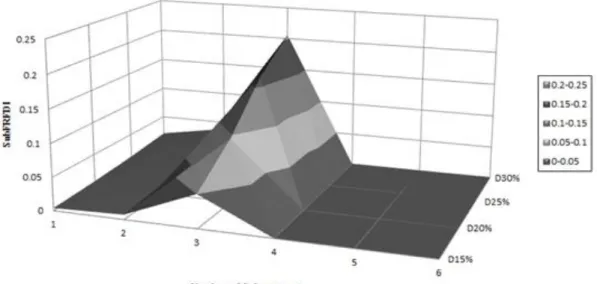
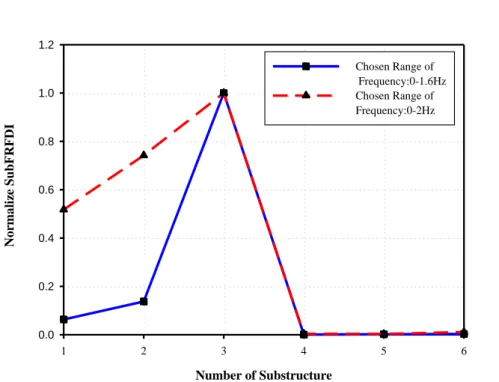
FIGURE 5.13THE VALUES OF THE SUBFRFDI OF EACH SUBSTRUCTURE IN DAMAGE CASE 3, OBTAINED USING TWO DIFFERENT FREQUENCY RANGES. ... 103
FIGURE 5.14.THE FRF OF SUBSTRUCTURE:WITH AND WITHOUT NOISE. ... 103
FIGURE 5.15THE EFFECTS OF NOISE ON SUBFRFDII ESTIMATIONS FOR CASE 3. ... 104
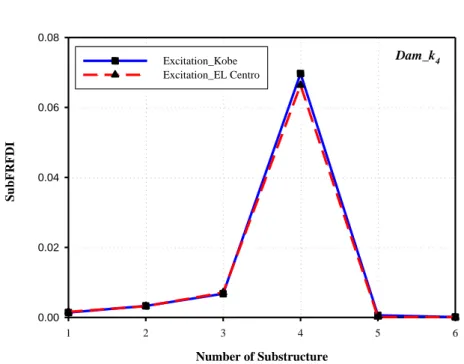
FIGURE 5.16THE SUBFRFDI VALUES OF DIFFERENT SUBSTRUCTURES IN DAMAGE CASE 4 WITH DIFFERENT EARTHQUAKE EXCITATIONS. ... 104
XV
FIGURE 5.17THE ANALYTICAL RESULTS FOR DAMAGE CASE 3 OBTAINED USING THE PROPOSED METHOD (SUBFRFDI) AND
THE FRF CURVATURE-METHOD-BASED INDEX (FRFCDI). ... 105
FIGURE 5.18THE SUBFRFDI VALUES FOR SUBSTRUCTURES IN DAMAGE CASES 7, MULTIPLE DAMAGE. ... 106
FIGURE 5.19THE SUBFRFDI VALUES FOR SUBSTRUCTURES IN DAMAGE CASES 8, MULTIPLE DAMAGE. ... 106
FIGURE 5.20.THE SUBFRFDI VALUES FOR SUBSTRUCTURES IN DAMAGE CASES 9, MULTIPLE DAMAGE. ... 107
FIGURE 5.21THE SUBFRFDI VALUES FOR SUBSTRUCTURES IN DAMAGE CASES 10, MULTIPLE DAMAGE. ... 107
FIGURE 5.22THE SUBFRFDI VALUES FOR SUBSTRUCTURES IN DAMAGE CASES 11, MULTIPLE DAMAGE. ... 108
FIGURE 5.23THE SUBFRFDI VALUES FOR SUBSTRUCTURES IN DAMAGE CASES 12, MULTIPLE DAMAGE. ... 108
FIGURE 5.24THE SUBFRFDI VALUES FOR SUBSTRUCTURES IN DAMAGE CASES 13, MULTIPLE DAMAGE. ... 109
FIGURE 5.25THE SUBFRFDI VALUES FOR SUBSTRUCTURES IN DAMAGE CASES 14, MULTIPLE DAMAGE WITH VARIOUS DAMAGE LEVEL. ... 109
FIGURE 5.26THE SUBFRFDI VALUES FOR SUBSTRUCTURES IN DAMAGE CASES 15, MULTIPLE DAMAGE WITH VARIOUS DAMAGE LEVEL. ... 110
FIGURE 5.27THE SUBFRFDI VALUES FOR SUBSTRUCTURES IN DAMAGE CASES 16, MULTIPLE DAMAGE WITH VARIOUS DAMAGE LEVEL. ... 110
FIGURE 5.28AN SUBFRFDI-BASED PROTOCOL ... 113
FIGURE 5.29.DIAGRAM OF PZT-STRUCTURE BONDED SYSTEM ... 115
FIGURE 5.30.BLOCK OVERVIEW OF AD5933 ... 118
FIGURE 6.1ACCELERATION RECORD FROM WIRELESS SENSING NODES AND REFERENCE SENSOR. ... 121
FIGURE 6.3POWER SPECTRAL DENSITY OF ACCELERATION RECORD FROM WIRELESS SENSING NODES AND REFERENCE SENSOR.
... 122
FIGURE 6.4A1/8-SCALED THREE-STOREY STEEL FRAME MODEL. ... 124
FIGURE 6.5ACCELERATION RECORD FROM WIRELESS SENSING NODES ... 125
FIGURE 6.6.RESPONSE FOR ANN AND WIRELESS SENSOR NODE ... 126
FIGURE 6.7SPRR FOR VARIOUS PERIOD MEASUREMENT ... 128
FIGURE 6.8COMPARISON OF SUCCESS PACKETS RECEIVED RATE(SPRR) FOR WELL TIME SCHEDULE AND NON TIME SCHEDULE. ... 129
FIGURE 6.9.SUCCESSFUL PACKET RECEIVED RATE (SPRR) TO RFPOWER AND DISTANCE ... 130
FIGURE 6.10.THE EXPERIMENT SETUP AND SENSOR LOCATIONS ... 133
FIGURE 6.11PREVIOUS TENSILE TEST ... 133
FIGURE 6.12PHOTO OF NIOUDOU BRIDGE ... 134
FIGURE 6.13WEAK PART OF THE STEEL BAR ... 135
FIGURE 6.14 EXCAVATION OF SOIL GROUND, ... 135
FIGURE 6.15WIRELESS SENSING NODE POSITION. ... 136
FIGURE 6.16MODIFIED RELIABLE DATA-SENSING AND TRANSMISSION SERVICE ... 137
FIGURE 6.17RESPONSES OF SENSOR NODES FOR INTACT CASE. ... 138
FIGURE 6.18COMPARISON OF SCOURING AND INTACT BRIDGE PIER WITH FREE VIBRATION RESPONSE ON THE TOP NODE. ... 139
XVII
FIGURE 6.19COMPARISON OF FFT FOR SCOURING AND INTACT BRIDGE PIE. ... 139
FIGURE 6.20EXPERIMENTAL SETUP FOR WIRELESS SHM SYSTEM AND IMPEDANCE MEASUREMENT DEVICE ... 140
FIGURE 6.21SUBFRFDI VALUE: DAMAGE ON FIRST FLOOR. ... 141
FIGURE 6.22A BASELINE OF UNDAMAGED STATE AND FOUR DAMAGED IMPEDANCE CURVES. ... 142
FIGURE 6.23A DAMAGE METRIC CHART OF RMSD FOR DAMAGE ON JOINT 4. ... 143
FIGURE 6.24A PHOTOGRAPH OF THE TEST STRUCTURE.(B)THE IMOTE2.NET-BASED SENSING NODES FIXED ON THE FLOOR. ... 144
FIGURE 6.25PHOTOGRAPHER OF DAMAGE SCENARIO:(A) DAMAGE SCENARIO 1.(B) DAMAGE SCENARIO 2.(C) DAMAGE SCENARIO 3.(D) DAMAGE SCENARIO 4. ... 145
FIGURE 6.26ACCELERATION OF WIRELESS SENSOR AND REFERENCE SENSOR ... 147
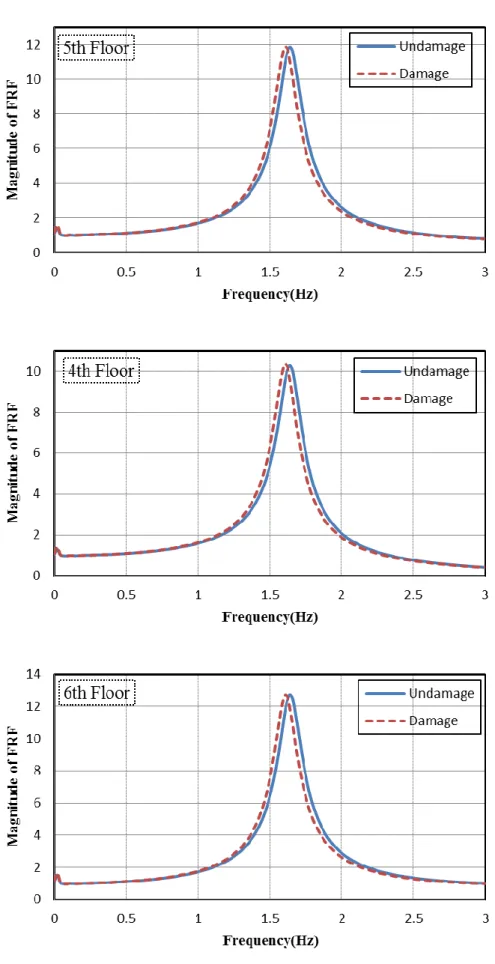
FIGURE 6.27.FRF OF THE STRUCTURE:(A)1F,(B)2F,(C)3F,(D)4F,(E)5F,(D)6F ... 150
FIGURE 6.28COMPARISONS OF MODAL PARAMETERS IDENTIFIED BY EMBEDDED FRF AND ANNSI. ... 152
FIGURE 6.29THE SUBFRFDI FOR DAMAGE SCENARIOS 1–4. ... 154
FIGURE 6.30PZT SETUP ON THE TEST STRUCTURE. ... 155
FIGURE 6.31RMSD FOR DAMAGE SCENARIO1 ... 156
FIGURE 6.32RMSD FOR DAMAGE SCENARIO2 ... 156
FIGURE 6.33RMSD FOR DAMAGE SCENARIO3 ... 157
CHAPHER 1 INTRODUCTION
1.1 Background of Structural Health Monitoring
Monitoring the structural health of buildings and civil infrastructure has received
considerable interest recently. A low-cost, real-time monitoring system with high
stability and robustness is required. A successfully implemented structural health
monitoring (SHM) system has several benefits to the end user of a structural system.
For example, a well designed SHM can reduce risk to operators and structural system,
reduce risk through life-extending operation and control based on the use of health
monitoring information and reduce cost for servicing structural systems based on
condition-based maintenance scheduling [1].
Monitoring the structural health of a given structural system is a damage
identification process that includes damage detection, damage localization, damage
type evaluation, and damage severity estimation. Damage can be defined as changes
to a structural system, such as its material and/or geometric properties, that alter its
current or future performance [2, 3]. Structural health monitoring can be classified as
local and global monitoring. Non-destructive evaluation (NDE) techniques are the
most widely used methods for local health monitoring. Conventionally adopted global
structural monitoring methods are vibration-based schemes. These methods identify
damage by detecting modal property changes in, say, natural frequencies, modal
damping, or mode shape [4].
The SHM problem is fundamentally one of statistical pattern recognition
(1). Operational Evaluation:
Define damage for the system being monitored, realize the conditions, both
operational and environmental, under which the system to be monitored, know the
limitations on acquiring data in the operational environment.
(2). Data Acquisition, Fusion and Cleansing:
The data acquisition portion of the SHM process involves selecting the types of
sensors, choosing the locations where the sensors should be placed, deciding the
number of sensors to be used, and selecting the types of data
acquisition/storage/transmittal hardware.
(3). Feature Extraction and Information Condensation:
Feature extraction is the process of the identifying damage-sensitive properties,
derived from the measured system response, which allows one to distinguish between
the undamaged and damaged structure.
(4). Statistical Model Development for Feature Discrimination.
The algorithms used in statistical model development usually fall into t fall into
the general classification referred to as supervised learning, unsupervised learning,
group classification and regression analysis.
After SHM was established, the next stage is a lead-in of damage prognosis. The
damage prognosis is a process of predicting the future probable capability of a
structural material or system in an online manner, taking into account the effects of
damage accumulation and estimated future loading. Figure 1.1 illustrates the relation
Figure 1.1 The relation between usage monitoring, structural health monitoring, and damage prognosis.
1.2 Motivation and Objective
In SHM, integration of cross discipline is essential for developing a flexible and
robust system. For example, Civionics is currently the use of electronics for structural
health monitoring (SHM) of civil structures. It is combination of electronic
engineering with civil engineering, in a manner similar to avionics (aviation and
electronics) and mechatronics (mechanical engineering and electronics) [7].
Generally, sensors comprise a significant portion of the SHM process. Recent
developments in smart sensor technology enable new applications in structural health
monitoring. The main features of a typical smart sensor are on-board microprocessor,
sensing capability, data storage, wireless communication, battery power, and low cost. Actual Loading and operating condition Structural system Input and environment measurement Response measurement Usage Monitoring
System Assessment Model
Structural Health Monitoring
Damage Accumulation Model
Damage Prognosis
Predictive Loading Model
Future Loading Model
Sensors are being deployed in civil infrastructures. Long term recorded data for
monitoring are extensive. Smart sensors can process data before outputs are recorded,
which reduces the quantity of data required and computing power [8].
When many sensors are implemented, wireless communication appears to be an
attractive approach. Wired sensor systems can only deploy limited numbers of sensors
because of cost constraints or excessive complexity. Wireless sensors are expected to
minimize these problems by simplifying the installation of wired sensors [9-11].
Smart sensor-based wireless sensor networks (WSNs) are an attractive sensing
technology for structural health monitoring applications because of their low
manufacture costs, low power requirements, small size, and simple deployment (i.e.,
lack of cables) [12, 13].
Although numerous researchers have demonstrated the advantages of WSN
[12-17], there are still existing many limitations. First, the wireless throughput is
heavy to collect all of the measured information in SHM. The aggregation of dynamic
measurement data consumes power- and time- consuming even when data are not
collected in real time. For instance, Kim et al. [18] developed a multi-hop wireless
sensor network to monitor the Golden Gate Bridge. They reported that transferring
KB data from 64 nodes required over 12 hours. Moreover, sensor nodes are not
synchronized with separate clocks. Packets may be lost in communication or sensing,
and storage memory space is always limited. Therefore, an effective time-scheduling
and data transmission protocol should be developed.
Additional, the processing ability of processor of node in WSN is slower than
that of a PC. In SHM, a complex parameter identification-based embedded damage
WSN hardware. Therefore, a non-parameter embedded damage detection approach
such may be considered a appreciate approach.
Next, battery powered wireless nodes have limitations on consuming large
amounts of power in packets delivering. Hence, power sources and power
consumption are the critical issue if batteries have to be periodically replaced.
Therefore, an intelligent self -powered wireless sensor networks via harvest and store
ambient sources of energy should be considered to solve this barrier.
Furthermore, implementing an embedded algorithm in a complex development
environment commonly involves hardware and software complexities, making the
task quite challenging, especially for civil engineers with limited experience of WSN.
Also, robust system development is problematic in a complex programming
environment. Accordingly, a WSN-based SHM system should be developed based on
an easy-to-use development environment. Related applications can be implemented
efficiently in this the friendly environment.
The main purpose of this dissertation is to propose a framework of an integrated
wireless sensor network-based structural health monitoring system in buildings and
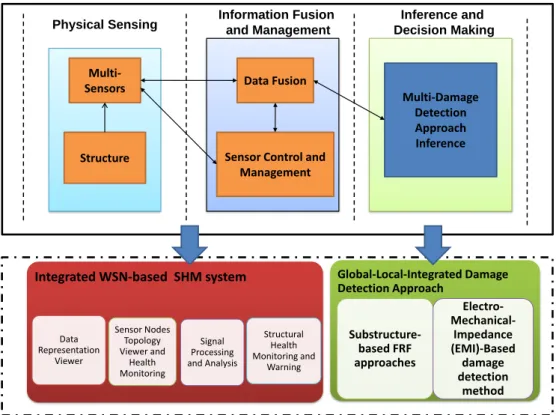
civil infrastructures. Figure 1.2 illustrates the proposed framework. In this framework,
it is considered three main parts which are the physical sensing, information fusion
and management, and inference and decision making. To achieve this goal, an
integrated WSN-based SHM system is developed. This system consists of sensing
nodes, cluster head nodes, transfer node, and base station. The purpose of sensing
node is to measure the responses of structure or the environmental parameters. Cluster
head node can communicate with the sensing nodes or other cluster heads of the
transfer node is functions as coordinate node for managing the cluster heads and
hoping the data. The base station is the highest level end device that has largest
memory, most powerful processor and highest communication capability. The base
station node is the gateway between smart sensor networks and the Host computer.
The base station uploads the data to remote monitoring and control server via satellite,
3G telecommunication or WiMAX communication. A three-tier software framework
is also developed in this work serving as reliable data-sensing and transmission, data
logging and data storage, user interface, data analyzing, and signal processing. Based
on this software framework, a SHM application for specific purpose can be easily
developed. Power sources and power consumption are the critical issue in WSN if
batteries have to be periodically replaced. Hence, a novel windmill-magnet integrated
piezoelectric (WMIP) energy harvesting system was also proposed.
Both local and global SHM each has its own benefits and shortcoming, hence
integrating aforesaid two approaches can obtain more effective damage detection
result than only using one of them. This work proposed a global-local-integrated
damage detection approach to localize damage. Substructure-based frequency
response function approaches are proposed as global damage detection approach.
Electro-Mechanical-Impedance (EMI)-Based damage detection method is used to
identify local damage of structure in this study. In addition to theoretical
developments in damage assessment approach and developing of wireless SHM
Figure 1.2 A framework of an integrated wireless sensor network-based structural health monitoring system.
1.3 Overview of Dissertation
This research focuses on realization of a vibration based SHM framework
employing WSN based SHM system that can detect and localize damage. In
addition to introduction in Chapter 1, Chapter 2 provides a review related to damage
detection method and WSN-based SHM approaches that have been developed in
literatures.
Since the WSN plays a significant role in this study, its basic theories and related
techniques are briefly introduced in Chapter 3. In this Chapter, the basic wireless
sensor technology would be introduced. WSN based architecture and protocol stack
and operating systems for WSN then addressed. Time synchronization and related Integrated WSN-based SHM system
Data Representation Viewer Sensor Nodes Topology Viewer and Health Monitoring Signal Processing and Analysis Structural Health Monitoring and Warning Multi-Sensors Structure Data Fusion
Sensor Control and Management
Multi-Damage Detection Approach Inference Physical Sensing Information Fusion and Management Decision MakingInference and
Global-Local-Integrated Damage Detection Approach Substructure-based FRF approaches Electro- Mechanical-Impedance (EMI)-Based damage detection method Structural Health Monitoring and Warning
applications are also included in this Chapter.
After the theoretical basis of WSN is established, the proposed integrated
WSN-based SHM system then presented in Chapter 4. The architecture of this SHM
system and wireless sensor nodes design are presented in Chapter 4. Chapter 4 also
shows the proposed Windmill-magnet integrated piezoelectric (WMIP) energy
harvesting system which is used to harvesting ambient energy. The software is also an
important part in this system. The proposed three-tier software framework and reliable
data-sensing and transmission service are hence included in this chapter.
Chapter 5 shows the proposed global-local-integrated damage detection approach.
The theoretical basis and numerical study are presented in this chapter. The
substructure-based frequency response function based global damage detection
approaches are presented. Subsequently, the Electro-Mechanical-Impedance
(EMI)-based local damage detection method is proposed herein to detect the local
damage.
In Chapter 6, this dissertation focused on the experimental study. When the
theoretical basis of damage detection method and wireless SHM system based
measuring system are completed, series experimental study are conducted to verify
the proposed algorithm and system. First off all, the wireless SHM system is verified
involving sensor calibration, wireless communication quality, data losing, interference
in material, power consumption. Subsequently, the proposed wireless SHM system is
employed in a bridge structure to test the feasibility in field. Next, the proposed
damage detection approach with proposed wireless SHM system then investigated in
a ¼ -scale six-storey steel structure that was designed by the National Center for
In the end of this dissertation, Chapter 7 summarizes the research detailed on the
analytical and experimental study in this dissertation and presents possible directions
CHAPHER 2 LITERATURE REVIEW
2.1 Introduction
This chapter provides a review related to SHM techniques and WSN-based SHM
approaches that have been developed in literatures. Since the SHM can be classified
as global and local monitoring, the global and local damage detection methods are
briefly reviewed respectively. Moreover, this work focus on using WSN related
techniques in developing SHM system. Some representative applications of
WSN-based SHM, including theoretical developments, experimental validations, and
practical applications, will be briefly reviewed in this chapter.
2.2 Structural Health Monitoring Approach
2.2.1
Global Damage Detection Method
Some global health monitoring methods are studied on either finding shifts in
resonant frequencies or changes in structural mode shapes. Early works in health
monitoring found that loss of a single member in a structure can result in changes in
the fundamental natural frequency of one to as much as thirty percent. However, it is
easy to see that some damage forms may not affect the frequency at low levels of
vibration [8]. Although locating damage using frequency shifts requires either very
accurate measurements or large damage extent, recent researches have shown that
using resonant frequencies can get much less statistical variation from random error
sources than other modal parameters [19, 20]. More detailed discussion related to
presented a efficient method using mode shape information for locating structural
damage without the accurate FEM model. Mayes [24] developed a structural
translational and rotational error checking (STRECH) method for locating model error
by mode shape changes. Other studies provide instances of those mode shapes-based
modal assurance criteria (MAC) and coordinate MAC (COMAC) values can be used
to identify damage [25-27].
Early researchers [28] indicated that mode shape changes are not sensitive to
locate local damage, an improved method for locating damage is to use the mode
shape curvature. The using of mode shape curvature appears to be more sensitive for
detecting damage due to losing stiffness of member than the mode shapes themselves
[29]. Pandey [29] using the central difference operator to compute curvature values
from the displacement mode shape. Their results demonstrate that changes in mode
shape curvature can be a good damage index for the FEM beam structures. Topole and
Stubbs [30] survey the practicality of using a limited set of modal parameters for
detecting structural damage. Chance et al. [31] used measured strains instead to
measure curvature directly, which dramatically improved unacceptable errors in
calculating curvature from mode shapes.
Another class of damage detection method is based on the structural model
matrices updating such as mass, stiffness, and damping. By solving the constrained
optimization problem, this method updates model matrices using the structural
equations of motion, the nominal model, and the measured data. Based on the various
algorithms, the method can be classified as optimal matrix update methods [32-35],
sensitivity-based update methods [36-39] and eigenstructure assignment method [40,
unique [8].
Statistical pattern-recognition approaches are widely used in Global SHM. Sohn
et al. [42] presented two pattern recognition techniques using time series method to
analyze fiber optic strain gauge data obtained from two different structural conditions
of a surface-effect fast patrol boat. The first technique combines Auto-Regressive (AR)
and Auto-Regressive with eXogenous inputs (ARX) prediction models and the second
technique employs outlier Mahalanobis distance measure-based analysis. These two
methods were successfully employed to identify different structural damages by using
data sets changes. The method in [42] is further applied to the damage detection of the
benchmark problem designed by the ASCE task group [43]. The damage detection
approach on the originally extracted damage-detection feature is modified to consider
the influence of excitation variability and the orders of the ARX prediction model.
Medium and severe damages are successfully detected and localized. This approach is
investigated using various acceleration responses generated with different
combinations of structural finite element models, excitation conditions and damage
patterns in the benchmark study.
Artificial neural networks (ANNs) have been recently studied in SHM. Chen et
al. [44] used ANNs to identify the structural dynamic parameters by using the
structural responses in a building structure subjected to earthquake. The simulation
results showed that the structural dynamic behavior can be well modeled by the
trained neural networks. Wu et al. [45] employed ANNs for detecting structural
damage in a three-story frame. The ANNs was used to recognize the frequency
response characteristics of undamaged and damaged structures. The changing damage
extents were simulated by changing the properties of individual members. Wen et al.
adopts an unsupervised neural network which incorporates the unsupervised fuzzy
neural network (UFN) to localized damage. The damage localization feature (DLF) is
applied to locate structural damage by using the UFN. The analysis results indicated
that the use of fuzzy relationship in UFN made the detection of structural damage
more robust and flexible than the back-propagation network (BPN). In [47], ANNs
has been used to training a set of strain measurements for different types of damage in
a structure. Although ANNs can identify new damage type and location patterns, with
a limited set of training examples, convergence is not guaranteed.
In addition to above method, wavelet-based damage detection method is also
widely used in SHM [48-50]. The advantage of using wavelets is the capability to
perform local analysis of a signal. Hence, wavelet analysis can find hidden
information in data that other signal analysis methods may fail to detect. This property
is essential for effective damage detection [50]. The wavelet-based damage detection
approach is widely used to identify modal parameters of structural systems [51, 52],
to detect beam structure damage [49, 53, 54], and to de-noise of signals [55, 56]. The
discrete wavelet transform (DWT) shows that the de-noising capability is sufficient
for detecting drill fractures and bearing race faults [56-58].
2.2.2
Local Damage Detection Method
The Non Destructive Testing (NDT) technique is mostly used in local damage
detection. There are many methods for NDT such as ultrasonic, infrared thermography,
eddy current X–ray. Such methods can detect tiny or incipient damage; however, it is
usually expensive, power hungry and bulky. Sansalone and Carino [59] developed an
detect flaw in thin concrete structures.
Another impact method is known as impulse response, transient dynamic
response, or impedance testing [60]. In their approach, both force history of the
impact and the response of the structure are measured. The typical impulse response
spectrum of the structure can be acquired using measured response and force history
by using a signal processing technique. The impulse response spectrum of a structure
reflects to the characteristic of structure such as geometry, the support conditions, and
the cracks on structure.
The use of eddy current method has been developed for detecting
surface-breaking cracks in the area of welded connections. One advantage of this
method is that it can detect surface cracks of steel without removing paint.
Commercial sensors have been designed for detecting the cracks of welds in highway
bridges in the field. This eddy current-based method has successfully been employed
in detecting the crack [61, 62].
Ultrasonic time of flight diffraction (TOFD) method has been developed to
detecting and quantifying eye bars cracking. Compare to pulse-echo methods used the
specular reflections from the crack face, this method is based on using the wave
diffraction from a crack tip. Washer [63] applied this technology in the detection of
eye bar cracks.
Electro-Mechanical-Impedance (EMI)-Based damage detection method is a new
method of performing NDT by analyzing the electromechanical coupling property of
piezoelectric materials. The EMI-based damage detection approach uses active
surface-bonded PZT (Lead zirconate titanate) patches to sense structural-mechanical
the a PZT bar connected to a structure. Sun et al. [65] then experimentally used
electrical impedance method to acquire FRF for a single location and to transfer FRF
between two locations on a structure. This technique has proven effective in several
experimental applications, including aircraft structures [66], temperature-variable
applications [67], civil structural components [68], concrete structures [69], and PSC
girder bridges [70]. Impedance methods also continue to attract the attention of
researchers and field engineers. Park et al. [71] summarized future issues of the
impedance method from hardware and software standpoints. Such issues include the
difficulties in handling the crisp PZT sensors and in bonding them to the structure, the
bulky and expensive analyzers required for impedance testing, the difficulties and
complexities of acquiring and processing data in large-scale complex structures, and
high power consumption.
2.3 Wireless Sensor Networks-Based Structural Health Monitoring
Applications
Recently, smart sensor-based WSN has been considered as an alternative
technology for SHM. In this section, available wireless sensor platforms developed in
the academia and industries are reviewed, and applications of WSN to SHM of civil
structures are also reviewed.
Mascarenas et al. [72] developed a mobile host-based WSN monitoring system.
The mobile host transmitted energy to power the sensor node wirelessly. When the
sensor node has received adequate energy for sensing, the sensor node then start
sensing and wirelessly transmits the measurement to the mobile host. They used a
commercially available radio-controlled helicopter to deliver microwave energy to
Mexico. The helicopter successfully delivered sufficient microwave energy to charge
a wireless sensor node to get displacement measurements and transmit the data back
to the helicopter. The results of this experiment show that a mobile-based wireless
sensor network can feasibly be used to SHM.
Kim et al. [73] proposed a WSN SHM system which was deployed and tested on
the 4200ft long main span and the south tower of the Golden Gate Bridge (GGB). 64
nodes are distributed deployed in the GGB deployment, over the main span and the
tower, collecting ambient vibrations synchronously at 1kHz rate, with less than 10μs
jitter, and with an accuracy of 30μG. The sampled data is collected via a 46-hop wireless network, with a bandwidth of 441B/s at the 46th hop. The collected data
agrees with theoretical models and previous studies of the bridge. The deployment is
the largest WSN for SHM.
Cho et al. [74] presented a structural health monitoring (SHM) system using a
dense array of scalable smart wireless sensor network on a cable-stayed bridge (Jindo
Bridge) in Korea. 70 sensors and two base station computers have been deployed to
monitor the bridge. This autonomous SHM application is consideration with harsh
outdoor surroundings. The performance of the system has been tested in terms of
hardware stability, software reliability, and power consumption. 3-D modal properties
were extracted from the measured 3-axis vibration data using output-only modal
identification methods.
Potential of WSNs for using in bridge management has been evaluated in [75].In
their study, a network of seven sensor nodes was installed on the Ferriby Road Bridge,
a three-span reinforced concrete bridge. Three displacement sensor nodes were placed
inclinometer sensor nodes were mounted on two of the elastomeric bearing pads to
measure the change in inclination of the bearing pads. Another node was used to
monitored temperature in the box that contained the gateway. They suggest that the
sensors are stable enough for long-term use. Sensor networks represent a useful tool
that can be used to supplement, but not replace, visual inspection.
Recently, a mobile wireless sensor network is proposed for installation on a
heavy truck to capture the vertical acceleration, horizontal acceleration and
gyroscopic pitching of the truck as it crosses a bridge [76]. The vehicle-based wireless
monitoring system is designed to interact with a static, permanent wireless monitoring
system installed on the bridge. Specifically, the mobile wireless sensors
time-synchronize with the bridge's wireless sensors before transferring the vehicle
response data. Vertical acceleration and gyroscopic pitching measurements of the
vehicle are combined with bridge accelerations to create a time-synchronized vehicle–
bridge response dataset. In addition to observing the vehicle vibrations, Kalman
filtering is adopted to accurately track the vehicle position using the measured
horizontal acceleration of the vehicle and positioning information derived from
piezoelectric strip sensors installed on the bridge deck as part of the bridge monitoring
system. Using the Geumdang Bridge (Korea), extensive field testing of the proposed
vehicle–bridge wireless monitoring system is conducted. Experimental results verify
the reliability of the wireless system and the accuracy of the vehicle positioning
CHAPHER 3 WIRELESS SENSOR NETWORKS
3.1 Introduction to Wireless Sensor Networks (WSN)
Recently, advanced micro-electro-mechanical systems (MEMS) technology,
wireless communications, and electronics engineering have improved the
development of WSN. WSN is based on wireless sensor nodes. These tiny wireless
sensor nodes, which consist of sensing, processing, and communicating components,
collaborate with each other via wireless communication.
WSN have great potential for many applications in different scenarios such as
natural disaster monitoring [77], military target tracking and surveillance [78],
biomedical health care [14], and hazardous environment investigation and seismic
sensing [79]. In military target tracking and surveillance, a WSN can assist army to
detect and identify enemy target such tank movements as spatially-correlated and
coordinated troop. With natural disasters, wireless sensor nodes were used to sense
and detect the environment to forecast disasters before they occur. In biomedical care
applications, the wireless sensors can help monitor a patient’s health in surgical. For
seismic sensing, deployment of large numbers of wireless sensors along the volcanic
area can detect the development of earthquakes and eruptions.
A wireless ad hoc network is a kind of wireless technology. It is decentralized
type of wireless network. The network does not rely on a preexisting infrastructure.
Instead, each node forward data dynamically based on the network connectivity. Ad
hoc networks can use flooding for forwarding the data. There are differences between
illustrate below [80]:
i. The number of sensors in a WSN can be several orders of magnitude higher than an ad hoc network.
ii. Sensor nodes are densely deployed in field. iii. Sensor nodes are expected to failures in WSN.
iv. The topology of a sensor network changes when sensor node failure.
v. WSN mainly use broadcast or tree communication paradigm whereas most ad
hoc networks are based on point-to-point communications.
vi. WSN are limited in power, computational capacities, and memory.
Yick [81] classified the WSN into five types: terrestrial WSN, underground WSN,
underwater WSN, multi-media WSN, and mobile WSN. Terrestrial WSNs typically
consist of hundreds to thousands of inexpensive wireless sensor nodes deployed in a
application area. For deploying WSN, sensors can generally either deterministically or
randomly be placed in an area of interest [82]. The type of sensors determines the
choice of the deployment scheme rely on application and the environment. A viable
controlled node deployment is necessary when sensors are expensive or when their
operation is significantly affected by their position. Such scenarios include
underwater WSN applications, highly precise seismic monitoring, and placing
imaging and video sensors. Moreover, in some applications random distribution of
wireless sensor nodes is the necessary option. This is chiefly fact for harsh
environments such as a battle field or a disaster region. Depending on the node
distribution and the level of redundancy, random node deployment is considered a
3.2 Subsystem of Smart Wireless Sensor Node
In this section, the subsystems of a smart wireless sensor are discussed. Figure
3.1 shows the composition of wireless sensor node. Generally, a smart wireless sensor
is composed of three or four functional subsystems: on-board micro-processor unit,
sensing unit, wireless communication unit, and power unit [12, 83]. The
computational micro-processor was generally used for the computational tasks. For
SHM application, to convert analogue sensor outputs to a digital format, the ADC
with a resolution of 16 bits or higher is needed. The sensing unit always includes an
ADC to connect sensors. For capturing low-order global response modes of a civil
structure, the wireless sensing unit should be designed to record response data at
sample rates at least 100 Hz. To capture high-order response modes of structural
components of civil structure, the wireless sensing unit should therefore need
relatively as high as possible sample rates (greater than 500 Hz) [12, 84]. The random
access memory (RAM) was used to stack the measured and processed data. A flash
memory with software programs was used for the system operation and data
processing [85]. A 16 bit digital sensor data could be stored at one time, at least 256
KB of RAM is required for a WSN application. For the simultaneous multiple tasks
application, at least approximately 256 KB of flash memory would be provided for
that purpose [84]. The wireless communication unit is used to communicate with
other wireless sensor nodes and to transfer the sensing data using a RF radio modem
and antenna Lower data loss rate is necessary for the highly reliable wireless
communication in the conditions of channel interference, multi-path reflections and
path losses. Radio signals always decrease as they propagate through structural
materials such as reinforced concrete or steel material and the large scale civil
Figure 3.1 Composition of wireless sensor node
3.3 Wireless Sensor Platforms
A number of smart wireless sensor platforms have been developed in academia
and industries. Straser and Kiremidjian [87] first proposed a design of a low-cost
wireless modular monitoring system (WiMMS) for monitoring the civil structures by
integrating a microcontroller and a wireless radio. Lynch et al. [88] used more
powerful computational unit to improve the WiMMS. The WiMMS platform has been
improved further by Wang et al. [89] with a software service which utilize the
computational power of the wireless sensor for multiple tasking (e.g. processing or
transmitting data while collecting data). The tasks can be executed simultaneously.
Aoki et al. [90] have developed remote intelligent monitoring system (RIMS) for
structural health monitoring of bridges and infrastructures. The RIMS consists of
high-clock microcontroller, 3-axis MEMS piezoresistive accelerometer, and
internet-based wireless modem. This system can be controlled via ethernet protocol.
monitoring bridges and buildings. DuraNode not only has a special feature for
wireless sensing but also allows the wired internet data communication for building
structures using an established Local Area Network (LAN). Farrar and Allen [92]
have developed a smart wireless sensor platform, called Husky. This platform
performs a series of damage detection algorithms by embedding a Java-based damage
detection algorithm package (DIAMOND II). Chen and Liu [93] presented a mobile
agent approach for enhancing the flexibility and reducing raw data transmission in
wireless structural health monitoring sensor networks. In their approach, they
developed an integrated wireless sensor network consisting of a mobile agent-based
network middleware and distributed high computational power sensor nodes. A
mobile agent system called Mobile-C was embedded this mobile agent middleware.
The mobile agent middleware allows a sensor network moving dynamically to the
data source. With mobile agent middleware, a sensor network is able to be
implemented in newly developed diagnosis algorithms and can be adjusted in
response to operational or task changes.
Besides the smart wireless sensor platforms developed in the academia, a number
of commercial smart wireless sensor platforms have been also developed for SHM
applications in the industries. Mica Motes, which is initially developed at the
University of California-Berkeley and subsequently commercialized by Crossbow Inc.,
may be the most famous commercialized wireless sensor platform. The Mote is an
open source wireless sensor platform with both its hardware and software. Motes is
very popular to the public [12]. The Wisden was design for structural data acquisition.
The Wisden perform wavelet-based compression techniques to overcome the
bandwidth limitations based on Mica2 motes platform [94]. Mica mote and
monitoring system. The developed system can successfully monitor the concentrated
load position or a loose bolt position [95]. The performance of the mica mote was
investigated through a two story steel structure testing on shaking table. The results
shows that Mica mote can get the sufficient performance for the intended purpose
[96]. Mote has been successively revised to Imote and Imote2 by Intel. The Imote2
may be the most powerful and promising smart wireless sensor platform for SHM. It
built with 32 bit XScale processor with a RAM of 32 MB and a flash memory of 32
MB, and an integrated radio with a built-in 2.4 GHz antenna. Nagayama et al. [11]
successfully implemented a decentralized computing strategy in a wireless smart
sensor networks that used Imote2 for system identification. In their study, the
measured data was aggregated locally by a selected sensor node within the
communication distance in sensor group, and only limited pre-processed data was sent
back to the base station to locate the health of the structure.
3.4 Factors Influencing Sensor Network Design
Based on lacking of power, having physical damage or environmental
interference, some sensor nodes may fail or be blocked. The failure of sensor nodes
should not affect the overall task in WSN. Therefore, the reliability or fault tolerance
issue should be considered. Robust fault tolerance is the ability to endure sensor
network functionalities without any interruption due to sensor node failures [97].
In studying a different phenomenon, the hundreds or thousands number of sensor
nodes may be deployed. Depending on the application, the number may reach an
extreme value of millions. The new WSN approaches must be able to deal with this
number of nodes. The high density nature of the sensor networks can be less than 10
The cost of a single node is very important to influence the overall cost in WSN
with a large number of sensor nodes. If the cost of the WSN is more expensive than
deploying traditional sensors, then the WSN is out of its benefit. It is why the cost of
each sensor node has to be kept low. For example, the novel technology allows a
Bluetooth radio system to be less than 10$ [99]. Also, the cost of a sensor node should
be much less than 1$ in order for the WSN to be feasible in the future.
The size of sensor node may be another important issue in some WSN
applications. The required size may be smaller than even a cubic centimeter which is
light enough to remain suspended in the air [100]. Apart from the size, there are also
some other constraints for designing a sensor node. These nodes must [101]
i. Consuming in extremely low power,
ii. Operating in high volumetric densities,
iii. Having low production cost and be dispensable, iv. Operating unattended,
v. Be adaptive to the environment.
Sensor nodes are densely deployed to record different phenomenon. Therefore,
they usually work isolated in remote geographic areas. They may be working
i. in busy intersections,
ii. in the interior of a large machinery,
iii. at the bottom of an ocean, iv. inside a twister,
v. on the surface of an ocean during a tornado,
vi. in a biologically or chemically contaminated field, vii. in a battlefield beyond the enemy lines,
viii. in a home or a large building, ix. in a large warehouse,
x. attached to animals,
xi. attached to fast moving vehicles, and xii. in a drain or river moving with current.
3.5 The 802.15.4 and Zigbee Standards
The ZigBee Alliance [102] is an association of companies working together to
develop reliable, cost-effective, low-power wireless networking standard. ZigBee
technology was applied in a wide range of products and applications across consumer,
commercial, industrial and government markets worldwide. ZigBee builds upon the
IEEE 802.15.4 standard which defines the physical and MAC layers for low cost, low
rate wireless application. ZigBee defines the network layer specifications for star, tree
and peer-to-peer network topologies and provides a framework for application
programming in the application layer. Figure3.2 shows the 802.15.4 and Zigbee
Architecture. The following subsections give more details on the IEEE and ZigBee
Figure 3.2 802.15.4 and Zigbee Architecture
IEEE 802.15.4 standard
The IEEE 802.15.4 standard [103] defines the protocol of the physical and MAC
layers for Low-Rate Wireless Personal Area Networks (LR-WPAN). The advantages
of an this standard maintaining a simple and flexible protocol stack that are ease of
installation, reliable data transfer, short-range operation, extremely low cost, and a
reasonable battery life.
The physical layer supports three frequency bands and 27 channels with Direct
Sequence Spread Spectrum (DSSS) access mode: a 2450 MHz band (with 16
channels), a 915 MHz band (with 10 channels) and a 868 MHz band (1 channel), all
using the. The 2450 MHz band employs Offset Quadrature Phase Shift Keying
(O-QPSK) for modulation. The 868/915 MHz bands rely on Binary Phase Shift
Keying (BPSK). In addition to radio on/off operation, the physical layer supports
functionalities for channel selection, link quality estimation, energy detection
IEEE 802.15.4 MAC Applications IEEE 802.15.4 2400 MHz PHY IEEE 802.15.4 868/915 MHz PHY • Network Routing • Address translation • Packet Segmentation • Profiles ZigBee •Packet generation •Packet reception •Data transparency •Power Management •Channel acquisition •address •Error Correction
measurement and clear channel assessment.
The MAC layer defines two types of nodes: Reduced Function Devices (RFDs)
and Full Function Devices (FFDs). The FFDs node are equipped with a full set MAC
layer functions can act as a network coordinator or a network end-device. When
acting as a network coordinator, FFDs using beacons for synchronization,
communication and network join services. RFDs can only act as end-devices which
equipped with sensors/actuators. They may only interact with a single FFD. Two main
types of network topology are considered in IEEE 802.15.4, namely, the star topology
(Fig3.3)and the peer-to-peer topology (Fig3.4).
Figure 3.3. Star topology
Full function device
Reduced function device Communications flow
Master/slave
PAN
Coordinator
Figure 3.4. Peer-to-peer topology
The ZigBee standard
ZigBee [102] deals with the higher layers of the protocol stack. The network
layer (NWK) organizes and provides routing over a multihop network (built on top of
the IEEE 802.15.4 functionalities). The Application Layer (APL) provide a interface
for distributed application development and communication. The APL comprises the
Application Framework, the ZigBee Device Objects (ZDO), and the Application Sub
Layer (APS). In the Application Framework, user can defined have up to 240
Application Objects of a ZigBee application. The ZDO provides services that allow
the application objects to discover each other and to organize into a distributed
application. The APS offers an interface to data and security services to all application
objects and ZDO.
ZigBee identifies three device types. A ZigBee end-device is corresponding to an
IEEE RFD or FFD for a simple task. A ZigBee router is an FFD with routing
capabilities. The ZigBee coordinator is an FFD for managing the whole WSN. The
Full function device Communications flow