Environmental Changes Below Dams After
Sediment Sluicing
Shinsuke Kajiwara, and Hirotoshi Nakayama
Abstract
In the Mimikawa River in Kyushu, Japan, due to heavy rainfall during Typhoon No.14 (Nabi) in 2005, many slope failures along the river bank caused a huge amount of sediment to flow into dam-regulating reservoirs which brought about a flood disaster. The disaster revealed the problems caused by sediment in the river basin and discussions started on the necessity of sediment management in the river basin overall, including mountainous areas.
In October 2011, Miyazaki Prefecture, the river administrator, formulated the “Mimikawa River Basin Integrated Sediment Flow Management Plan” which described the current status of the complex Mimikawa River sediment problems and possible approaches to solve these problems, while balancing flood control, water usage and environmental conservation. As part of the Management Plan, Kyushu Electric Power Company, KEPCO, being responsible for dam installation, aims to restore the flow of sediment which has been trapped by dams since dam construction to the original flow of sediment before dam construction, and developed a plan for sediment sluicing operation. KEPCO has been carrying out sediment sluicing operation at two dams (Saigou and Oouchibaru Dams) in the Mimikawa River since 2017. Since sediment dynamics in the Mimikawa River are expected to change very significantly due to sluicing, KEPCO is analyzing and assessing the impacts on the downstream environment and improving the annual sediment sluicing plan by incorporating assessment results.
Keywords: Sediment Sluicing, Environmental Changes, Monitoring
1.Introduction
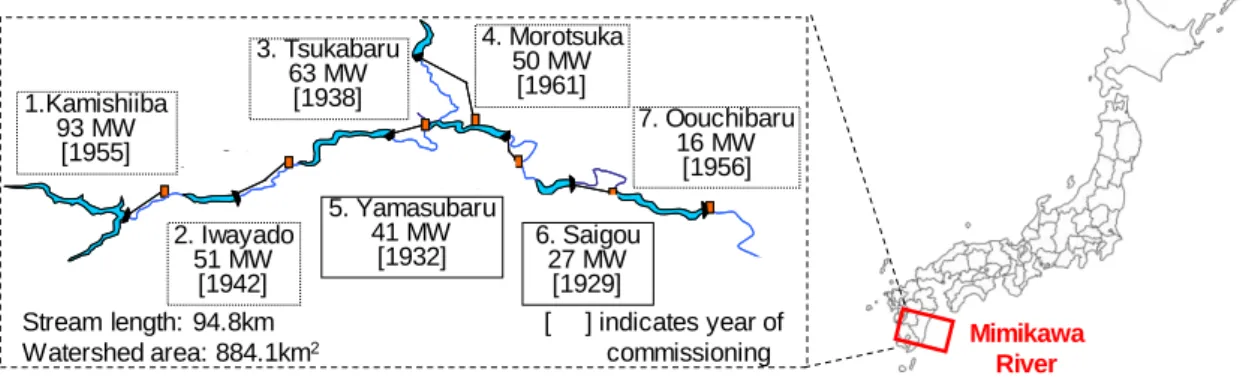
The Mimikawa River, a class B river with a stream length of 94.8km and watershed area of 884.1km2, flows from its source in a range of high mountains reaching to 1,700 – 1,800m which forms the backbone of the island of Kyushu, to the Hyuga-nada Sea in Miyazaki Prefecture. Kyushu Electric Power Company, or KEPCO, has 8 dams and 7 hydroelectric power stations in the Mimikawa River system, one of the most important hydroelectric power generation areas in the Kyushu region (Fig. 1).
2.Method of sediment sluicing operation at dams
Sediment sluicing operation at a dam is the drawing down of dam water level at times of river flooding due to typhoons to create a river state in which sediment flowing in from the upstream is fed downstream of the dam. (Figs. 2, 3). KEPCO decided to carry out sediment sluicing at three dams located in the mid to downstream basin of the Mimikawa River which was affected by a large-scale flood disaster caused by Typhoon No.14 in 2005. In order to facilitate sediment sluicing operation, KEPCO implemented retrofitting work on the existing Saigou and Yamasubaru Dams by cutting down the dam bodies by approx. 4m and approx. 9m respectively and newly installing large spillway gates. For Oouchibaru Dam, the furthest downstream, the existing dam crest height was low and no retrofitting work was implemented, but by changing operation during times of river flooding due to typhoons, sediment sluicing is carried out.
① 上椎葉 ② 岩屋戸 ③ 塚原 ④ 諸塚 ⑤ 山須原 ⑥ 西郷 ⑦ 大内原 日向市 ① 上椎葉 ② 岩屋戸 ③ 塚原 ④ 諸塚 ⑤ 山須原 ⑥ 西郷 ⑦ 大内原 日向市 Mimikawa River 1.Kamishiiba 93 MW [1955] 2. Iwayado 51 MW [1942] 4. Morotsuka 50 MW [1961] 5. Yamasubaru 41 MW [1932] 6. Saigou27 MW [1929] 7. Oouchibaru 16 MW [1956] [ ] indicates year of commissioning Stream length: 94.8km Watershed area: 884.1km2 Miyazaki,Kyushu 3. Tsukabaru 63 MW [1938]
Fig. 1:Locations of dams in the Mimikawa River system
①
②
(a) (b)
Free flow
(a) Dam retrofitting (reservoir level reduction) (b) Sluicing of sediment (early realization of
flood control + environmental measures)
Saigou Dam
(Q=1,427m3/s)
① Process of dam sediment accumulation under conventional operation (image)
② Dam sediment sluicing management (ideal image)
3. Overview of river flooding, and results of sediment sluicing
operation at dams for 2017
In 2017, sediment sluicing operation was carried out at Saigou Dam, for which retrofitting work and sluicing preparation had been completed, and at Oouchibaru Dam. As these were the first sediment sluicing operations to be carried out, first of all consideration was given to sudden changes in the river environment that might occur. For this reason, plans were made for small-scale sluicing, which for example, would be carried out over a short time, then actual sluicing operation was carried out during Typhoon No.5 (Noru)and No.18(Talim). For Typhoon No.5, rainfall was light, and it was considered that no result of sluicing could be expected so sluicing operation was stopped part-way. For Typhoon No.18, sediment sluicing operation was commenced on September 15 with operation times for Saigou and Oouchibaru Dams being 20 and 75 hours respectively. During river flooding due to the typhoon, maximum inflow volumes were 1,517m3/s and 1,670m3/s for Saigou and Oouchibaru Dams respectively.
4.Changes in sediment distribution after sediment sluicing operation
Concerning the downstream of Saigou Dam after carrying out sediment sluicing operation, for Typhoon No. 5 for which sluicing was stopped part-way, sediment was not fed from the dam upstream, but from sediment deposited directly below the dam before river flooding. Sediment particles no larger than m3 material (material with particle size of approx. 5-75mm) moved further downstream. Subsequently, due to sluicing operation carried out during Typhoon No.18, m2 material (material with particle size of approx. 5-200mm) was fed from the dam upstream and deposited in the range directly below to 0.5km downstream from the dam (Fig. 4).
Downstream of Oouchibaru Dam, before sluicing operation began, riverbed grain coarsening had been progressing. With this sediment sluicing operation, sand (particle size approx. 2mm) and smaller material was fed to the river channel downstream of the dam, although there was no significant change to the form of the river channel.
Currently, within the Oouchibaru dam-regulating reservoir, there are areas where riverbed height is low. For this reason, through repeated sediment sluicing, it is anticipated that sediment will be deposited in these areas, bedload components will be fed to the dam downstream, and changes, for example in river channel form, will appear.
Sediment distribution (from aerial photos and planar surface surveys) As at Aug 2017 【after Typhoon No.5】 As at Oct 2017 【after Typhoon No.18】 :Deposition :Outflow Sediment outflow (no larger than m2)
Sand and gravel deposition Sand and gravel
deposition m3 deposition Saigou Dam 0.5km downstream of dam 1.2km downstream of dam 1.5km downstream of dam 4.9km downstream of dam 5.9km downstream of dam m2 deposition m2 deposition To Oouchibaru Dam Sediment outflow (no larger than m3)
Sand and gravel deposition
Saigou Dam 0.5km downstream of dam 3.3km downstream of dam 5.9km downstream of dam Sand and gravel deposition m3 deposition m2 :5~200mm m3 :5~75mm
Sand and gravel:0.075~5㎜
:Deposition :Outflow 4.9km downstream of dam 2.6km downstream of dam 1.2km downstream of dam 2.6km downstream of dam 3.3km downstream of dam 1.5km downstream of dam
Fig. 4: Changes in sediment deposition after sluicing
5. Analysis and assessment of changes in river environment after
sediment sluicing operation at dams
To understand the changes in river environment resulting from sediment sluicing operation and improve planning for future sluicing operation, KEPCO is conducting environmental monitoring surveys. The items covered in the surveys are those which enable the simulation of sediment dynamics due to sediment sluicing, and thereby allow anticipated impact and response to be set. Specifically, survey items set for the physical environment, which are related to river channel form, include riverbed materials, and numbers of shallows and development of sandbanks. Survey items set for life forms include numbers of species and numbers of individuals for fish and bottom animals, together with attached algae and riverbank vegetation. In assessing the results of surveys, with reference having been made to BACI (Before-After Control-Impact) design and other methods of determining environmental impact, perspectives of before and after sluicing operation, and existence or absence of an effect due sluicing operation are combined. Changes in the natural status or environment over time at points in the river system (control areas) that are not subject to the effect of sluicing operation are
also determined. Then, by assessing the difference between these two, the effect due to sluicing operation can be understood.
6. Changes in physical environment after sluicing at dams
6.1 Changes in riverbed materials
Of the changes in riverbed materials after sluicing, results of assessment of changes in the proportion of materials that make up the river channel accounted for by sand and gravel are as follows. Of the material that made up the riverbed structure of the river channel downstream of Saigou and Oouchibaru Dams, a comparison was made of the proportions of the total river channel area accounted for by sand and gravel, before and after sluicing operation (Table 1). Downstream of Saigou Dam, sand and gravel were fed from the upstream due to sluicing, with the proportion accounted for by m2 material increasing from 13.5% to 18.5%, and that accounted for by m3 material increasing from 10.5% to 17.3%. Downstream of Oouchibaru Dam, there was almost no change in the proportion of gravel, but for sand (particle size 2mm or less) the proportion increased from 17.0% to 20.0%. The river channel downstream of Oouchibaru Dam had been subject to coarsening of the riverbed, however, it was confirmed that there was a tendency towards resolution of this with sand being fed downstream as a result of sluicing. Table 1: Changes in proportions of riverbed materials after sluicing
6.2
Changes in
river
channel
form
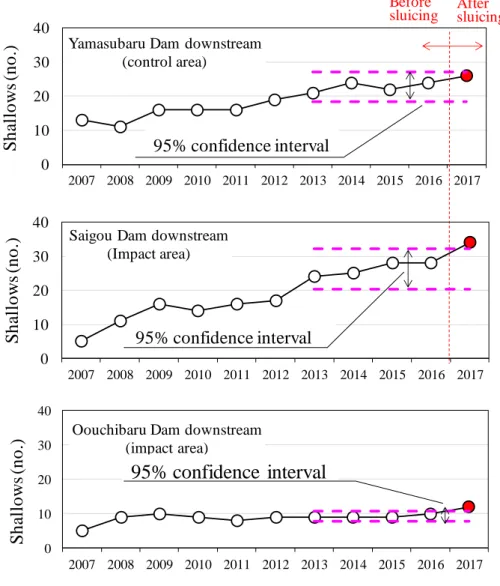
Of changes inriver channel form after sluicing operation at dams, the results of assessment for (1) increase in shallows and (2) development of sandbanks due to feeding of sediment are as follows. (1) Concerning increase in shallows, an increase in the number of shallows was confirmed in the river channel downstream of Yamasubaru Dam where sluicing has not yet commenced (control areas), and in the river channel downstream of both Saigou and Oouchibaru Dams where sluicing has been carried out (impact areas) (Fig. 5).
Point Material Riverbed materials (%) Before sluicing (Nov 2016) After sluicing (Dec 2017) Downstream of Saigou Dam m1+m3 26.5 28 m2 13.5 18.5 m3 10.5 17.3 Sand 34.0 28.5 Downstream of Oouchibaru Dam m1+m3 61.0 62.0 m2 6.0 6.0 m3 1.0 1.0 Sand 17.0 20.0 [particle size: m1: 75-500mm, m2: 5-200mm, m3: 5-75mm]
Concerning the causes of this, for the control areas, the increase in shallows was associated with natural fluctuations such as changes in the river flow channel. However, for the Saigou Dam downstream impact areas, the increase resulted from sandbank enlargement and formation associated with feeding of sediment, and therefore can be considered as an effect of sluicing.
(2) Concerning the development of sandbanks, using aerial photographs of Saigou and Oouchibaru downstream river channels, land area was extracted and compared before and after sluicing (Fig. 6). As a result of this comparison, it was found that land area in the Saigou Dam downstream had increased by approximately 3ha. However, when the same comparison was done for the Oouchibaru Dam downstream, it was found that there had been almost no change in land area. As mentioned previously, for Oouchibaru Dam currently bedload components are not being fed downstream. This is considered to be the reason that changes in land area could not be confirmed.
0 10 20 30 40 2007 2008 2009 2010 2011 2012 2013 2014 2015 2016 2017 Sh al lo w s (n o
.) Oouchibaru Dam downstream(impact area)
0 10 20 30 40 2007 2008 2009 2010 2011 2012 2013 2014 2015 2016 2017 Sh al lo w s (n o
.) Yamasubaru Dam downstream
(control area) 95% confidence interval
95% confidence interval
After sluicing 0 10 20 30 40 2007 2008 2009 2010 2011 2012 2013 2014 2015 2016 2017 Sh al lo w s (n o.) Saigou Dam downstream
(Impact area)
95% confidence interval
Before sluicing
15 20 25 30 H27 H28 H29 L and are a (ha ) 西郷ダム下流 通砂前最大・最小値 大内原ダム下流 After sluicing Before sluicing Range of variation in 2 years before sluicing
2017 2016 2015 Range of variation in 2 years before sluicing
Saigou Dam downstream
Min/max values before sluicing
Oouchibaru Dam downstream
Fig. 6: Change in land area after sluicing
7. Changes in life forms after sluicing at dams
From the results of monitoring surveys of life forms after sluicing at dams, the assessment made included species of fish, bottom animals and attached algae as well as river channel vegetation, but no substantial impact due to sluicing could be confirmed. However, for the Oouchibaru Dam downstream, changes such as in the species composition for fish in the main stream becoming closer to that in tributaries were confirmed. Compared to changes in the physical environment, it is considered that it will take longer for the impact of sluicing on life forms and habitat to become evident, and for this reason data collection will continue.
8. Conclusions
After carrying out sluicing operation at dams, in the Saigou Dam downstream, there were changes in the river environment, with an increase in shallows and development of sandbank area due to the feeding of sand and gravel being confirmed (Fig. 7). It was also found that in the Oouchibaru Dam downstream there was a tendency towards a resolution of coarsening of the riverbed due to the feeding of sand. However, because no substantial impact on life forms could be confirmed in any of the control or impact areas, data collection will continue.
Sandbank enlargement
Before sluicing (after Typhoon No. 5, taken Aug 2017)
After sluicing (after Typhoon No. 18, taken Oct 2017) : Shallows
: Sediment deposition location
Saigou Dam
Fig. 7: Changes in river channel after sluicing
References
MIYAZAKI PREFECTURE. Mimikawa River Basin Integrated Sediment Flow Management Plan. 2011. (in Japanese)
Kajiwara et al. (2018). Environmental changes at downstream of dams caused by sediment sluicing in Mimikawa River. Electric Power Civil Engineering,306
Kawakami et al. (2016). Overview of river environmental research-based monitoring plan for sediment sluicing at dams in the Mimikawa River Basin. JSCE, Vol.22, 421-426
Authors
Shinsuke Kajiwara (corresponding Author) Hirotoshi Nakayama
Civil & Architectural Engineering Division, KYUSH ELECTRIC POWER CO., INC. (KEPCO), Japan