國
立
交
通
大
學
企業管理碩士學程
碩
碩
碩
碩
士
士
士
士
論
論
論
論
文
文
文
文
公司在採用雲端運算之下的競爭優勢和資源配置
COMPETITIVE ADVANTAGE AND RESOURCE
CONFIGURATIONS OF COMPANIES IN CLOUD COMPUTING
BUSINESS
研 究 生:謝光玉
指導教授: 唐瓔璋 教授
中
中
中
中 華
華
華
華 民
民
民
民 國
國
國
國 九十
九十 九
九十
九十
九
九
九 年
年
年
年 六
六
六
六 月
月
月
月
國
立
交
通
大
學
企業管理碩士學程
碩
碩
碩
碩
士
士
士
士
論
論
論
論
文
文
文
文
公司在採用雲端運算之下的競爭優勢和資源配置
COMPETITIVE ADVANTAGE AND RESOURCE
CONFIGURATIONS OF COMPANIES IN CLOUD COMPUTING
BUSINESS
研 究 生:謝光玉
指導教授: 唐瓔璋 教授
中
中
中
中 華
華
華
華 民
民
民 國
民
國
國
國 九十
九十 九
九十
九十
九
九 年
九
年
年 六
年
六
六
六 月
月
月
月
公司在採用雲端運算之下的競爭優勢和資源配置
Competitive Advantage and Resource Configurations of companies in
Cloud computing business
研 究 生:謝光玉
Student: TA Quang-Ngoc
指導教授: 唐瓔 璋
Advisor: TANG Ying-Chan
國 立 交 通 大 學
管理學
全球 MBA
A Thesis
Submitted to Global Master of Business Administration Program College of Management
National Chiao Tung University in partial Fulfillment of the Requirements
for the Degree of Master
in
Business Administration June 2010
Hsinchu, Taiwan, Republic of China
i
Abstract
Based on the promising developments in Cloud Computing technologies in recent years, commercial computing resource services (e.g. Amazon) or software-as-a-service offerings (e.g. Salesforce.com) came into existence. More and more big name of high tech firms move from their traditional business to Cloud Computing business (e.g. Microsoft, Google, Dell, HP, IBM…). However, the relatively weak business exploitation, participation, and adoption of other Cloud Computing services remain the main challenges. Previous studies on competitive advantage and superior performance have demonstrated that financial ratios contain enough information to identify those resource configurations most strongly correlated with performance. In this research, we want to find out which current resource configuration and their impacts on competitive advantage. Because we could not directly observe the firm’s management capabilities, in this research, we create a framework to provide simple principle to examine the management capabilities. From comparative financial analysis, we conclude that that knowledge management capability is critical to performance of Cloud computing business.
ii
Abstract
基於 計算的發展前途的技術,近年來,商業計算資源服務(如 Amazon)或軟 件作為一種服務產品(如 Salesforce.com)誕生。越來越多的大牌 科技企業擺脫其傳 統業務 計算業務(如 Microsoft, Google, Dell, HP, IBM ...)。然而,相對薄弱的商業
發,參與,和通過其他 計算服務仍是主要挑戰。以往的研究上的競爭優勢和優越 的性能表明,財務比率包含足夠的信息來確定哪些資源配置最密切相 的性能。在本 研究中,我們要找出哪些現行資源配置和其產生的影 競爭優勢。因為我們無法直接 觀察該公司的管理能力,在本研究中,我們創建了一個框架,以提供簡單的原則,研 究管理能力。從比較財務分析,我們認為,知識管理能力是至 重要的性能 計算業 務。
iii
Acknowledgement
It is a pleasure to thank to my supervisor, professors, classmates and friends, those who help me to make this thesis possible.
First, I am heartily thankful to my supervisor, Professor TANG Ying-Chan, whose
encouragement, guidance and support from the initial to the final level enabled me to develop an understanding of the subject.
Second, I would like to thank Professor KANG Jin-su, who spent a lot of time on reviewing my thesis and gave me many valued ideas and comments. I also would like to show my gratitude to Professor LIOU Fen-May, Professor LIN Rong-He and Professor WANG Wei-Mei those who reviewed and commended on my thesis.
Lastly, I offer my regards and blessings to all of those who supported me in any respect during the completion of the thesis.
iv
Table of Contents
ABSTRACT ... i ACKNOWLEDGEMENT ... iii TABLE OF CONTENTS ... iv LIST OF TABLES ... viLIST OF FIGURES ... vii
I. INTRODUCTION ...1
1.1 Background ... 1
1.2 Issues ... 2
1.3 Purpose of research ... 3
II. LITERATURE REVIEW ...5
2.1 Definition of competitive advantage ... 5
2.2 Definition of cloud computing ... 9
2.3 Economic Value Added (EVA) ... 10
2.4 Resource-based view (RBV) ... 12
2.5 Financial indicators and competitive advantage ... 13
2.6 Industry Overview ... 14
v
2.6.2 Cloud computing market ... 17
III. RESEARCH METHODS ...21
3.1 Develop resource configuration model... 21
3.2 Data Collection and Processing ... 25
3.3 Data Analysis Method ... 25
IV. DATA ANALYSIS AND RESULTS ...27
4.1 Principle component analysis results ... 27
4.2 Interpretation of PCA results ... 28
4.3 Segregating Competitive Advantage and Competitive Disadvantage ... 30
4.4 Discriminant Function Analysis (DFA) ... 33
V. CONCLUSIONS AND RECOMMENDATIONS ...37
vi
List of Tables
Table 1 List of the definition of competitive advantage ... 9
Table 2 Comparison of different Traditional Performance Measures ... 11
Table 3 List of 30 companies related to cloud computing business ... 26
Table 4 Principal Component Analysis of Resource Configurations... 28
Table 5 Descriptive statistics of the sample companies ... 31
Table 6 Ranks the top 10 companies related co cloud computing business, and lists their resource-related financial ratios during 2004 – 2008 ... 32
Table 7 Group of competitive and disadvantage company ... 35
vii
List of Figures
Figure 1 Global trends on “Cloud Computing” ... 2
Figure 2 Research Process ... 4
Figure 3 Cloud Computing stacking ... 16
Figure 4 Cloud computing families and sub-segments offerings ... 16
Figure 5 Justification factors for Cloud computing interest ... 17
Figure 6 Expected impact of macro trends on Cloud computing adoption growth ... 18
Figure 7 Cloud computing maturity model (2009). ... 19
Figure 8 Current and projected size of SaaS, IaaS and PaaS markets ... 20
1
I.
Introduction
1.1BackgroundThe IT market is evolving quickly, driven by the increasing need for costs cuts and more agile and effective business processes. Cloud computing (CC) emerged as a promising computing model for providing utility-based, on-demand IT infrastructure services for anyone, anywhere and anytime.
The developments realized in the past few years in computing techniques, especially in Grid computing, enabled the emergence of numerous computing models: Utility computing, ubiquitous computing, cyber-infrastructure, e-science, e-infrastructure and, above all, Cloud computing. Although many believe that these Cloud-based technologies hold the potential to revolutionize the Internet, actual adoption of Cloud computing services in industry and business is still way under expectations. It seems that the transition from classical enterprise IT models to Cloud-based computing is still the biggest challenge in businesses and industry, despite all the advancements that supported this transition.
This CC revolution is said to be the future of IT industry. That’s why many IT giants can’t say “no” to join the CC battle. It is also the hot pie to attract many new comers to join in. In this battle, some players build up their own ecosystem inside the CC. It is determined that Amazon is a pioneer in this battle for a long time. They are now dominating the CC market by providing infrastructure service (Amazon Elastic Compute Cloud) (Deloitte 2009), revealing some news of their future platform and developing their end-used device (Kindle). Google wants to build their own CC based on their existent infrastructure (servers, data centers), platform (Google Apps Engine, Android, Chrome), personal service (Gmail, YouTube), and end-used devices (Nexus One). About the King of Wintel Empire – Microsoft, even CC will
2
make their market of licensing products (Windows, Office) decreased, but they cannot stay outside the game. They want their CC platform service (Windows Azure) can help the giant become the King again. Some young players such as Facebook is also taking the advantage of stand on the giant’s shoulder (Infrastructure of Amazon Web Services) to develop their
services. We can see that in the cloud, giants are moving from their traditional business to CC business. Their competitive strategy, dynamic management capabilities are a big question mark.
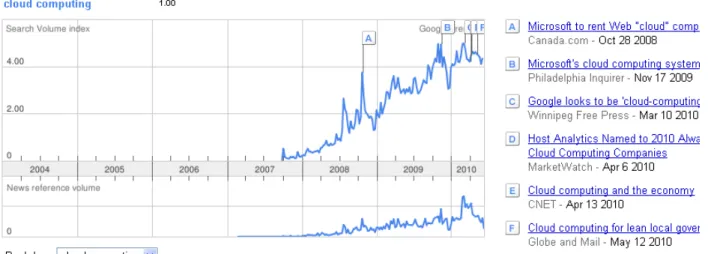
Figure 1 Global trends on “Cloud Computing” Source: Google, 2010
1.2Issues
Cloud computing business could be said the future of information technology industry. It attracts not only old IT giants but also new comers. Understanding the management
3
capabilities and their competitive advantage schemes is not revealed by outsiders. Therefore, clarifying the organizational management capabilities would help both, the business and the Cloud computing community, in accelerating adoption and creating sustainable performance.
Following the line of argument, this paper aims at addressing the following questions:
- What are the resource configurations among firms within cloud computing business? - Which management capabilities are the most important to firm’s performance?
1.3Purpose of research
In order to tackle these questions, this study would like to find the sources of competitive advantages of the new business - cloud computing and give some managerial
recommendations. Source of data will be collected from Compustat database. Those data will be used to do with two analyses, to find out what are sources of competitive advantage. Subsequently, further data process will help us distinguish how many firms are having competitive advantage or competitive disadvantage. The following is the study of the two research purposes:
1) According to a subsequent literature review pointed out the financial indicators, we would like to find out if the management capacity can be measured as a major factor in the use of these factors to test their operational performance.
2) With the results of literature review and empirical experience, we will, through the ability to view the different companies which had competitive advantage, and thus to make management recommendations to global cloud computing business.
This thesis will be divided in several sections. In the first section, we state the issues in cloud computing business. Section 2, we will go through literature review of defining
sustainable competitive advantage and examines its dynamic on financial performance. Section 3, we will provide general information of cloud computing business.
propose a framework to develop a resource configuration model to reveal the competitive advantage of firms; economic value added is the dependent variable, and various financial ratios are the explanatory variables. Section 5 applies the configuration model
companies in cloud computing business, discusses and concludes.
4
sustainable competitive advantage and examines its dynamic on financial performance. Section 3, we will provide general information of cloud computing business.
opose a framework to develop a resource configuration model to reveal the competitive advantage of firms; economic value added is the dependent variable, and various financial ratios are the explanatory variables. Section 5 applies the configuration model
companies in cloud computing business, discusses and concludes.
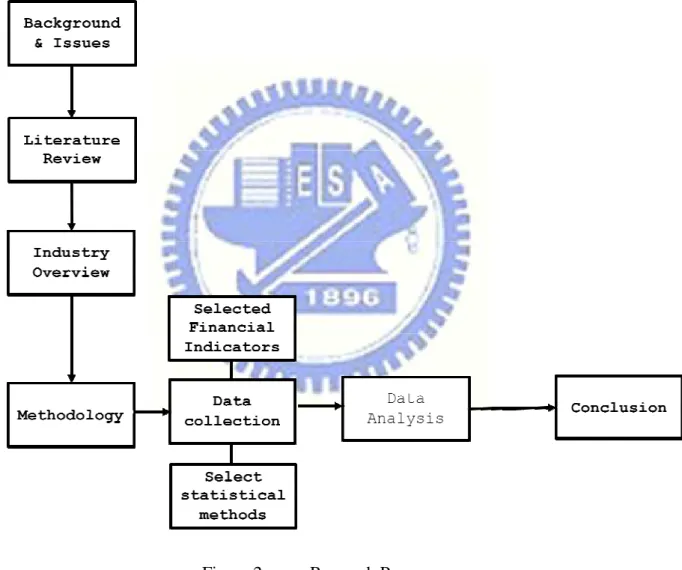
Figure 2 Research Process
sustainable competitive advantage and examines its dynamic on financial performance. Section 3, we will provide general information of cloud computing business. Section 4 we
opose a framework to develop a resource configuration model to reveal the competitive advantage of firms; economic value added is the dependent variable, and various financial ratios are the explanatory variables. Section 5 applies the configuration model to global
5
II. Literature Review
2.1Definition of competitive advantage
Porter (1985), in the book of “Competitive advantage” defines that competition is the key to success in business, deciding the innovation, cultural cohesion and implementation of efficiency and overall performance-related activities; advantage is accounted for in any environment. The basic premise of competitive advantage lies in creating firm’s value in excess of value-creating in the process of paying the cost of products with the value of the buyers’ willing to pay the price.
Ansoff and McDonnell (1990) defined as a company's competitive advantage in product / market scope in which has the qualities, and these qualities can bring with them superior than other competitors, competitive position. Porter (1985) defined a company’s competitive advantage is relative to other competitors and has superior performance to other competitors in the long run. If the company creates value for customers, the company will be able to gain a competitive edge, the company may, by three kinds of strategies to provide value, namely cost leadership, differentiation and focus. Aaker (1989) believes that a company owned assets and skills is the company's competitive basis, providing to the company's sustainable competitive advantage (SCA) and long-term. Barney (2001) believes that when companies receive excess returns on behalf of the remuneration for the use of resources greater than the expected value of the actual value shall be economic profit that are sources of competitive advantage. Hunt (2002) on the competitive advantage is defined as an enterprise's financial performance is better than industry average, and better financial
performance is not equal to the classical theory of the "excess compensation" or "economic rent" concept, but "above" or "superior" to industry averages.
6
Porter (1985) states that competitive advantage is the core of business success, which determines the corporate culture of innovation cohesion, execution and so on, with the overall performance of the various activities are closely related to competition policy so that
enterprises in basic industries to find a favorable competitive position, while the goal is to address the determinants of industrial competition and establish profitable but also sustainable competitive position. The basis for competitive advantage comes from, “it can create value for customers” and earns the high excess value of price and cost. The competitive advantage comes from within the firm’s product design, production, marketing and support operations and many other independent activities, which firm has a substantial contribution to the relative cost position, but also constitute the basis for differentiation.
Ghemawat (1992) says that the value is the customer willing to pay the price, excellent value from "Lower prices and competitors considerable benefits, or to provide enough to offset the unique benefits of its spread" . Because even if the development of different firms still need to keep the cost of similar competitors, the development of differentiated businesses, unless the product quality and the cost of the premium can exceed the difference between firms to get outstanding performance, so strategy is a better differentiation and lower cost structure formed by two distinct competitive edge. Therefore, the purpose of competitive strategy is the determinants of competitiveness for the industry and creates profit, but also a sustainable competitive position, competitive advantage derived from the in-house product design, production, marketing, transportation, independence activities.
Comprehensive definition of academics, this study suggests that competitive advantage is the company through its unique capabilities and assets, provide valuable products or services to customers, thereby enabling the company than its competitors in the market has a relatively superior competitive position. Competitive advantage is defined by scholars as follows:
7
Scholars The definition of competitive advantage
Porter (1985) A competitive advantage exists when the firm is able to deliver the same benefits as competitors but at the lower cost (cost advantage), or deliver benefits that exceed of those competing products
(differentiation advantage). Thus, a competitive advantage enables the firm to create superior values to its customers and superior profits for itself
Aaker (1986) Enterprises to establish competitive advantages and requires a sustained competitive advantage in nature, with three characteristics:
1, covering the industry, critical success factors that should be an important area for market advantage.
2, significant differences between competitors’ competitive advantage.
3, must be able to respond to the situation changes and competitor behavior.
Bakos & Treacy (1986)
Use of information technology can produce four source of competitive advantage:
1, to improve the operating efficiency and effectiveness.
2, developing inter-organizational synergies and the development of inter-organizational cooperation.
3, the use of IT technology to help product innovation.
8 Bamberger
(1989)
Competitive advantage is the only company in the industry to develop and market on the status of the unique advantages, including: low-cost and prices, better service, fast delivery, good image.
Ansoff & McDonnell (1990)
Competitive advantage is an enterprise in its product / market category possesses qualities, and these qualities can be compared with other competitors for the enterprises have a strong competitive position. Barney
(1991)
In the implementation of value-creating strategy, resulting out of or in relation to other competitors to adopt the same policy makers with a better implementation of the capacity to meet customer needs, and from the following three dimensions to observe: 1- Cost advantage 2,-the difference and 3- large number of customer-oriented
Hill & Jones
(1995)
Competitive advantage means an enterprise's profits exceeding the industry average, better than the competitor's capabilities,
Construction of four general basis for competitive advantage:
1, better quality
2, better efficiency
3, better innovation
4, better customer responsive
Sandy (1999) Competitive advantage is to obtain benefits from their relations to each other can be more efficient in the market to compete.
Barney (2001)
Enterprises excess rate of return, on behalf of the remuneration for the use of resources greater than the expected value of the expected value
9
and the actual value of the difference shall be economic profit
Hunt (2002) Company's financial performance better than the industry average and better financial performance is not equal to the classical theory of the "excess compensation" but "above" or "superior" to industry averages. Table 1 List of the definition of competitive advantage
2.2Definition of Cloud Computing
Daryl Plummer (Gartner 2009) defines cloud computing as "a style of computing where scalable and elastic IT-related capabilities are provided 'as a service' to external customers using Internet Technologies“. Cloud computing will be includes five most important features:
(1) Service based: Consumer concerns are abstracted from provider concerns through service interfaces
(2) Scalable & Elastic: Services scale on-demand to add or remove resources as needed.
(3) Shared: Services share a pool of resources to build economies of scale.
(4) Metered by use: Services are tracked with usage metrics to enable multiple payment models
(5) Internet Technologies: Services are delivered through use of Internet Identifiers, Formats, and Protocols.
LuisM.Vaquero et al (2009) defines: Clouds are a large pool of easily usable and accessible virtualized resources (such as hardware, development platform and/or services. These resources can be dynamically reconfigured to adjust to variable load (scale), allowing
10
also for an optimum resource utilization. This pool of resources is typically exploited by a pay-per-use model in which guarantees are offered by the infrastructure provider by means of customized SLAs (Service-Level Agreement). The set of features that most closely resemble this minimum definition would be Scalability, pay-per-use ability model and virtualization.
2.3 Economic Value Added (EVA)
Economic value added has become a popular measure of firm performance since the early 1990s. Stern Stewart & Co., which developed the technique, says it has worked with more than 300 companies to adopt EVA procedures. The EVA of the company is just a measure of the incremental return that the investment earns over the market rate of return. In simple terms, it can be stated that EVA measures the profitability net of cost of capital. As someone has aptly remarked, ‘you only get richer if you invest money at a higher return than the cost of money to you’. Everybody knows this but many seem to forget it. Thus, EVA can be taken as the net operating profit minus an appropriate charge for the opportunity cost of all the capital invested in an enterprise. As such, EVA is an estimate of true economic profit or the amount by which earnings exceed or fall short of the required minimum rate of return that shareholder and lenders could get by investing in other securities of comparable risk.
EVA is measured as a company's operating profit less the cost of capital employed to produce the earnings. Its basic formula is:
EVA = NOPAT-(WACC x IC)
Where: EVA = Economic Value Added
11 WACC = Weight Average Cost of Capital
IC = Invested Capital
The cost of capital (WACC) is thus the most important aspect of EVA. Under the traditional methods most companies appear to be profitable whereas in reality, they are not. As Peter Drucker (1995) has observed, “Until a business returns a profit that is greater than its cost of capital, it operates at a loss. Never mind that it pays taxes, as if it had a genuine profit. The enterprise still returns less to the economy than it devours in resources... until then it does not create wealth; it destroys it.” EVA takes this fact into consideration and states that
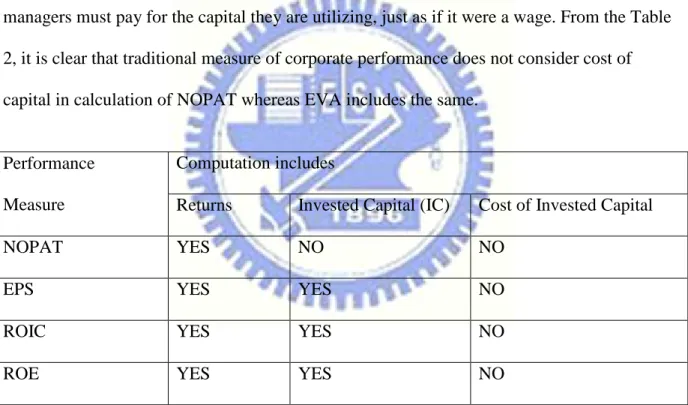
managers must pay for the capital they are utilizing, just as if it were a wage. From the Table 2, it is clear that traditional measure of corporate performance does not consider cost of capital in calculation of NOPAT whereas EVA includes the same.
Performance Measure
Computation includes
Returns Invested Capital (IC) Cost of Invested Capital
NOPAT YES NO NO
EPS YES YES NO
ROIC YES YES NO
ROE YES YES NO
Table 2 Comparison of different Traditional Performance Measures1
Source: Irala, L. R. (2005)
1 NOPAT: Net Operating Profit After Tax, EPS: Earning Per Share, ROIC: Return On Invested Capital, ROE:
12
EVA purports to have an advantage over other measures of performance such as net income because it considers the cost of all sources of capital--both debt and equity. In addition, adjustments are made to the accounting numbers in the computation of NOPAT. These adjustments include removing the effect of non-recurring charges such as extraordinary events and capitalized research and development expenses, as well as advertising expenses. These adjustments are intended to recognize the long-term benefit of the expenditures, thereby measuring the company's current performance more accurately.
2.4 Resource-based view (RBV)
The resource-based view (RBV) asserts that a firm can obtain sustainable competitive advantage by holding strategic resources that are valuable, rare, inimitable, and non substitutable (Barney, 1986). The RBV further specifies that resources are important antecedents to overall performance (Barney, 1991; Wernerfelt, 1984) and incomparable sources of sustainable competitive heterogeneity between and among firms (Hoopes, Madsen, and Walker, 2003). This framework has proven of great value to strategic management and marketing researchers investigating the sources of sustainable competitive advantage and organizational survival (Adner and Zemsky 2006; Kraatz and Zajac 2001; Morgan and Hunt, 1999; Srivastava, Fahey, and Christensen, 2001). Yet despite its rapid diffusion throughout the strategy and marketing literature, scholars challenge the RBV as being a tautological theory—one that is generally unclear on how its central claim can be objectively tested (Priem and Butler, 2001).
To address this weakness of the RBV, Powell (2001; 2002; 2003) suggests a Bayesian epistemological approach. He redefines the deterministic, unidirectional proposition “sustainable advantage generates superior performance” as a probabilistic inference: “sustainable competitive advantage is more probable in firms that have already achieved
13
sustained superior performance.” That is, the plausibility of a firm’s competitive advantage is conditional upon evidence of superior performance. Tang and Liou (2010) generalize
Powell’s probabilistic inference as an antecedent of resource bundle configuration and dynamic learning capability. They postulate that while a firm’s specific resource configuration and capabilities generally cannot be comprehended by outsiders, a firm’s financial indicators such as operating revenue, market share, and stock prices capture a firm’s superior performance. According to this inductive inference, the presence or absence of competitive advantage implies causal relations among resource configuration, dynamic learning capability, and superior financial performance.
2.5Financial indicators and competitive advantage
Competitive advantage and business performance of the mutual causal relationship exists between the problem (Priem and Butler, 2001a; 2001b). Tang and Liou (2010) demonstrate the relationship between a firm’s resource configuration and financial indicators relating to management capability. Such models are an effective way to demonstrate that sustainable competitive advantage is the best indicator of superior performance. According to this view, competitive advantage through enterprise’s resource configuration leads to business
performance. However, for outside viewers, competitive advantage and resource configurations cannot be directly observed; but we can post based Bayesian probability inference logic, from the enterprise's financial performance, dynamic management
capabilities, and resources among the three configurations of the relationship to infer back whether the enterprise has a competitive advantage. The next will further explain how to use the financial performance to measure the competitive advantages of strategic scholar defined the "value creation", and then use financial indicators used to analyze the resource
14
2.6 Industry Overview
2.6.1 Cloud Computing Business Overview
The Cloud is not as new as it seems. The Cloud symbol that permeates virtually all Cloud computing literature is more than 50 years old, as indeed are the concepts that were
recognized as early as the 1950s in the work done by AT&T in the area of telephony networking.
At that time, AT&T had already begun to develop an architecture and system where data would be located centrally and accessed by businesses through redesigned telephones and an updated telephone network. While the service did not materialize, the concepts and advantages were understood and relentlessly pursued through to this day.
The pursuit of centralized, abstracted IT services progressed over the decades with the advent and adoption of technologies such as Internet Service Providers (ISP - where servers were located at the Internet access point), and Application Service/Infrastructure Providers (ASP - where infrastructure was rented to a customer at an offsite location, but used most of the time by the one, paying customer). Other IT services historically offered include Time Sharing Systems, Co-Location, Hosting, and Outsourcing.
As with any evolution, the step from ASP to Cloud computing is subtle yet disruptively important. While ASPs managed the offsite infrastructure for a customer, they were bound to the concept that the infrastructure capacity was predetermined and inflexible; ASP customers were required to declare the quantity of compute and storage capacity needed up front. If the customer’s computing needs grew or contracted, the hardware had to be scaled up or down with an associated delay and up-front investment.
15
One of the main principles of Cloud computing, from Software-as-a-Service to Storage on demand, is that the computing capacity varies immediately and transparently with the customer’s needs, and clients no longer must plan, configure, and deploy fixed quantities of computing equipment, with associated costs, lead-times, and financial risks.
Indeed, from this evolution we find ourselves at the cusp of a significant transformation in Information Technology. Companies that are knowledgeable and prudently adopt Cloud computing will recognize significant benefits, while those that do not will be left ‘a step behind’ and see their competitors pull ahead as a result of lower operational costs and increased flexibility and deployment capabilities
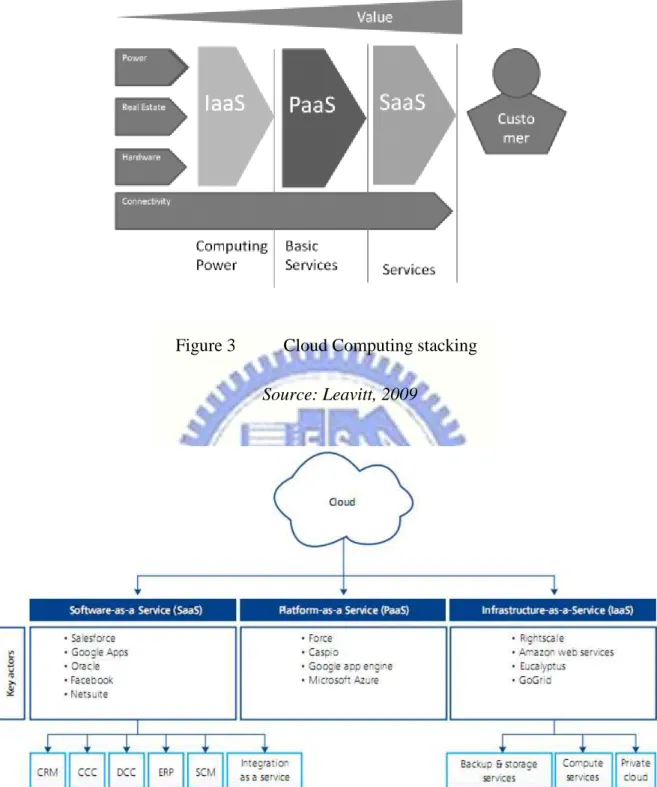
Cloud computing services divide into four distinct levels as stated in (Leavitt, 2009): Services. Some products offer Internet-based services—such as storage, middleware, collaboration, and database capabilities—directly to users. IaaS. Infrastructure-as-a-service products deliver a full computer infrastructure via the Internet PaaS. Platform-as-a-service products offer a full or partial application development environment that users can access and utilize online, even in collaboration with others. SaaS. Software-as-a-service products provide a complete, turnkey application including complex programs such as those for CRM or enterprise resource management via the Internet.
16
Figure 3 Cloud Computing stacking
Source: Leavitt, 2009
Figure 4 Cloud computing families and sub-segments offerings
17
2.6.2 Cloud computing market
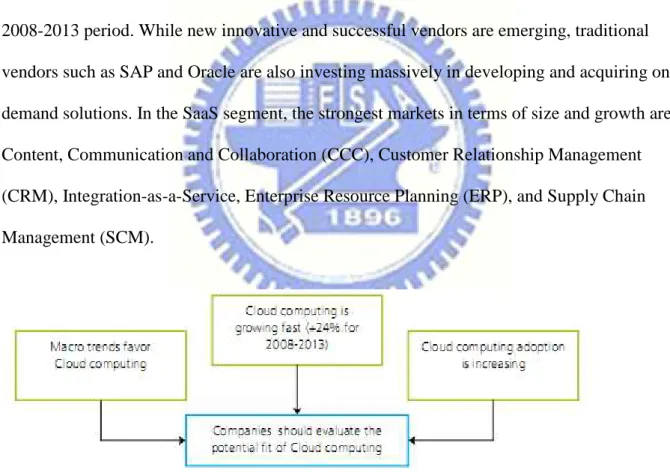
The Cloud computing market is growing rapidly. With many organizations starting to benefit from the Cloud, companies of all sizes should evaluate the potential fit.
Cloud computing is gaining importance for the following reasons:
Economic, social, technological and environmental trends are favorable to a further extension and broader adoption of Cloud computing. Policy makers are actively addressing the impact of Cloud computing on security, privacy, location and ownership of data.
The Cloud computing industry is growing sharply with a projected CAGR of 24% for the 2008-2013 period. While new innovative and successful vendors are emerging, traditional vendors such as SAP and Oracle are also investing massively in developing and acquiring on demand solutions. In the SaaS segment, the strongest markets in terms of size and growth are Content, Communication and Collaboration (CCC), Customer Relationship Management (CRM), Integration-as-a-Service, Enterprise Resource Planning (ERP), and Supply Chain Management (SCM).
Figure 5 Justification factors for Cloud computing interest
18
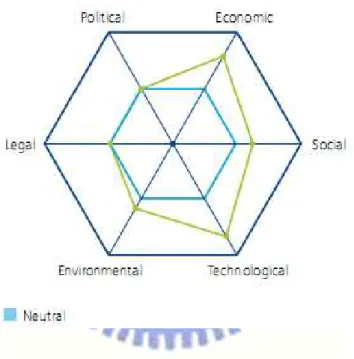
In general, the current macro environment offers a fertile ground for the increasingly rapid adoption of Cloud computing. Indeed, despite some uncertainties regarding future regulations and policies, we observe various positive signals from the economical, social, technological and environmental trends.
This section applies the PESTEL framework to systematically analyze the Political, Economical, Technological, Social, Environmental and Legal factors influencing the Cloud computing market in the coming years.
Figure 6 Expected impact of macro trends on Cloud computing adoption growth
Source: Deloitte, 2009
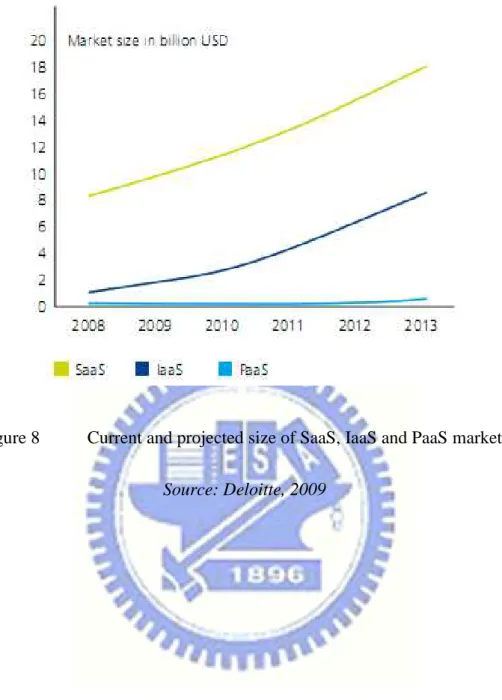
Cloud computing industry is growing quickly and vendors are investing significant amounts of money to develop solutions-as-a-service, suggesting they believe in the success of this technology as an alternative to traditional IT solutions.
Many experts state that the Cloud market will drastically expand in the coming years. For the 2008 - 2013 period, Gartner predicts an impressive growth of the Cloud computing
19
market from 9.1 to 26.6 billion USD, which represents a Compound Annual Growth Rate (CAGR) of 24% (these numbers exclude revenues derived from Cloud-based advertising).
The different segments of the Cloud computing market (SaaS, PaaS and IaaS) show different maturities and adoption levels. While SaaS definitely represents the largest portion of the Cloud computing market (89%), PaaS and IaaS have higher growth potential (~50%). This is justified by the later emergence of IaaS and PaaS compared to that of SaaS.
Figure 7 Cloud computing maturity model (2009).
The size of the ball represents the relative current market value (in 2009)
20
Figure 8 Current and projected size of SaaS, IaaS and PaaS markets
21
III.
Research Methods
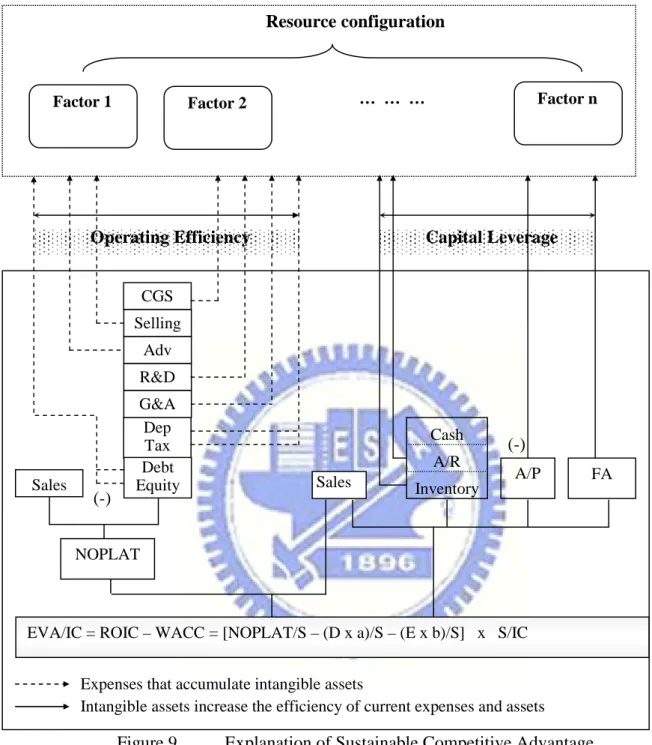
3.1Develop resource configuration modelIn this study, we will extends a previous four-dimensional resource configuration model (Tang and Liou, 2010) to N dimensions (see Figure 9), in order to better capture the dynamics of a firm’s valuable resources over time. In addition, the concept of a resource configuration includes underlying factors such as the existence of individual resource bundles, efficient alignment, and dynamic capabilities in addition to management capabilities. This variety provides firms with several alternative recipes for competitive advantage, improving
predictions of financial performance. Since resource bundles and management capabilities are heterogeneous both within and across industries, determining the sources of performance in a variety of contexts is a difficult problem. This flexible theoretical framework can
systematically investigate causal aspects of the competitive advantage proposition.
Return on invested capital (ROIC), return on equity (ROE), return on assets (ROA), gross margin, operating margin, and net margin are all proxies for performance (Grant, 2008). Tang and Liou (2010) decompose ROIC into several financial ratios to examine resource
configurations. This paper replaces ROIC with EVA to appraise the effect of financial leverage on competitive advantage or disadvantage. As discussed in previous literature review, EVA is count based on ROIC and weight average cost of capital (WACC)
As described above, EVA is measured as a company's operating profit less the cost of capital employed to produce the earnings.
Its basic formula is:
22 Where: CE= Capital Employed
NOPLAT: Net operating profits less adjusted taxes
NOPLAT = EBIT x (1-t) + deferred income tax (2)
NOPLAT = S-CGS-Adv-R&D-Dep-SG&A-Tax (3)
ROIC = NOPLAT / IC = NOPLAT/S x S/IC (4)
WACC (Weighted average cost of capital)
b IC Equity a IC Debts R IC Equity t R IC Debts R Equity Debts Equity t R Equity Debts Debts WACC e d e d × + × = × + − × × = = × + + − × × + = ) 1 ( ) 1 ( (5) Where
a = Rd x (1-t) , with Rd = cost of debt, t = income tax rate
Rd = Interest expenses / Debt = Debt x Interest rate / Debt = Interest rate
Therefore a = Interest rate x (1 – tax rate)
b = Cost of equity = Risk-free interest rate + Beta x Risk premium
Where
Risk premium = 0.0388 (geometric average premium during 1928-2008, for stocks over treasury bonds: Damodaran, 2009)
23 Replace NOPLAT and WACC into EVA/IC
= × − × = ⇒ × × − × × × = = × + × × = = ) S b E S a D -S NOPLAT ( S b E S a D -IC S S NOPLAT ) IC b E IC a D ( -IC S S NOPLAT WACC -ROIC IC S IC EVA IC S IC S IC EVA (6) / ) ( / ) & & ( S OL AP Cash Inv AR FA S b E a D Tax A SG Dep D R Adv CGS S IC EVA − − + + + × − × − − − − − − − = (7)
S = revenue; CGS = cost of goods sold; Adv = advertising expenses; R&D = expenditures on research and development; Dep = depreciation; SG&A = selling, general and administration expenses; AR = accounts receivable; Inv = inventory; FA = fixed assets; AP = accounts payable; OL = other current liabilities; TA = total assets; E = owners’ equity; D = Interest bearing debts;
The numerator of the first item in equation (7) is the ratio of resource-employment expenditures to sales, while the denominator consists of tangible asset turnover ratios. While the literature commonly interprets these financial ratios as outcomes of the firm’s strategic choices and subsequent operations (Grant, 2008), researchers are equally justified treating the financial ratios as resource bundles and capabilities deployed by the firm to create a
competitive advantage (Tang and Liou, 2010).
The following section applies this resource configuration framework to model the group of global companies in cloud computing business.
24
Resource configuration
(-)
(-)
Figure 9 Explanation of Sustainable Competitive Advantage
Note. Key: Adv= advertising expenses; A/R= accounts receivable; A/P= accounts payable; CGS= cost of goods sold; Dep= depreciation and amortization; FA= fixed assets; G&A= general and administration expenses; Selling= selling expenses; SG&A= adv + selling + G&A; R&D= research and development expenses; EVA = Economic Value Added; ROIC = Return on invested capital; WACC = Weighted average cost of capital; NOPLAT=Net profit less adjusted tax; S = sales or revenue; IC = Invested capital = Total assets - (account payable + other current liabilities); D = Debt; E = equity; a = interest rate (1 – tax rate); b = Risk-free interest rate + Beta x Risk premium
FA Cash
A/R
Inventory A/P CGS
Expenses that accumulate intangible assets
Intangible assets increase the efficiency of current expenses and assets Dep Tax Selling Adv R&D G&A Sales Factor 2 Factor 1 … … … Factor n
Operating Efficiency Capital Leverage
EVA/IC = ROIC – WACC = [NOPLAT/S – (D x a)/S – (E x b)/S] x S/IC NOPLAT
Debt Equity Sales
25
3.2 Data Collection and Processing
In this section, we will analyze the concept of sustainable competitive advantage in the global cloud computing services. To find out the finance data of companies serving cloud computing business, we base on some references and database. Those are “The Top 150 Players in Cloud Computing”, Cloud Computing Journal (2009), “85 Cloud Computing Vendors Shaping the Emerging Cloud”, Internet.com (2009) and Standard & Poor Compustat Database. Based on those sources of data, and set the only available data in Compustat
database, we found that there are 32 companies are serving cloud computing business, contributing a total of 160 fiscal year observations from 2004 to 2008. But 2 companies are lacked data on various expenditure components (R&D, SG&A, CGS, Dep., and Tax). Each sample contains only those companies with at least three years of complete data or a lifespan longer than three years. The samples do not include any companies with one or more financial indicators (excluding EVA) more than three standard deviations from the industry mean. None of these outliers are extraordinary performers. The final data set contains 30 companies with 150 observations from the period of 2004 to 2008. (Table 3)
3.3 Data Analysis Method
In the following section, a principle component factor analysis (PCA) extracts the underlying resource bundles and capabilities as well as linkages among these financial indicators. Discriminant function analyses (DFA) then identify the underlying resource configurations that best distinguish the 30 firms into competitive advantage or competitive disadvantage.
26
No Company Country
1 ADOBE SYSTEMS INC USA
2 AKAMAI TECHNOLOGIES INC USA
3 AMAZON.COM INC USA
4 ARIBA INC USA
5 AT&T INC USA
6 CA INC USA
7 CISCO SYSTEMS INC USA
8 CITRIX SYSTEMS INC USA
9 DELL INC USA
10 DESCARTES SYSTEMS GROUP INC USA
11 EMC CORP/MA USA
12 GOOGLE INC USA
13 HEWLETT-PACKARD CO USA
14 IBM CORP USA
15 INTEL CORP USA
16 INTUIT INC USA
17 KEYNOTE SYSTEMS INC USA
18 MCAFEE INC USA
19 MICROSOFT CORP USA
20 NETSUITE INC USA
21 NOVELL INC USA
22 ORACLE CORP USA
23 RED HAT INC USA
24 RIGHTNOW TECHNOLOGIES INC USA
25 SALESFORCE.COM INC USA
26 SAP AG USA
27 SUN MICROSYSTEMS INC USA
28 UNISYS CORP USA
29 VMWARE INC -CL A USA
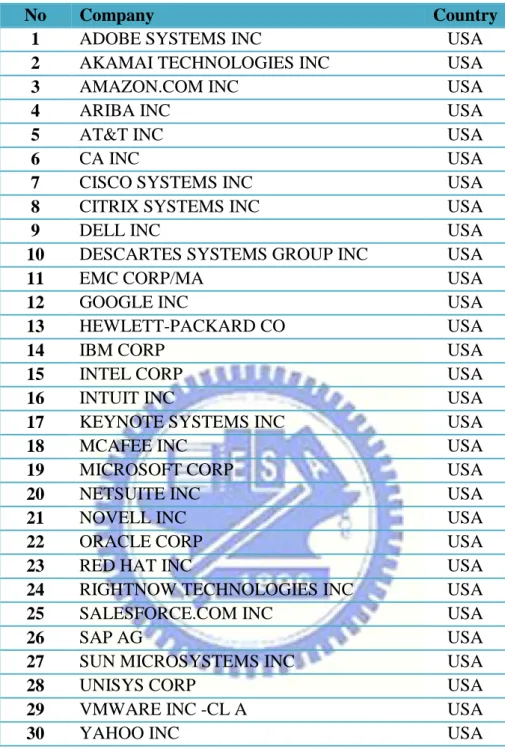
30 YAHOO INC USA
Table 3 List of 30 companies related to cloud computing business
27
IV.
Data analysis and results
4.1 Principle component analysis resultsAs discussed above, it might not be possible to directly observe a firm’s sustainable competitive advantage or its efficient alignments responsible for the same. However, certain effective configurations of observable traits can be inferred from the firm’s financial
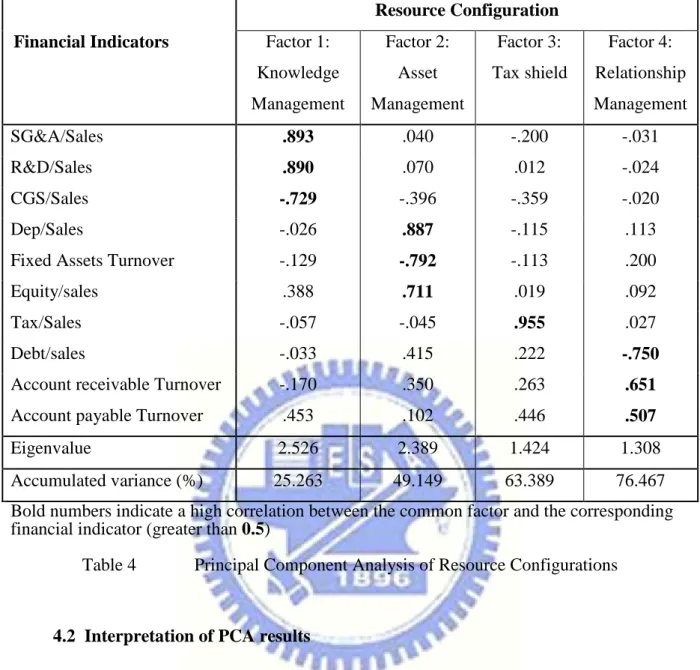
performance data. To begin with, principle component analysis (PCA) was conducted on the financial indicators (Inventory expenditure is not included here due to data constraints) to identify these configurations. After applying a varimax rotation and the eigenvalue (>1) criterion, PCA identified factors that account for 76.5% of the total variance in financial indicators during 2004-2008. Table 4 shows the principal resource configurations and their associated loadings, with significant values (0.5 and above) highlighted in bold.
28
Resource Configuration Financial Indicators Factor 1:
Knowledge Management Factor 2: Asset Management Factor 3: Tax shield Factor 4: Relationship Management SG&A/Sales .893 .040 -.200 -.031 R&D/Sales .890 .070 .012 -.024 CGS/Sales -.729 -.396 -.359 -.020 Dep/Sales -.026 .887 -.115 .113
Fixed Assets Turnover -.129 -.792 -.113 .200
Equity/sales .388 .711 .019 .092
Tax/Sales -.057 -.045 .955 .027
Debt/sales -.033 .415 .222 -.750
Account receivable Turnover -.170 .350 .263 .651
Account payable Turnover .453 .102 .446 .507
Eigenvalue 2.526 2.389 1.424 1.308
Accumulated variance (%) 25.263 49.149 63.389 76.467
Bold numbers indicate a high correlation between the common factor and the corresponding financial indicator (greater than 0.5)
Table 4 Principal Component Analysis of Resource Configurations
4.2 Interpretation of PCA results
In Factor 1, all significant financial indicators are related to “Knowledge Management”. This factor consists of three ratios: R&D to sales, the cost of goods sold (CGS) to sales, and selling, general and administration expenses (SG&A) to sales. This factor relates positively to both R&D/sales (r = 0.890) and SG&A/sales (r = 0.893), but relates negatively to CGS/sales (r = –0.729). These relationships imply that firms devoted to R&D, commercialization, and efficient administration develop lower production costs.
The second factor consists of indicators related to a firm’s “asset management”, including depreciation to sales ratio, fixed asset turnover and equity to sales. The negative correlation
29
between fixed assets turnover and Factor 2 (− 0.792) indicates that firms exhibiting greater competence in assets management generate revenue at a lower unit historical cost. It is
imperative in this cloud computing business that many firms fully utilize their fixed assets in a short period of time. This is very important with firms that invest a lot of capital in asset. Some firms related to provide services of infrastructure-as-a-service or platform-as-a-service such as Google, Microsoft, Salesforce or Amazon WS invested huge capital in many data centers. Those data centers are not only used for internal firm’s function, but also serving as a service for other firms. The high correlation between depreciation/sales and fixed asset management capability (0.887) reveals another unique feature of this capital- and equipment-intensive industry: that effective asset management is associated with low asset depreciation. This result underlines the importance of “light asset" operation in the cloud computing business group. This strategy is one of the most important feature of cloud computing business, firms can rent infrastructure that provide by other cloud computing firm in the supply chain. For instance, Facebook are very successful with a huge customer’ base even the company don’t have to invest in data centers, because they use the infrastructure and platform service from Amazon WS. Another notice is that the positive correlation between equity to sales and Factor 2 (0.711) indicates that firms finance capital to asset mostly by equity from investor. This is very true when we see that most high tech firms such as Google, Yahoo…are funded by investor to boost their business.
Factor 3, “tax shield”, consists of the taxes to sales (r = 0.955). This indicator has a very strong relation to factor 3. We can infer that the tax shield benefit gains in importance as the cloud computing business becomes more geographically diverse.
Factor 4 consists of all financial indicators related to “Relationship management”. This factor includes customer relationship management (accounts receivable turnover r = 0.651),
30
supplier relationship management (accounts payable turnover r = 0.507) and one variable associated with the creditor (debt to sales ratio r = -0.750). Thus, this factor illustrates the sustainable competitive advantage of firms that skillfully manage their upstream (suppliers), downstream (customers) and creditor relationships. There is also notice a negative correlation between Debt/sales and Factor 4 (− 0.750), indicating that good relationship management can pay off with respect to a lower debt. The form of Factor 4 indicates that all these firms are highly interdependent—each has to ally with both upstream and downstream members of the industry.
Principal component analysis thus confirms our proposition that the resource
configurations and management capabilities of firms can be inferred from their observable financial indicators. We will examine the reliability and validity of this inference in the following section.
4.3 Segregating Competitive Advantage and Competitive Disadvantage
As discussed above, to infer sustainable competitive advantage, it is necessary to investigate sources of competitive advantage and the valuation of sustained superior
performance on a deeper level. We follow Porter (1985), Hunt (2002), and Priem and Butler (2001b) in defining competitively advantaged firms as those whose financial performance is superior to the industry average. Companies with a high EVA will be more attract to investors because EVA capturing the true economic profit of an enterprise and EVA also is the
performance measure most directly linked to the creation of shareholder wealth. Furthermore, companies that have built up a sustained competitive advantage should generate a consistent or increasing EVA over a long period of time. Thus, only firms having a three-year average EVA (relative) above the industrial level are considered to have observable superior
31
We found there are 30 firms provided enough information on all of financial
indicators. Table 5 provides some descriptive statistics of the sample companies. The EVA / IC (percentage) ratio of individual firms range from -43% to 49%, with an average of 1%. Their assets range from US$107 million to US$213,200 million (AT&T).
Mean Median Std Dev Kurtosis Skewness Minimum Maximum EVA/IC 0.0054 0.0139 0.1912 1.3804 -0.2770 -0.4346 0.4915 ROIC 0.0956 0.1223 0.1832 1.4613 -0.2959 -0.3395 0.5608 Total Assets 25,975 5,221 45,670 10 3 107 213,200 CGS/Sales 0.3353 0.3091 0.2152 0.1084 0.8928 0.0347 0.8100 SG&A/Sales 0.4658 0.4353 0.2005 -1.1435 -0.0472 0.1128 0.8153 Dep/Sales 0.0614 0.0582 0.0369 1.4037 1.0858 0.0091 0.1704 Fixed Asset Turnover 10.7287 8.6154 6.5144 1.6929 1.1661 0.9897 28.3445 Tax/Sales 0.0405 0.0385 0.0414 2.6155 -1.0572 -0.0934 0.1081 R&D/Sales 0.1269 0.1390 0.0581 -0.5050 -0.7239 0.0069 0.2186 Receivables Turnover 6.7517 6.1118 3.4546 2.8927 1.2074 0.0404 17.8805 Account payable Turnover 27.1745 22.6315 18.2319 0.4264 1.1604 5.6123 71.1658 Debt/sales 0.1982 0.1003 0.2625 4.4691 1.9698 0.0000 1.1265 Equity/sales 1.0080 1.0406 0.6313 2.5124 0.9288 0.0114 3.0300
Table 5 Descriptive statistics of the sample companies
Source: Compustat database (sample size = 30)
EVA/IC = Economic Value Added / Invested Capital Invested Capital = Equity + Interest bearing debt
Accounts receivable turnover = Sales / accounts receivable Accounts payable turnover = Sales / accounts payable Fixed asset turnover = Sales / fixed asset
SG&A: Selling, general and administration expenses CGS: Cost of goods sold
32
Company EVA/IC ROIC TA CGS/S SG&A/S Dep/S FAT Tax/S R&D/S ART APT D/S E/S DELL 0.49 0.56 25,204 0.81 0.11 0.01 27.15 0.02 0.01 10.19 5.82 0.02 0.08 MICROSOFT 0.30 0.37 70,853 0.16 0.43 0.03 13.44 0.11 0.15 5.19 16.29 0.00 0.99 SAP AG 0.17 0.28 10,143 0.31 0.26 0.03 8.29 0.09 0.14 3.75 18.82 0.05 0.64 AMAZON 0.14 0.21 5,221 0.76 0.18 0.02 28.34 0.01 0.05 0.04 5.61 0.11 0.07 IBM 0.12 0.22 109,624 0.54 0.28 0.05 2.18 0.04 0.15 13.09 16.46 0.05 1.05 ADOBE 0.11 0.21 4,379 0.03 0.59 0.08 15.58 0.07 0.19 9.11 62.80 0.03 1.35 ORACLE 0.11 0.18 35,794 0.21 0.37 0.06 11.62 0.10 0.13 4.44 61.25 0.42 1.01 INTEL 0.11 0.16 50,238 0.32 0.30 0.13 6.60 0.07 0.06 3.53 12.08 0.29 0.28 CISCO 0.11 0.20 44,973 0.31 0.38 0.05 8.32 0.07 0.14 10.06 38.14 0.13 0.93 INTUIT 0.11 0.17 3,846 0.14 0.56 0.06 9.09 0.08 0.17 17.88 27.92 0.17 0.78 Industry Average 0.01 0.10 25,975 0.34 0.47 0.06 10.73 0.04 0.13 6.75 27.17 0.20 1.01
Table 6 Ranks the top 10 companies related co cloud computing business, and lists their resource-related financial ratios during 2004 – 2008
EVA/IC: Economic Value Added to Invested Capital; ROIC: return on invested capital; TA: total assets in million US dollar; CGS: Cost of goods sold; S: annual sales; ; SG&A: selling, general and administration expenditure; Dep/S: Depreciation to sales ration; FAT: fixed assets turnover ratio; Tax/S: Tax to sales ration; R&D/S: R&D to sales ratio; ART: accounts receivable turnover ratio; APT: accounts payable turnover ratio; D/S: Debt to sales ration; E/S: equity to sales ratio
From the above table, we see that DELL and MICROSOFT command the highest EVA/IC ratio in the industry. Three indicators confirm the existence of sustainable
competitive advantage of DELL: (1) they have among the highest fixed assets turnover and the lowest depreciation to sales ratio, indicating an ability of effective fixed asset
management; and also (2) their SG&A and R&D expenditures are lowest relative to sales, indicating effective knowledge management. In addition, DELL also takes the lowest account payable turnover and a very high account receivable turnover, indicating their effective relationship management capability with both customer and supplier. In other side,
MICROSOFT earns the sustainable competitive advantage by keeping the cost of good sales to sales at very low ratio among industry. The cost of goods sold -to-sales ratio is very low yielding high gross margins capable of subsidizing their high R&D and SG&A expenses. Cost
33
of good sales or cost of revenue includes manufacturing and distribution costs for products sold and programs licensed, operating costs related to product support service centers and product distribution centers, costs incurred to drive traffic to our website and/or acquire online advertising space (“traffic acquisition costs”), costs incurred to support and maintain Internet-based products and services, warranty costs, inventory valuation adjustments, costs associated with the delivery of consulting services, and the amortization of capitalized research and development costs associated with software products that have reached technological
feasibility. This CGS/Sales indicator plus low depreciation to sales ratio indicates an ability to parlay their unique technologies into cost-effective design in operation and relationship management.
AMAZON, one of the most active players in cloud computing business takes the sustainable competitive advantage by their effective fixed asset management and takes the advantage of tax shield (due to their global operation). It can be proofed by their very high fixed asset turnover and low depreciation to sales ratio (Fixed assets include assets such as furniture and fixtures, heavy equipment, technology infrastructure, internal-use software and website development).
The sustainable competitive advantages of these companies, which have quite different configurations, are not based upon a single source but rather an amalgamation of sources.
4.4 Discriminant Function Analysis (DFA)
Discriminant function analysis (DFA) is applied to identify the underlying resource configurations that best distinguish the 30 firms, all of which are classified as having either competitive advantage or competitive disadvantage by the three-year EVA/IC (relative) criterion mentioned above. DFA computes the posterior probability (cross-validated hit ratio)
34
that financial indicators are associated with the competitive advantage and competitive disadvantage groups, given group-specific density estimates (the canonical coefficients in Table 8) and unconditional density estimates (the prior probability is set to 43.3% initially, since 13 of the 30 firms have 3-year EVA/IC above the industry average). Table 8 presents the results of our two-group discriminant analysis. An examination of the group means shows immediately that EVA/IC discriminates the groups more effectively than any other indicator. Eigenvalue 1.544 is big enough (larger than 1), indicates that the high variance in the
dependent variable (group categories) is explained by that function. Percentage of variance is also inferred that 100 percent of variance explained by each function. Canonical correlation (0.779) also indicates the percent of variation in the dependent discriminated by the
independents (indicators) .
In addition, from the Standardized Canonical Discriminant Function Coefficients we can see that SG&A/Sales (-1.533), R&D/Sales (1.154) are two most important indicators to separate the two groups. In other words, we could say that knowledge management is the most important capability to distinguish firms’ competitive advantage.
Table 8 also presents the classification accuracy of the discriminant function. Our results show that 84.6% of competitive-advantage firms and 82.4% of competitive-disadvantage firms are correctly classified, for an overall accuracy of 83.3% (> 75%). Leave-one-out cross-validation correctly classifies 73.3% of firms (> 43.3%). Evidently, financial resource bundles (Penrose, 1959; Rumelt 1984) can be used to distinguish between competitive-advantage and competitive-disadvantage groups, given some knowledge of their configurations.
35
GROUP OF COMPETITIVE ADVANTAGE
GROUP OF COMPETITIVE DISADVANTAGE
ADOBE SYSTEMS INC AKAMAI TECHNOLOGIES INC
AMAZON.COM INC ARIBA INC
CISCO SYSTEMS INC AT&T INC
DELL INC CA INC
GOOGLE INC CITRIX SYSTEMS INC
IBM CORP DESCARTES SYSTEMS GROUP INC
INTEL CORP DESCARTES SYSTEMS GROUP INC
INTUIT INC EMC CORP/MA
MICROSOFT CORP HEWLETT-PACKARD CO
ORACLE CORP KEYNOTE SYSTEMS INC
SAP AG NETSUITE INC
NOVELL INC RED HAT INC
RIGHTNOW TECHNOLOGIES INC SALESFORCE.COM INC
SUN MICROSYSTEMS INC UNISYS CORP
36
Table 8 Discriminant analysis on advantaged and disadvantaged firms
Eigenvalues
Function Eigenvalue % of Variance Cumulative %
Canonical Correlation
1 1.544a 100.0 100.0 .779
a. First 1 canonical discriminant functions were used in the analysis.
Wilks' Lambda
Test of Function(s) Wilks' Lambda Chi-square df Sig.
1 .393 21.478 10 .018
Standardized Canonical Discriminant Function Coefficients Function 1 CGS/Sales -.416 SG&A/Sales -1.533 Dep/Sales .374
Fixed asset Turnover .719
Tax/Sales .430
R&D/Sales 1.154
Receivables Turnover .392
Account payable Turnover -.012
Debt/sales -.091
Equity/sales -.717
Classification Resultsb,c
Group
Predicted Group Membership
Total Competitive
Advantage
Competitive disadvantage
Original Count Competitive Advantage 11 2 13
Competitive disadvantage 3 14 17
% Competitive Advantage 84.6 15.4 100.0
Competitive disadvantage 17.6 82.4 100.0
Cross-validateda
Count Competitive Advantage 10 3 13
Competitive disadvantage 5 12 17
% Competitive Advantage 76.9 23.1 100.0
Competitive disadvantage 29.4 70.6 100.0
a. Cross validation is done only for those cases in the analysis. In cross validation, each case is classified by the functions derived from all cases other than that case.
b. 83.3% of original grouped cases correctly classified. (84.6+82.4)2/ c. 73.3% of cross-validated grouped cases correctly classified. (76.9+70.6)/2
37
V.
Conclusions and recommendations
This study initial explore the competitive advantage of a very new business: cloud computing, through applying the resource configuration model to investigate competitive heterogeneity. The first stage of analysis includes several combinations of financial indicators (factors) that relate to performance. Performance in this study is evaluated by Economic Value Added (over Invested Capital) ratio. By broken down EVA into several financial indicator, we can capture the resource configuration and management capabilities.
The PCA analysis shows that the resource bundles and capabilities most closely relating to superior performance, the principal factors were asset management, knowledge management, relationship management and tax shield.
The PCA analysis reveals causal linkages among resource bundles, efficient
alignments, and dynamic capabilities that indicate that competitive advantage causes superior performance. By combining these calibration tools, we can find out which potential routes to competitive advantage yield long-term payoffs in performance and profitability given a specific context, and which resource bundles really matter.
The DFA analysis (with its underlying Bayesian understanding) provides prima facie evidence that companies with a track record of sustainable profitability (not just a lucky year) are more likely to have a competitive advantage in terms of value. This analysis also proofs that knowledge management is the most important to discriminate competitive advantage or disadvantage.
This study uses EVA as the financial indicator to capture the performance of firms in cloud computing business. Nevertheless, because cloud computing business is a very new business that develops recently, the resource configuration could be changed when the
38
business environment changed, therefore, we also have to change our research framework model to capture better the firm’s performance. In this study, we used only the data from Compustat database to analyze. If we combine it with other empirical researches, we could get more deeply inside the industry’s performance. This will be our research in further study.
39
References
Adner R; Zemsky P. A demand-based perspective on sustainable competitive advantage. Strategic Management Journal, 2006; 27 (3): 215-239.
Ehrbar, A. Using EVA to measure performance and assess strategy. Strategy & Leadership; May/Jun 1999; 27, 3; ABI/INFORM Global, pg. 20
Ansoff, H.I and McDonnell, E. Implanting Strategic Management, 1990, 2th ed, Prentice-Hall (UK).
Mohammed, A.B; Altmann, J; Hwang, J. Cloud Computing Value Chains: Understanding Businesses and Value Creation in the Cloud. 2009
Bakos, Y. and Treacy, M. E. Information technology and corporate strategy: a research perspective, MIS Quarterly, Vol 10, No. 2, June 1986, pp. 107-119
Barney, J.B. Firm resources and sustained competitive advantage. Journal of Management 1991; 17 (1): 99–120.
Barney, J.B; Is the resource-based ‘view’ a useful perspective for strategic management research? Yes; Academy of Management Review; 2001; 26(1): 41–56.
Pring, B; Brown,R.H; Frank,A; Hayward,S; Leong,L; Forecast: Sizing the Cloud; Understanding the Opportunities in Cloud Services , Gartner, Inc., 2009.
Caves, RE and Ghemawat, P. Identifying Mobility Barriers. Strategy Management Journal. 1992.
Collis, D.J and Montgomery, C.A. Competing on resources: strategy in the 1990s. Harvard Business Review 1995; 73 (4): 118-129.
Plummer, D; The Real Truth About Cloud, SaaS and Saving Money Now; Gartner, Inc.; 2009 Aaker, D.A; George S.D. Marketing Research. 1986
Deloitte LLP. Cloud Computing, forecasting change. Market Overview and Perspective Consulting. 2009
40
Eisenhardt, K; Martin, J. Dynamic capabilities. Strategic Management Journal 2000; 21 (10/11): 1105-1121.
Liou, F.M; Tang, E. Y. and Liu, T.H. The effects of asset-light strategy on competitive advantage in the telephone communications industry, 2010
Gillett,F.E. Future View: The New Tech Ecosystems Of Cloud, Cloud Services, And Cloud Computing. Vendor Strategy Professiona, 2008
Fischer,F. and Turner,F. Cloud Computing as a Supply Chain, Walden University, 2009 Grant, R.M. The resource-based theory of competitive advantage: implications for strategy
formulation. California Management Review 1991; 33(3): 119–135.
Grant, R. M., The resource based theory of competitive advantage: implications for strategy formulation, California Management Review, 1991. 33 3 , 114-135.
Helfat, C.E; Peteraf, M.A. The dynamic resource-based view: capability lifecycles. Strategic Management Journal 2003, October Special Issue 24: 997–1010.
Hunt, S; Foundations of Marketing Theory: Toward a General Theory of Marketing; M.E. Sharp: New York; 2002
Irala, L.R. EVA: The right measure of managerial performance. Journal of Accounting and Finance. 2005, 19(2), 77-87.
Maguire, J; Vance,J and Harvey, C. 85 Cloud Computing Vendors Shaping the Emerging Cloud. Internet.com, 2009
Mouritsen, J. Driving growth: Economic Value Added versus Intellectual Capital. Management Accounting Research, 1998, 9, 461-482
KPMG International. Executive Considerations When Building and Managing a Successful Cloud Service, KPMG International, 2009
Vaquero, L.M; Merino, L.R; Caceres, J; Lindner, M.; A Break in the Clouds: Towards a Cloud Definition; ACM SIGCOMM Computer Communication Review; 2009; 39(1)
41
Iansiti, M. Principles that Matter: Sustaining Software Innovation from the Client to the Web, Harvard Business School, 2009
McKinsey&Company. Clearing the air on Cloud Computing. McKinsey&Company, 2009 Michael, A; Fox, A; Griffith, R; Joseph, A.D; Katz, R; Konwinski, A; Lee, G; Patterson,
D.A; Rabkin, A; Stoica, I & Zaharia,M; Above the Clouds: A Berkeley View of Cloud Computing, UC Berkeley, 2009
Miller, D. Configurations of strategy and structure: towards a synthesis. Strategic Management Journal 1986; 7 (3): 233-249.
Morgan, R.M; Hunt,S; Relationship-based competitive advantage: The role of relationship marketing in marketing strategy. Journal of Business Research 1999; 46 (3): 281-290. Bontis, N; Dragonetti, N.C; Jacobsen, K; Roos,G. A Review of the Tools Available to
Measure and Manage Intangible Resources. European Management Journal 1999, Vol. 17, No. 4, pp. 391–402
Brewer,P.C; Chandra,G; Hock,C.A. Economic value added (EVA): Its uses and limitations. Advanced Management Journal; Spring 1999; 64, 2
Porter, M.E. Competitive Advantage: creating and sustaining superior performance. New York, NY: Free Press; 1985.
Porter, M.E. Towards a dynamic theory of strategy. Strategic Management Journal 1991; 12 (8): 95-117.
Powell, T.C. Complete advantage: Logical and philosophical considerations. Strategic Management Journal 2001; 22 (9): 875-888.
Priem, R.L; Butler, J.E. Is the resource-based “view” a useful perspective for strategic management research? Academy of Management Review 2001; 26 (1): 22-40. Rappaport, A. Creating Shareholder Value. The New Standard for Business Performance,
42
Ray, G; Barney, J.B; Muhanna, W.A. Capabilities, business processes, and competitive advantage: choosing the dependent variable in empirical tests of the resource-based view. Strategic Management Journal, 2004; 25(1): 23–37.
SYS-CON. The Top 150 Players in Cloud Computing. Cloud Computing Journal, 2009 Tang, Y. C. & Liou, F. M. Does firm performance reveal its own causes? The role of
Bayesian inference. Strategic Management Journal, 2010: 10.1002/smj.799.
Teece, D.J; Pisano, G; Shuen, A. Dynamic capabilities and strategic management. Strategic Management Journal. 1997; 18(7): 509–533.
Wernerfelt, B. A Resource-based View of the Firms. Strategic Management Journal. 1984. Vol.5, pp. 171-180.