嵌入式Linux 系統開機程序的時間分析
71
0
0
全文
(2) 嵌入式 Linux 系統開機程序的時間分析 A Timing Analysis of Booting Procedures on Embedded Linux Systems. 研 究 生:黃建銘. Student:Chien-Ming Huang. 指導教授:黃育綸 博士. Advisor:Dr. Yu-Lun Huang. 國 立 交 通 大 學. 電機學院 電機與控制學程 碩 士 論 文. A Thesis Submitted to College of Electrical and Computer Engineering National Chiao Tung University in partial Fulfillment of the Requirements for the Degree of Master of Science in Electrical and Control Engineering May 2007. Hsinchu, Taiwan, Republic of China. 中華民國九十六年五月.
(3) 嵌入式 Linux 系統開機程序的時間分析. 學生:黃建銘. 國立交通大學. 指導教授:黃育綸 博士. 電機學院. 摘. 電機與控制學程碩士班. 要. 在蓬勃發展的嵌入式產品中,縮短系統開機時間往往是產業研發人員致 力解決的問題之一。在本篇論文中,我們針對於不同系統架構,雙核心與單 核心等,嵌入式 Linux 作業平台,從硬體跟軟體兩方面去分析系統開機相關 的因素,瞭解這些開機因素對開機時間的影響程度,以及互相之間的關連性。 在本論文中,選擇 TI OMAP5912 作為雙核心實驗平台、Intel PXA270 為單核 心實驗平台,針對平台的差異性,找出各種可能的軟硬體因素,設計一連串 的實驗,得到不同的開機時間,並透過數據分析,歸納出各種因素組合對此 一問題的影響程度。首先,我們先分析嵌入式 Linux 作業系統的開機流程, 將其區分為四大部分、十二階段,包括硬體初始化、開機載入程式、作業系 統核心、使用者應用程式階段等;接下來,利用硬體電路的產生訊號、軟體 核心公用程式產生的時間郵戳,加上示波器與邏輯分析儀等工具的輔助,量 測各階段所耗費的時間。然後,對兩種架構各異的硬體平台架構進行結構分 析,再搭配不同的軟硬體因素與其組合,由一系列的實驗結果、數據整合, 分析並歸納出各因素對開機時間的影響程度。本論文中系列實驗所得之結論 除了有助於開發人員選擇合適的嵌入式平台,並能提供從硬體與軟體等方面 改善開機時間的參考依據。. i.
(4) A Timing Analysis of Booting Procedures on Embedded Linux Systems. Student:Chien-Ming Huang. Advisors:Dr. Yu-Lun Huang. Degree Program of Electrical and Computer Engineering National Chiao Tung University. ABSTRACT Shortening boot time is one of the major challenges in developing embedded products. In this thesis, the boot times of various system architectures, including single-core and dual-core architectures, running Embedded Linux are analyzed. To figure out the varieties of various architectures, TI OMAP5912 and Intel PXA270 are chose for the experimental platforms with dual-core and single-core processor, respectively. First, the boot-up procedure is analyzed and divided into 4 stages (hardware initialization, boot-loader, kernel and user space) and 12 phases. Secondly, the oscilloscope, logic analyzer and kernel functions are used to capture the chipset pins and log timestamps to measure the boot time of each phase. According to the difference concluded from the comparison of the two experimental platforms, a series of experiments are designed based on various combinations of the hardware and software factors. Theoretically, the experimental results are compared, analyzed and concluded. The conclusion helps developers in selecting the embedded platforms and improving the boot time by hardware and software factors.. ii.
(5) 致. 謝. 首先由衷感激我的指導教授 黃育綸老師,在研究生生涯裡,總是熱心而 不厭倦的指導我如何做研究;經由不斷的討論使我從千頭萬緒之中找出方 向;建議我如何將大筆雜亂無章的資料整理歸納、收為己用;其次我也非常 感謝即時嵌入式系統實驗室的同學、學弟妹們:志堅對於我的研究提供了很 多幫助;嘉良、精佑、瀞瑩、欣宜、依文、勁源、恩捷、詠文、Newlin、興 龍、立穎以及培華讓研究生生活不再枯燥乏味;也感謝我的同事蘇國榮,願 意在繁忙的工作壓力下抽空給我許多寶貴的建議與幫助。最後要感謝我親愛 的父母 黃賢忠和 黃李富美以及最親愛的老婆 林怡,感謝他們在背後不斷的 支持鼓勵我,讓我無後顧之憂的專心於研究上,僅以此論文獻給我最愛的家 人。. iii.
(6) CONTENTS. 摘. 要........................................................................................................................... i. ABSTRACT .................................................................................................................... ii 致. 謝......................................................................................................................... iii. CONTENTS.................................................................................................................... iv List of Figures ................................................................................................................. vi List of Tables................................................................................................................. viii. Chapter 1 INTRODUCTION ............................................................... - 1 Chapter 2 RELATED WORK .............................................................. - 3 2.1 Snapshot Technique for NOR Flash ..........................................................- 3 2.2 Kernel Execute-In-Place.............................................................................- 5 2.3 Linux Kernel Initialization.........................................................................- 5 -. Chapter 3 MULTIMEDIA DEVICE ................................................... - 7 3.1 Product Specification ..................................................................................- 7 3.2 Platforms......................................................................................................- 8 3.2.1 OMAP5912 .........................................................................................- 8 3.2.2 PXA270 ...............................................................................................- 9 3.3 Comparison................................................................................................- 10 3.4 Analysis ......................................................................................................- 11 3.4.1 Processor Architecture.....................................................................- 11 3.4.2 Platform Architecture ......................................................................- 13 3.4.3 Bottlenecks ........................................................................................- 14 -. Chapter 4 LINUX BOOT-UP ............................................................. - 16 4.1 Overview ....................................................................................................- 16 4.2 Boot Sequences ..........................................................................................- 17 4.2.1 Hardware Initialization ...................................................................- 17 4.2.2 Boot-loader Stage .............................................................................- 18 4.2.2.1 Case 1-Kernel Uncompress Image......................................- 19 4.2.2.2 Case 2-Boot-loader Uncompress Image .............................- 19 4.2.3 Kernel Stage......................................................................................- 21 iv.
(7) 4.2.3.1 Case 1-Kernel Uncompress Image......................................- 21 4.2.3.2 Case 2-Boot-loader Uncompress Image .............................- 22 4.2.4 User Space Stage...............................................................................- 23 4.3 Impact Factors...........................................................................................- 24 4.3.1 Hardware Factors ............................................................................- 24 4.3.2 Software Factors...............................................................................- 25 -. Chapter 5 EXPERIENMENTS........................................................... - 27 5.1 Environments.............................................................................................- 27 5.1.1 Factors of OMAP5912osk................................................................- 27 5.1.2 Factors of PXA270 ...........................................................................- 28 5.2 Factors for Boot Phase..............................................................................- 29 5.3 Experiments Results .................................................................................- 30 5.3.1 OMAP5912osk..................................................................................- 30 5.3.2 PXA270 .............................................................................................- 40 5.3.3 Others ................................................................................................- 45 5.4 Analysis Results .........................................................................................- 48 -. Chapter 6 CONCLUSION .................................................................. - 51 Chapter 7 FUTURE WORK............................................................... - 53 REFERENCES..................................................................................... - 54 APPENDIX ........................................................................................... - 56 A.1 Instruments...............................................................................................- 56 A.1.1 Oscilloscope......................................................................................- 56 A.1.2 Logic Analyzer .................................................................................- 57 A.2 System Functions......................................................................................- 58 A.2.1 Printk Times ....................................................................................- 59 A.2.2 initcall-times patch ..........................................................................- 59 A.2.3 Time Stamp ......................................................................................- 60 A.3 Inaccuracies ..............................................................................................- 60 -. v.
(8) List of Figures Figure 1: Snapshot Management of Snapshot Technique......................................- 4 Figure 2: System Boot-up Memory Map .................................................................- 6 Figure 3: ARM926EJ-S block diagram..................................................................- 12 Figure 4: XScale block diagram..............................................................................- 12 Figure 5: OMAP5912 block diagram .....................................................................- 13 Figure 6: PXA270 block diagram ...........................................................................- 14 Figure 7: Boot Sequence main stages .....................................................................- 17 Figure 8: Hardware Initialization...........................................................................- 18 Figure 9: Boot-loader stage .....................................................................................- 21 Figure 10: Kernel stage............................................................................................- 23 Figure 11: User Space stage.....................................................................................- 24 Figure 12: CPU Frequency modified on OMAP5912 ...........................................- 31 Figure 13: Memory speed modified on OMAP5912 .............................................- 32 Figure 14: File-systems changed on OMAP5912...................................................- 33 Figure 15: File-systems changed on OMAP5912...................................................- 33 Figure 16: CPU Frequency modified on OMAP5912 ...........................................- 34 Figure 17: Memory speed modified on OMAP5912 .............................................- 35 Figure 18: File-systems changed on OMAP5912...................................................- 36 Figure 19: File-systems changed on OMAP5912...................................................- 36 Figure 20: Compression algorithm of Squashfs changed on OMAP5912...........- 37 Figure 21: Compression algorithm of Squashfs changed on OMAP5912...........- 38 Figure 22: Compression algorithm of Squashfs changed on OMAP5912...........- 38 Figure 23: Kernel version changed on OMAP5912 ..............................................- 39 Figure 24: U-boot version changed on OMAP5912 ..............................................- 40 Figure 25: CPU frequency modified on PXA270 ..................................................- 41 Figure 26: CPU frequency modified on PXA270 ..................................................- 41 Figure 27: System bus speed modified on PXA270...............................................- 42 Figure 28: File-systems changed on PXA270.........................................................- 43 Figure 29: File-systems changed on PXA270.........................................................- 43 Figure 30: Compression algorithm of Squashfs changed on PXA270.................- 44 Figure 31: Compression algorithm of Squashfs changed on PXA270.................- 45 vi.
(9) Figure 32: Caches enable/disable in the boot-loader stage...................................- 45 Figure 33: Caches enable/disable in the kernel and user space stage .................- 46 Figure 34: CPU/Memory speed ratio on OMAP5912 ...........................................- 47 Figure 35: CPU/Memory speed ratio on OMAP5912 ...........................................- 47 Figure 36: Kernel image uncompressed time of different algorithms.................- 48 Figure 37: Compression ratio of different compression algorithms....................- 48 Figure 38: Power-on Sequence captured by Oscilloscope ....................................- 57 Figure 39: Boot Sequence captured by Logic Analyzer........................................- 58 -. vii.
(10) List of Tables Table.1 Comparison of ARM926EJ-S and XScale ................................................- 10 Table.2 Comparison of OMAP5912 and PXA270 .................................................- 11 Table.3 Compression Algorithm Test .....................................................................- 26 Table.4 Total boot Time Reduction with different factors modification .............- 29 Table.5 MEM: 24 / FS: JFFS2.................................................................................- 31 Table.6 CPU: 96 / FS: JFFS2...................................................................................- 31 Table.7 Different File-systems.................................................................................- 32 Table.8 MEM: 24 / FS: JFFS2.................................................................................- 34 Table.9 CPU: 96 / FS: JFFS2...................................................................................- 35 Table.10 Different File-systems ...............................................................................- 35 Table.11 Compression Algorithm of File-system and CPU clock ........................- 37 Table.12 U-boot: 1.1.3 / FS: JFFS2 .........................................................................- 39 Table.13 Kernel: 2.4.20 / FS: JFFS2 .......................................................................- 39 Table.14 FS: JFFS2 ..................................................................................................- 40 Table.15 CPU: 208/ FS: JFFS2................................................................................- 42 Table.16 File-system and CPU clock ......................................................................- 42 Table.17 Compression Algorithm of File-system and CPU clock ........................- 44 Table.18 CPU/Memory speed ratio on OMAP5912 ..............................................- 46 Table.19 CPU/Memory speed ratio on OMAP5912 ..............................................- 46 -. viii.
(11) Chapter 1 INTRODUCTION. With the rapid growth of the embedded computing technologies, boot time becomes a major challenge in designing embedded systems, especially the consumer electronics. Currently the most popular consumer electronics is the multimedia device. There are many fancy features supported inside the multimedia device while the boot time of the device is taken longer. For better impression of product, the devices should be available after users turn on the device. For example, Sony DSC-T50 [25] is a popular digital camera with 7 million pixels CCD. Its boot-up times is about 1.3sec. The newer DSC-T100 is a digital camera with 8 million pixels CCD. Its boot-up time is about 1.5sec. But the latest DSC-G1 with 6 million pixels CCD and extra wireless LAN module inside take about 4.2 sec when it boots up. More features with more boot times are not acceptable by end customer. The findings of the methods are used for reducing the boot time but those methods mostly focused on software side [1] [2] [3]. The relationship between boot time, platform architecture and software will be the good reference for future SoC design, software and product development. To find the relationship, we divide the boot sequence of embedded system into 12 phases [5] [6] [7] and modify some hardware and software factors [4] [8] related to the boot times. For application specific, we choose two platforms: OMAP5912 [9] [10] [11] and PXA270 [12] [13] [15]. To find out what kind of processor architecture will benefit the system boot time and what factors inside the processor will affect the boot time. The system bus architectures will also the factors related to system boot time. The bottlenecks of different platform will be proposed. After the architecture analysis, we proposed the experiments with different factors modified. According to those experiments, the relationship between the boot time and different kind of hardware and software factors will be proposed. The experiments will be done at each phase of the boot sequence. In the reset of this thesis, we will introduce the methods of timing -1-.
(12) measurement first. Then overview of Linux boot, factors related to the boot time and the boot sequence of embedded Linux are presented in Chapter 4. For application specific, the analysis of different platforms and bottleneck of architectures related to boot time are discussed in Chapter 5. After platforms and architectures analysis, we’ll introduce the experiments designed to find the relationship between the boot time and hardware and software factors. The experiments are done on two platforms in Chapter 6. In Chapter 7, the conclusion, according to the experimental results, will be proposed for platform selection and methods for boot time reduction by hardware and software side.. -2-.
(13) Chapter 2 RELATED WORK There are many exist techniques to improve and analyze the boot procedure of Linux. They include the technique of quick mounting the file system for flash storage device [3], the special method to execute kernel [1] and the study of Linux kernel initialization [16].. 2.1 Snapshot Technique for NOR Flash. In embedded computing devices, flash memory has many advantages such as light-weight, shock-resistance, and low-power consumption. There are two types of flash memories: NOR and NAND. NOR flash is usually used for codes stored because it supports word-unit I/O and provides faster read speed than NAND flash. NAND flash supports only page-based I/O (e.g., 512B or 2KB) and provides faster write speed. It is mostly used for large-scale data storage requirements. In flash memory, write operations must be preceded by an erase operation, and the number of erase in a block is limited. In order to hide the erase while ensuring the wear-leveling property, the flash translation layer (FTL) [26] [27] [28] has been developed to be able to translate the logical addresses generated by a host system to physical addresses of flash memory. But the use of FTL is restricted by international patents. It is known that the performance of FTL can be seriously reduced if the host file system generates write operations frequently. Therefore, embedded computing devices directly use flash file systems (e.g., JFFS2 [29] and YAFFS2 [30]) which are based on a data journaling technique. Unfortunately, the journaling technique incurs long mounting time for the flash file systems. The technique providing an instant lookup method for the lastly stored in-memory file system metadata is the snapshot technique. It stores snapshots to variable-size areas managed by linked lists and sequentially record the location of the stored snapshots to prearranged areas by using an ordered tree data structure. In Figure 1, the first block of flash memory is reserved as a root block which -3-.
(14) stores pointers to snapshot header blocks sequentially. When running the mount_root operation, the last stored pointer can be found quickly using sequential or binary search algorithms. The binary searching divides the root block into two sub-blocks and reads the boundary pointer of these sub-blocks. If the pointer is null, the searching selects the left sub-block. Otherwise, the other one is selected. The above procedure is repeated with the selected sub-block, until the last stored pointer is found. Since the block size (Bsize) is typically 128KB in NOR flash and the size of a pointer to block is 2B (Psize), this search algorithm has a better time complexity of O(lg(Bsize / Psize)) = O(16). Each pointer in the root block directs the corresponding header block as shown in Figure 1. A header block contains several snapshot headers, and a snapshot header consists of a mounting flag (M), an unmounting flag (U), and a pointer to the snapshot data block (Pt). Since the snapshot header size (Hsize) is typically 4B, the maximum number of snapshot headers that can be stored in a header block is Bsize / Hsize (=215). The searching algorithms used to find the last stored snapshot header is the same way as done by the root block. The pointer stored in the latest snapshot header is used to access the snapshot data that were last stored. In summary, this technique only reads lg(Bsize / Psize) x Psize + lg(Bsize / Hsize) x Hsize (=92) bytes in an average case to fine the location of the last stored snapshot, providing an instant lookup time. The source code of the technique is not released, so it is difficult to verify the performance at our experimental platforms.. Figure 1: Snapshot Management of Snapshot Technique -4-.
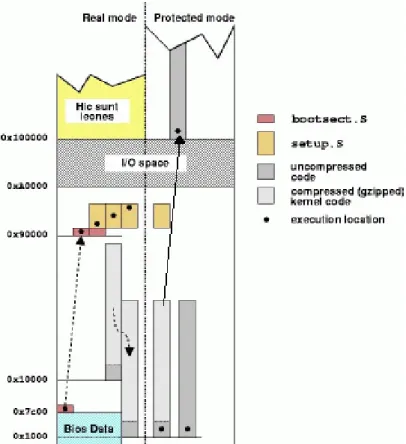
(15) 2.2 Kernel Execute-In-Place. Execute-In-Place (XIP) allows the kernel run from flash memory directly. Without the copy procedure, it is faster invoked, and it consumes less RAM at run time. This saves RAM space since the text section of the kernel is not loaded from flash to RAM. Read-write sections, such as the data section and stack, are still copied to RAM. The flash address used to link the kernel object files, and for storing it, is configuration dependent. Therefore, the proper physical address where to store the kernel image depending on specific flash memory usage must be known. XIP is consuming more flash memory storage, because XIP kernel must be flat without any compression.. 2.3 Linux Kernel Initialization. The overview of the boot process of an Intel x86-based personal computer is how the initialization routine provided by the operating system running. Generally, there are three stages to the booting process. When a PC is powered on, the BIOS (Basic Input-Output System) run first followed by a boot loader and finally the operating system initialization routine. The BIOS is the first code executed by the processor when boot-up. When power is initially applied to the computer this triggers the RESET pin on the processor. This causes the processor to read from memory location 0xFFFFFFF0 and begin executing the code located there. This address is mapped to the Read-Only Memory (ROM) containing the BIOS. The BIOS must poll the hardware and set up an environment capable of booting the operating system. Once the BIOS load the first sector of the boot device into RAM, the boot loader begins execution. After the chosen boot loaders [31] [32] has run, it loads the Linux kernel image as shown as Figure 2, typically named vmlinuz-[version number] for a compressed kernel image and vmlinux-[version number] for an uncompressed image. A compressed kernel image will have the Linux boot loader, found in -5-.
(16) /arch/i386/boot/bootsect.S, located at the very beginning of the image. After the boot loader execute the assembly code, the code runs assembly level initialization, like reinitialize all hardware, switches CPU from real mode to protected mode, fills the bss segment of the kernel with zeros and final jump to assembly function startup_32(). The code runs high-level initialization till process 1 executing, and then the Linux kernel initialization is complete.. Figure 2: System Boot-up Memory Map. -6-.
(17) Chapter 3 MULTIMEDIA DEVICE. In designing embedded systems, especially the consumer electronics, the boot time becomes a major challenge. As streaming multimedia applications become popular in consumer devices, the multimedia device is the application for boot time analysis.. 3.1 Product Specification There are many multimedia devices on the marked. Before making the decision of using which platform on the product, the PRD (Product Requirement Document) from the customer is the major reference. For the multimedia application, there are some minimum hardware and software requirements [23]: 1. Processor Requirement: Processors are the main brain of the product. For more and more fancy features, powerful processor is necessary. From software point of view, ARM based processors are more popular and has more resources. So ARM version 5TE (v5TE) architecture, which support DSP-Enhanced instruction set, is what product needed. 2. Display Requirement: LCD supported is important for multimedia requirement. For most popular multimedia format, we at least require 262144 colors (18-bits), 640x480 resolution of LCD module. 3. Memory Requirement: According to the LCD requirement and related software features for multimedia device, the product’s minimum system memory requirement is 64MB and minimum flash memory requirement is 32MB. 4. Storage Requirement: The most cost effective storage memory card, which also have small form factor, is MMC/SDIO memory card. So MMC/SDIO card supported is also required. 5. Networked Interfaces Requirement: For internet access or remote multimedia display, the product needs 10 or 10/100 Ethernet port supported or 802.11b/g WLAN supported. -7-.
(18) 6. Peripheral Requirement: IrDA and USB are minimum requirements of peripheral interfaces. 7. Operating System and Other Software Feature Requirements: OS could be Linux. Other software features are not mainly related to the boot time analysis, so the features are not listed here.. 3.2 Platforms According to the product specification of multimedia device, there are two kinds of platform for our selection. One platform is the dual-core architecture. One main processor is used for normal computing and another DSP core is specially handle the multimedia data computing. The other platform is the single-core architecture. It has one powerful processor to handle all data computing and by software codec with strong computing power to handle the multimedia data. According to the two kinds of the platforms, we select two platforms, which meet the minimum requirement of multimedia device, for boot time analysis. One is TI OMAP5912, and the other one is Intel PXA270. The platform specifications of the related evaluation boards are described below: 3.2.1 OMAP5912 zBoard –. TI OMAP5912osk (OMAP Starter Kit) is a highly integrated evaluation board, designed to meet the application processing needs of next-generation embedded devices. The dual-core architecture of the OMAP5912 provides benefits of both DSP and reduced instruction set computer (RISC) technologies. It is incorporating a TMS320C55x DSP core and a high-performance ARM926EJ-S ARM core. There are rich peripherals reserved on the boards which could meet the requirements of different products.. zProcessor – The DSP core of the OMAP5912 device is based on the TMS320C55x DSP generation CPU processor core. The C55x DSP architecture achieves -8-.
(19) high performance and low power through increased parallelism and total focus on reduction in power dissipation. The CPU supports an internal bus structure composed of one program bus, three data read buses, two data write buses, and additional buses dedicated to peripheral and DMA activity. These buses provide the ability to perform up to three data reads and two data writes in a single cycle. In parallel, the DMA controller can perform up to two data transfers per cycle independent of the CPU activity. – The ARM926EJ-S processor is a member of the ARM9 family of general-purpose microprocessors. The ARM926EJ-S processor is targeted at multi-tasking applications where full memory management, high performance, low die size, and low power are all important. The ARM926EJ-S processor supports the 32-bit ARM and 16-bit Thumb instruction sets, so it provides the user to trade off between high performance and high code density. ARM926EJ-S processor implements ARM architecture version 5TEJ. 3.2.2 PXA270 zBoard –. The MT Creator PXA270 is a highly integrated evaluation board. It includes the integrated system-on-a-chip microprocessor for high performance, dynamic, low-power portable handheld and hand-set devices as well as embedded platforms. The processor incorporates the Intel XScale technology. The processor also provides Intel Wireless MMX media enhancement technology, which supports integer instructions to accelerate audio and video processing. In addition, it incorporates Wireless Intel Speedstep Technology, which provides sophisticated power management capabilities enabling excellent MIPs/mW performance. There are also rich peripherals reserved on the boards which could meet the requirements of different products.. zProcessor –. The Intel XScale core is an ARM V5TE compliant microprocessor. It has been designed for high performance and low-power; leading the -9-.
(20) industry in mW/MIPs. The core is not intended to be delivered as a stand alone product but as a building block for an ASSP (Application Specific Standard Product) with embedded markets such as handheld devices, networking, storage, remote access servers, etc.. 3.3 Comparison According to the device specifications of OMAP5912 and PXA270, there are some comparisons of device specification in Table 2 and Table 3. In Table 1, both processors are all ARM version 5TE (v5TE) architecture compliant. XScale has large size cache, 7 stage pipeline and higher processor frequency. In Table 2, OMAP5912 has additional DSP core for multimedia data, but PXA270 supports Intel Wireless MMX for additional media instructions. OMAP5912 support hardware accelerators for cryptographic and PXA270 use software features to handle. Both platforms support minimum memory requirements (32MB flash and 64MB SDRAM). Although OMAP5912 use 16-bit memory bus, but it supports Mobile DDR RAM, which sampling the data at rising and falling edge of memory clock then it gets the 16-bit data twice per clock cycle. Other peripherals of both are all meet the requirements of product specification of multimedia device. The difference on network interface is OMAP5912 supported 10Mbps and PXA270 supported 10/100Mbps. Table.1 Comparison of ARM926EJ-S and XScale ARM926EJ-S Core. XScale Core. ISA. ARM V5TEJ. ARM V5TE. Pipeline. 5 stage pipeline. 7 stage pipeline. 16 KB i-cache. 32 KB i-cache. 8 KB d-cache. 32 KB d-cache. Max. 192 MHz. Max. 520 MHz. Cache Clock/Freq.. - 10 -.
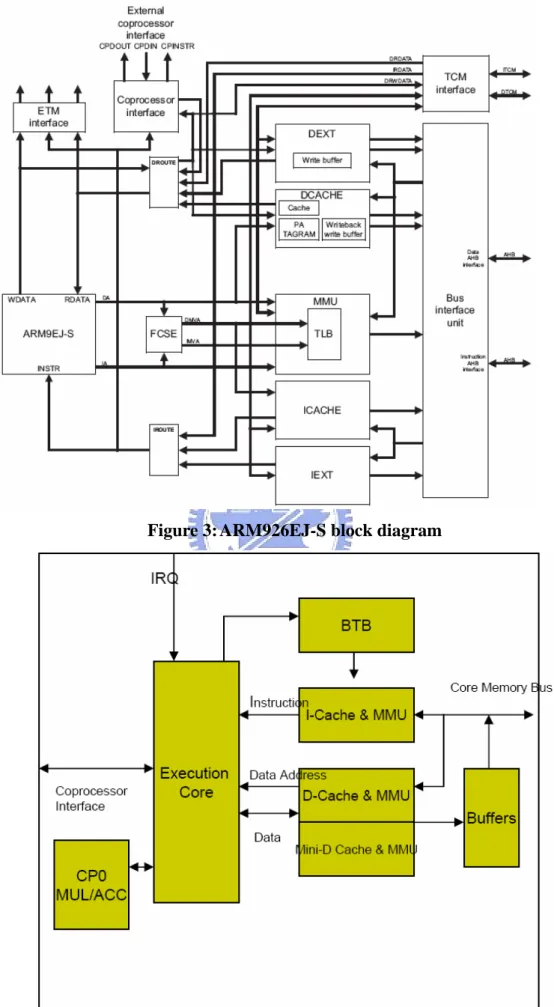
(21) Table.2 Comparison of OMAP5912 and PXA270. Multimedia. Memory. TI OMAP5912. Intel PXA270. TMS320C55x DSP Core. Intel Wireless MMX. 16-bit Mobile DDR SDRAM. 32-bit SDRAM. (max. 64MB). (max. 1GB). 16-bit Flash (max. 256MB) 16-bit Flash (max. 384MB) USB 1.1 Client. USB 1.1 Client. USB 1.1 Host. USB 1.1 Host. 3 UART. 3 UART. (2 SIR IrDA). (FIR and SIR IrDA). LCD. 16-/18bit LCD Controller. 18-bit LCD Controller. Card Slot. SD/MMC. SD/MMC/MS. Keypad. Keypad I/F. Keypad I/F. LAN. 10 Mbps. 10/100 Mbps. USB. UART. 3.4 Analysis 3.4.1 Processor Architecture Refer to Figure 3 [22] and Figure 4 [15], ARM926EJ-S Core is the 5-stage pipeline architecture, and XScale Core is the 7-stage super-pipeline architecture. So XScale Core has the better performance. XScale Core also has larger cache size and higher clock frequency. So doing the comparison from the processor architecture, XScale Core has the better performance than ARM926EJ-S.. - 11 -.
(22) Figure 3: ARM926EJ-S block diagram. Figure 4: XScale block diagram - 12 -.
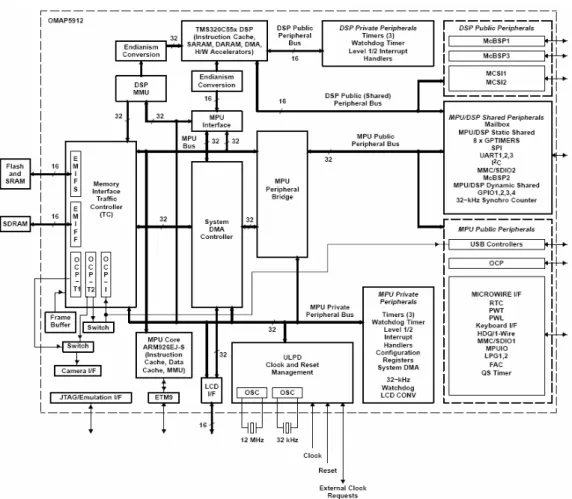
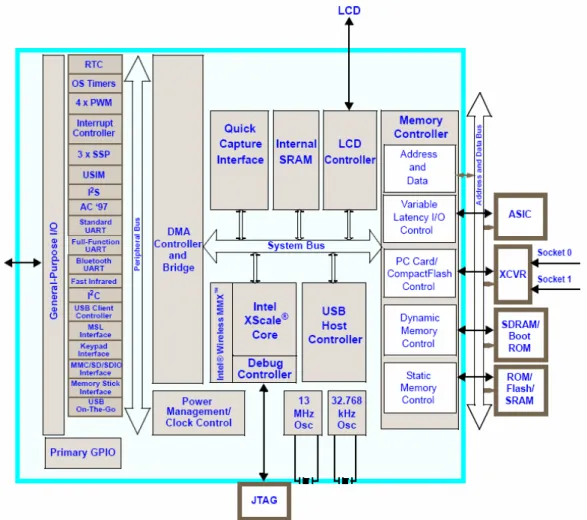
(23) 3.4.2 Platform Architecture OMAP5912 is the dual-core architecture, so there is the multi-level bus architecture. According to the block diagram of OMAP5912 on Figure 5, there are many different buses: MPU bus, DSP bus, DMA bus, MPU public/private peripheral bus and DSP public/private peripheral bus. This architecture could get the better performance when each subsystem access different components. A multi-level bus architecture could reduce the resource conflict and interference when access the same bus.. Figure 5:OMAP5912 block diagram PXA270 is the single-core architecture, so its bus architecture is simpler than OMAP5912. From Figure 6, it has system bus and peripheral bus. There are six clients on system bus: the core, the DMA controller, the LCD controller, the USB host controller, and the two memory controllers (internal and external). Most of all peripherals are on peripheral bus connected to the DMA controller. Even it - 13 -.
(24) support programmable weight on system bus arbitration, the single bus is still the bottleneck of the architecture. PXA270’s memory controller could be use to connect external ASIC. When ASIC and PXA270 have busy communication, it will affect the performance of memory controller portion.. Figure 6: PXA270 block diagram 3.4.3 Bottlenecks From boot time point of view, we would like to analysis which portion will be the bottleneck of each platform. OMAP5912 has more flexible bus architecture, but the relationship between TC (Traffic Controller) clock and MPU clock, and Flash clock and TC clock will be the bottleneck of boot time. Max. TC clock is half of max. MPU clock so max. TC clock is 96 MHz. But max. MPU clock is 192MHz. Max. flash clock is 48MHz and it is always 1/6 of TC clock. MPU TIPB (TI peripheral bus) (public and - 14 -.
(25) private) also has max strobe freq., 48MHz. PXA270 use one system bus for many subsystems. So the system bus will be bottleneck. It also will be the bottleneck on peripheral bus. There are too many peripherals connected to peripheral bus, and these peripherals take more time when doing hardware initialization. Its memory controller also uses to connect to external ASIC. This will be the bottleneck of memory access when the external ASIC and PXA270 have busy communication.. - 15 -.
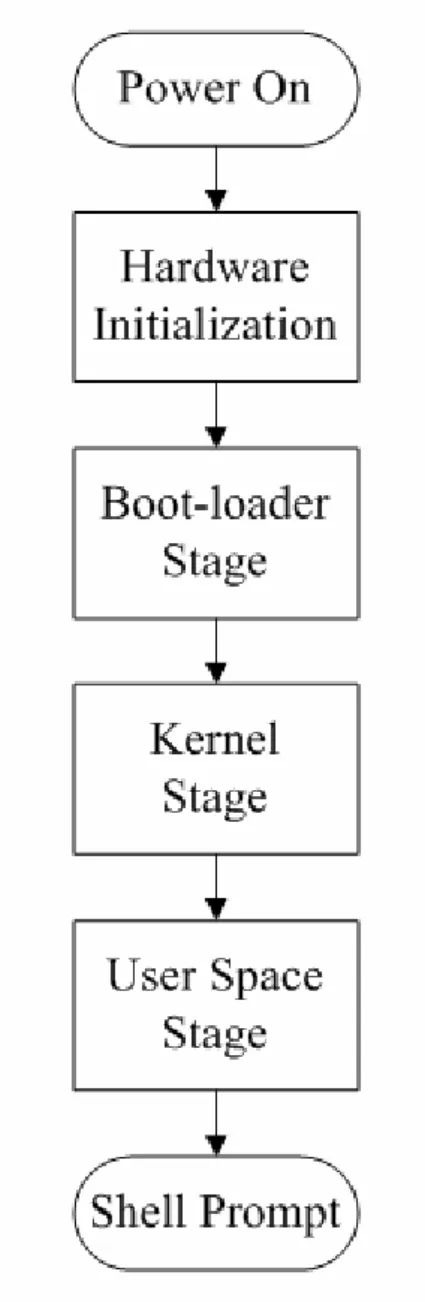
(26) Chapter 4 LINUX BOOT-UP. A computer system is a complex machine [16], and the operating system is an elaborate tool that orchestrates hardware complexities to show a simple and standardized environment to the end user. Currently Linux is the most popular operating system because of its open source policy. For embedded systems, Embedded Linux is the cost effective operating system which refers to the open source Linux. We’ll introduce the normal Linux boot-up steps on PC and embedded systems, then boot factors and boot sequence of Embedded Linux will be discussed.. 4.1 Overview The PC is more widespread use than other platforms so Linux boot-up steps on the x86 PC will be introduced first. In order to be able to use the computer when the power is turned on, the processor begins execution from the system's firmware. It is called the Basic Input-Output System (BIOS). BIOS functionalities are Power-on Self Test (POST), system configuration set-up and execution code from boot device. Then boot-loader located at boot device is loaded by BIOS services. The. boot-loader’s. major. features. are. basic. hardware. initializations,. uncompression/execution of the kernel image. After boot-loader transfer control to kernel [17], kernel will do the whole system initializations and then execute the user space program from the file-systems. Then system is ready for user. The embedded system is always resource constrained. There is no any BIOS on the embedded system. The BIOS is substituted by power-on strapped pins or internal boot ROM of the processor. Because the storage and memory are also limited, the boot-loader, kernel subsystems, file-system are modified to suit for embedded systems. The Linux boot-up steps on the embedded systems are from boot-loader execution, to kernel image copied to ram, uncompressed then execution and finally load program from root file-systems at user space. - 16 -.
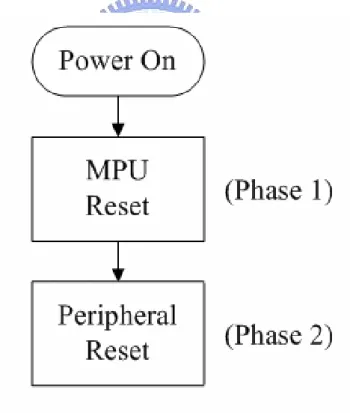
(27) 4.2 Boot Sequences The boot sequence could be divided into four stages: Hardware Initialization, Boot-loader, Kernel and User Space (Figure 7). For more detail analysis, each stage could be subdivided into more phases:. Figure 7: Boot Sequence main stages. 4.2.1 Hardware Initialization. There are two phases in the hardware initialization stages (Figure 8): zPhase 1: The time for the MPU reset - 17 -.
(28) It is measured from Power-On (Vin stable) to signal MPU_Reset de-asserted. From the Vin becoming stable (MPU_nReset low) to the signal MPU_nReset becoming high. When the power input of the MPU is stable, oscillator input of MPU is also stable then MPU exit reset mode. zPhase 2: The time for the MPU initialization and the Peripheral reset It. is. measured. from. signal. MPU_Reset. de-asserted. to. signal. MPU_RST_OUT de-asserted. From the signal MPU_nReset becoming high to the signal MPU_nRST_OUT becoming high. MPU exit reset mode then doing simple hardware configuration by reading power-on strap-pins or reading internal boot ROM. After finishing the configuration, then the nRST_OUT signal to other peripherals is de-asserted. MPU read the 1st instruction.. Figure 8: Hardware Initialization 4.2.2 Boot-loader Stage There are four or five phases in the boot-loader stages (Figure 9). When the kernel image is uncompressed at kernel stage, there are only four phases. When - 18 -.
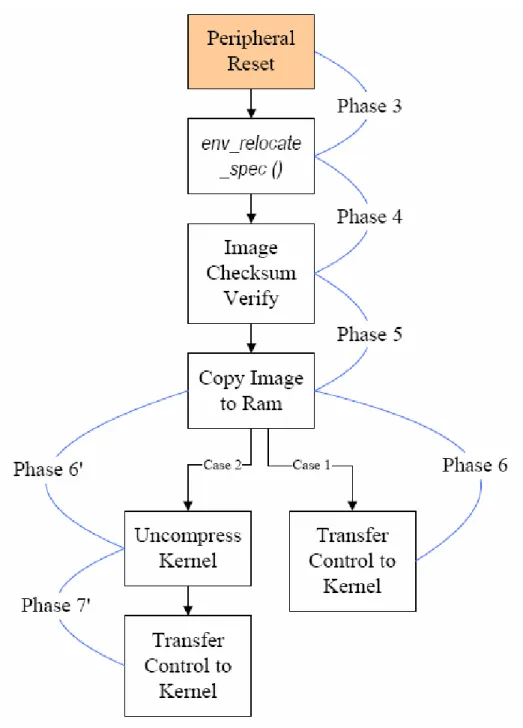
(29) the kernel image is uncompressed by the boot-loader, there are five phases in the boot-loader stage: zPhase 3: It is measured from the signal MPU_RST_OUT de-asserted to function env_relocate_spec() finished. From the signal MPU_RST_OUT becoming high and to the last signal of Flash_CS for function env_relocate_spec() finished (the last signal Flash_CS rising edge before env_relocate_spec() finished). MPU read the 1st instruction to do simple hardware initialization then U-boot starts and prepares to execute the first function which access flash. Then the environment parameters of U-boot are relocated. zPhase 4: It is measured after the function env_relocate_spec() finished and before the kernel image checksum verify starting. zPhase 5: It is measured from the kernel image checksum verify starting to copy image to ram finished. From the signal RS232_TX of function image checksum verify start to the signal RS232_TX of function copy image to ram over. U-boot verifies the checksum of kernel image. If the checksum is correct, then U-boot copies the kernel image from the flash to system memory. 4.2.2.1 Case 1-Kernel Uncompress Image zPhase 6: It is measured from copy image to ram finished to the function cleanup_before_linux() finished. From the signal RS232_TX of function copy image to ram over to the signal RS232_TX of function cleanup_before_linux() finished. Boot-loader transfers the control of system to Linux kernel. 4.2.2.2 Case 2-Boot-loader Uncompress Image - 19 -.
(30) zPhase 6’: It is measured from copy image to ram finished to uncompress kernel image finished. From the signal RS232_TX of function copy image to ram over to the signal RS232_TX of uncompress kernel image finished. Boot-loader uncompress the kernel image. zPhase 7’: It is measured from uncompress kernel image finished to the function cleanup_before_linux() finished. From the signal RS232_TX of uncompress kernel image finished to the signal RS232_TX of function cleanup_before_linux() finished. Boot-loader transfers the control of system to uncompressed Linux kernel.. - 20 -.
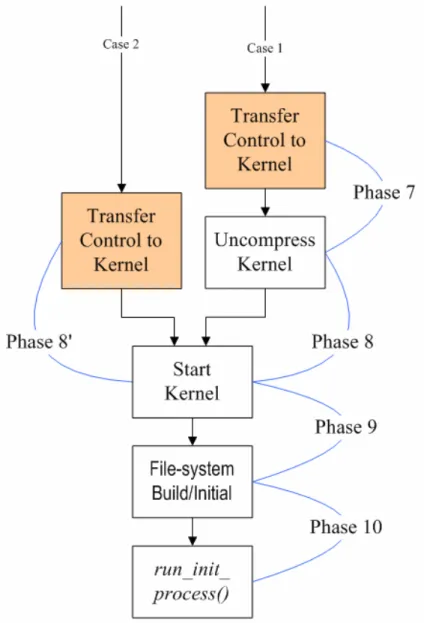
(31) Figure 9: Boot-loader stage. 4.2.3 Kernel Stage There are three or four phases in the kernel stages (Figure 10). When the kernel image is uncompressed at boot-loader stage, there are only three phases. When the kernel image is uncompressed at the kernel stage, there are four phases in the kernel stage: 4.2.3.1 Case 1-Kernel Uncompress Image. - 21 -.
(32) zPhase 7: It is measured from the function cleanup_before _linux() finished to before the uncompress kernel starting. From the signal RS232_TX of function cleanup_ before_linux() finished to the signal RS232_TX of function Uncompress kernel start. Linux kernel gets the controls and prepares to uncompress kernel. zPhase 8: It is measured from the uncompress kernel starting to the uncompress kernel finished. From the signal RS232_TX of function Uncompress kernel start to the signal RS232_TX of function Uncompress kernel over. Linux kernel image is uncompressed and prepare to start the kernel. 4.2.3.2 Case 2-Boot-loader Uncompress Image. zPhase 8’: It is measured from the function cleanup_before _linux() finished to before start_kernel. From the signal RS232_TX of function cleanup_ before_linux() finished to before start_kernel. Linux kernel gets the controls and prepares to start the kernel. zPhase 9: It is measured from the uncompress kernel finished to before file-system initialization/built. From the signal RS232_TX of function Uncompress kernel over to the signal RS232_TX of function File-system built/fill super start. Linux kernel uncompress and execute routine start_kernel, Linux kernel doesn’t access the flash until the routine mount_root. zPhase 10: It is measured from before file-system initialization/built to before Invoke /sbin/init. From the signal RS232_TX of function File-system built/fill super start to the - 22 -.
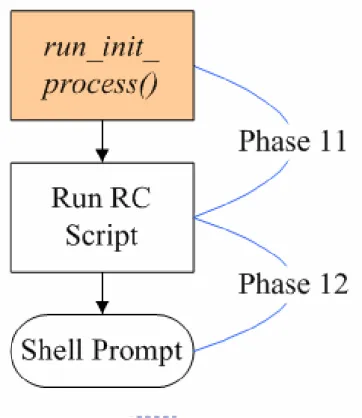
(33) signal RS232_TX of function File-system built/fill super over. Root File-system is built by kernel.. Figure 10: Kernel stage 4.2.4 User Space Stage There are two phases in the user space stages (Figure 11): zPhase 11: It is measured from Invoke /sbin/init to before RC script start. From the signal RS232_TX of function Invoke init to the signal RS232_TX of function RC Script start. Linux kernel invokes the sysvinit tool: /sbin/init then init_main started for user space and prepares to run RC Script. - 23 -.
(34) zPhase 12: It is measured from RC script start to shell prompt output finished. From the signal RS232_TX of function RC Script start to RC Script starts several daemons. Then RC Script is finished and shell prompt is enabled.. Figure 11: User Space stage. 4.3 Impact Factors In this thesis we would like to investigate the Embedded Linux boot process and find the related factors of reducing boot time. According to the platforms comparison and Linux boot procedure analysis , we induce that both hardware factors, including processor frequency, memory and I/O access speed, and software factors, including OS kernel, drivers, subsystems selection and compression algorithms, would affect the boot time. The major factors are as following: 4.3.1 Hardware Factors. - 24 -.
(35) 1. Processor frequency: During boot process, there are greatly computing power requirements and complexity instruction operations. So faster processor frequency will help on the reduction of the boot time. 2. Internal cache: Increase the cache size will help on instruction operations in the processor. Different kinds of internal cache will help on different instruction operations. 3. I/O access speed: With more peripherals, faster I/O access speed will reduce the peripherals initialization times. 4. Memory access speed: During boot process, there are huge mount of data access requirements. There will be more reduction of boot time when faster memory access speed is adopted. 5. Board specific hardware: Some board specific hardware will affect the boot time. For example: reset timing requirements of different processors, reset circuit design. If there are many peripherals supported by the processor, then the initialization time of processor will be taken longer. 4.3.2 Software Factors 1. Boot-loaders: Different versions of U-boot have the different CFI drivers, different coding structure and different features support. The difference will affect the code size, flash access speed, and then will affect the boot time. 2. File-systems: There are two type file-systems for NOR flash: Read/Write and Read Only. The different type of file-systems takes different initialization times and built times. 3. Compression algorithms: Embedded systems are usually memory constrained. How to improve and reduced memory usage is more important for embedded system designer. Data compression [18] is the major method to reduce the flash memory usage. There are many compression techniques and which one has best compression ratio and fast decompression speed is what system needed. We will have some short review of following compression method: Gzip, Bzip2, LZMA. Then we have these algorithms test results in Table 1. The experimental environment is on the PC. z Gzip: Gzip is short for GNU zip, a GNU free software file compression program. It is the most popular compression method of linux. It is not - 25 -.
(36) the best compressor, but it has the faster decompressed speed. Linux kernel, file-system, and most application support this compressor in default. z Bzip2: Bzip2 compresses most files more effectively than gzip, but it is slower. It is also support by Linux kernel. But it need more memory when decompress the data. For most embedded linux don’t support in default. z LZMA: LZMA provides high compression ratio and very fast decompression, so it is very suitable for embedded applications. Its compression ratio is higher than bzip2 and much higher than gzip but its decompression speed is only higher than bzip2. Many cost-sensitive embedded systems would use LZMA. Table.3 Compression Algorithm Test Decompression. Time (ms). Reduce. Size (kB). Original. Size (kB). Compression. Ratio (%). GZIP. 63.59%. 117460. 74694. 5586. (-9). 52.96%. 1902. 1007. 61. Bzip2. 70.84%. 117460. 83210. 24854. (--best). 56.33%. 1902. 1071. 354. LZMA. 84.69%. 117460. 99473. 8826. (-7). 64.66%. 1902. 1230. 193. 4. Kernel version: There are two versions of Linux kernel: 2.4.xx and 2.6.xx. The image size changed from 2.4 to 2.6 is increased. There are many new features supported in version 2.6.xx.. - 26 -.
(37) Chapter 5 EXPERIENMENTS. In this chapter we discuss the experimental environments and how to design the experiments for boot time analysis. Then the experimental results of each boot phase are provided. At the end of this chapter is the analysis of the experimental results.. 5.1 Environments The two platforms are used for the experiments. One is OMAP5912osk and the other one is MT Creator PXA270. Because some factors of the boot time are platform related, the factors of each platform are described below: 5.1.1 Factors of OMAP5912osk In OMAP5912osk platform, according to the design of chipset and software supporting, the factors could be modified for boot time experiments are: zHardware factor – CPU clock frequency: the range we used is 24, 48, 96, 192 MHz. The maximum frequency is 192 MHz. – Memory bus clock frequency: the range we used is 24, and 96MHz. Because the chipset limitation, the maximum frequency is 96 MHz. The flash access speed is fixed to 1/8 of memory clock frequency. – Peripheral and LCD clock frequency: the range we used is 24, and 48MHz. Because the chipset limitation, the maximum frequency is 48 MHz. – Cache on/off: the internal I-cache and D-cache of OMAP5912 could be turn on/off by software. zSoftware factor – Boot-loader: U-boot 1.1.1 and U-boot 1.1.3 could be used on OMAP5912osk. Version 1.1.1 only could be used for kernel version 2.4.xx and Version 1.1.3 could be used for kernel version 2.6.xx. - 27 -.
(38) – Kernel: Linux kernel version 2.4.20 and 2.6.15 are used for boot time analysis. – File-system: The file-systems used for root-fs of Linux are JFFS2, Cramfs and Squashfs. JFFS2 is Read/Write file-system. Cramfs and Squashfs are Read only file-system. – Compression algorithm: Zlib and LZMA are different compression methods used for Squashfs. But LZMA for Squashfs are only supported in the kernel 2.6.xx. 5.1.2 Factors of PXA270. In PXA270 platform, according to the design of chipset and software supporting, the factors could be modified for boot time experiments are: zHardware factor – CPU clock frequency: the range we used is 52, 104, 156, 208… and 520 MHz. The maximum frequency is 520 MHz. – System bus clock frequency: the range we used is 52, 104 and 208MHz. Because the chipset limitation, the maximum frequency is 208 MHz. – Memory clock frequency: the range we used is 52, and 104MHz. The memory access speed is fixed to 1/1 or 1/2 of system bus clock frequency. – Peripheral and LCD clock frequency: the range we used is 26, and 104MHz. Because the chipset limitation, the maximum frequency is 104 MHz. zSoftware factor – Boot-loader: U-boot 1.1.2 and U-boot 1.1.3 could be used on PXA270. – Kernel: Linux kernel version 2.6.15 is used for boot time analysis. – File-system: The file-systems used for root-fs of Linux are JFFS2, Cramfs and Squashfs. JFFS2 is Read/Write file-system. Cramfs and Squashfs are Read only file-system. – Compression algorithm: Zlib and LZMA are different compression methods used for Squashfs. But LZMA for Squashfs are only supported in the kernel 2.6.xx. Zlib, Bzip2 and LZMA could be used for kernel image compressed and de-compressed by U-boot.. - 28 -.
(39) 5.2 Factors for Boot Phase According to the Table 4, we know different factors changed could lead to obvious boot time changed. But more important is how these factors change affect the time of each phase. Table.4 Total boot Time Reduction with different factors modification OMAP5912 Boot time (ms) 24/96 43000/28967 (MHz) 24/96 28886/10567 (MHz). PXA270 Boot time (ms) 52/208 24981/18630 (MHz) 52/208 18630/13000 (MHz). RW FS/RO FS. 10567/5475. 13000/9017. Zlib/LZMA. 5475/8015. 9017/10141. Factors CPU Frequency Memory Speed. According to the view of chapter 3 and analysis of chapter 4, the factors for each phase of boot time on both platforms could be assumed below: zPhase 1: The time for the MPU reset. It is related to the chipset reset time requirement and related hardware reset circuit design on each platform. zPhase 2: The time for the MPU to reset boot device and peripherals. It is only related to chipset specification. How long reset signal will be asserted by the reset_out pin of MPU. zPhase 3: The time for U-boot doing simple hardware initialization and environments parameters relocated. It is related to MPU clock frequency, memory clock frequency, internal cache on/off and boot-loader version. zPhase 4: It is related to the memory clock frequency and internal cache on/off. zPhase 5: It is related to the MPU clock frequency, memory clock frequency, internal-cache on/off, boot-loader version, kernel version, which file-system is supported and which compression algorithm is used. zPhase 6: It is related to memory clock frequency and internal cache on/off. zPhase 7: It is only related to memory clock frequency zPhase 8: It is related to the MPU clock frequency, memory clock frequency, kernel version, which file-system is supported and which compression algorithm - 29 -.
(40) is used. zPhase 6’: In PXA270 platform, if the kernel will be decompressed by U-boot, then it is related to MPU clock frequency, memory clock frequency, which file-system is supported and which compression algorithm is used. zPhase 7’: In PXA270 platform, if the kernel will be decompressed by U-boot, then it is only related to memory clock frequency. zPhase 8’: In PXA270 platform, if the kernel will be decompressed by U-boot, then it is only related to system bus clock frequency. zPhase 9: It is related to system bus/memory clock frequency, internal cache on/off and kernel version. zPhase 10: It is related to the MPU clock frequency, system bus/memory clock frequency, internal-cache on/off, kernel version, which file-system is supported and which compression algorithm is used. zPhase 11: It is related to the MPU clock frequency, memory clock frequency, internal-cache on/off, kernel version, which file-system is supported and which compression algorithm is used. zPhase 12: It is related to the MPU clock frequency, memory clock frequency, internal-cache on/off, kernel version, which file-system is supported and which compression algorithm is used.. 5.3 Experiments Results According to the factors in 5.1, there are many experiments done by different factors modifications. According to the experiments, the major factors related to boot time of each platform is as following:. 5.3.1 OMAP5912osk Firstly the experiments are done under the environment of U-boot 1.1.1 and Kernel 2.4.20. Refer to Table 5 and Figure 12, time period of phase 3, 5, 8, 10, 11, and 12 are become much shorter with higher CPU clock frequency. These phases need more computing power than other phases.. - 30 -.
(41) Table.5 MEM: 24 / FS: JFFS2 Factor. Time (ms). CPU Freq.. P3. P5. P8. 96. 297.14. 2208.49. 1802.29. 24. 487.03. 2976.77. 4741.45. CPU Freq.. P 10. P 11. P 12. 96. 696.26. 2262.68. 461.62. 24. 1304.75. 5602.75. 1155.35. Figure 12:. CPU Frequency modified on OMAP5912. Refer to Table 6 and Figure 13, time period of phase 3, 4, 5, 6, 7, 8, 9, 10, 11, and 12 are all became much shorter with higher memory clock frequency. Except the phase 1 and 2 are related to board specific hardware, the other phases are related to functions execution. So increasing the memory clock frequency could decrease the time of those phases. Table.6 CPU: 96 / FS: JFFS2 Factor. Time (ms). MEM. P3. P4. P5. P6. P7. 96. 123.66. 94.43. 744.34. 3.26. 12.59. 24. 297.15. 300.4. 2208.79. 9.81. 50.15. - 31 -.
(42) MEM. P8. P9. P 10. P 11. P 12. 96. 1188.9. 462.65. 220.95. 895.01. 180.18. 24. 1802.16. 742.72. 696.2. 2274.66. 461.7. Figure 13:. Memory speed modified on OMAP5912. Refer to Table 7 and Figure 14 and 15, time period of phase 10, 11, and 12 are much shorter when change from JFFS2 to Cramfs and Squashfs. The initialization and built time of Read only file-system is much fast than the time of Read/Write file-system. The memory clock frequency has much more influence than CPU clock frequency. Because initialization and built of file-system need to access memory bus more frequently.. Table.7 Different File-systems Factor CPU/MEM. 96/96. 96/24. Time (ms) FS type. P 10. P 11. P 12. JFFS2. 220.99. 895.06. 180.27. Cramfs. 9.43. 630.83. 167.92. Squashfs. 7.3. 661.98. 79.34. JFFS2. 696.2. 2274.66. 461.7. Cramfs. 32.52. 1621.2. 432.48. Squashfs. 24.28. 1836.34. 217.62. - 32 -.
(43) Figure 14:. File-systems changed on OMAP5912. Figure 15:. File-systems changed on OMAP5912. - 33 -.
(44) Secondly the experiments are done under the environment of U-boot 1.1.3 and Kernel 2.6.15. Refer to Table 8 and Figure 16, time period of phase 3, 5, 8, 10, 11, and 12 are become much shorter with higher CPU clock frequency. These phases need more computing power than other phases.. Table.8 MEM: 24 / FS: JFFS2 Factor. Time (ms). CPU Freq.. P3. P5. P8. 96. 243.01. 2650.52. 2745. 24. 432.64. 3803.02. 7500.4. CPU Freq.. P 10. P 11. P 12. 96. 13137.3. 3853.2. 304.2. 24. 18105.4. 5799.9. 442.4. Figure 16:. CPU Frequency modified on OMAP5912. Refer to Table 9 and Figure 17, time period of phase 3, 4, 5, 6, 7, 8, 9, 10, 11, and 12 are all become much shorter with higher memory clock frequency. Except the phase 1 and 2 are related to board specific hardware, the other phases are related to functions execution. So increasing the memory clock frequency could decrease the time of those phases.. - 34 -.
(45) Table.9 CPU: 96 / FS: JFFS2 Factor. Time (ms). MEM. P3. P4. P5. P6. P7. 96. 110.12. 94.13. 950.82. 3.26. 11.33. 24. 243. 299.59. 2650.4. 9.84. 44.98. MEM. P8. P9. P 10. P 11. P 12. 96. 1878.35. 1654.19. 4458.2. 1280.1. 91.3. 24. 2686.5. 5644.3. 13138. 3851.9. 304.6. Figure 17:. Memory speed modified on OMAP5912. Refer to Table 10 and Figure 18 and 19, time period of phase 10 and 11 are much shorter when change from JFFS2 to Cramfs and Squashfs. The initialization and built time of Read only file-system is much fast than the time of Read/Write file-system. The memory clock frequency has much more influence than CPU clock frequency. Because initialization and built of file-system need to access memory bus more frequently.. Table.10 Different File-systems Factor CPU/MEM. 96/96. Time (ms) FS type. P 10. P 11. JFFS2. 4457.3. 1280.45. Cramfs. 12.4. 863.8. Squashfs. 10.17. 737.86. - 35 -.
(46) 96/24. JFFS2. 13137.9. 3851.9. Cramfs. 48.8. 2866.6. Squashfs. 41.95. 2374.15. Figure 18:. File-systems changed on OMAP5912. Figure 19:. File-systems changed on OMAP5912 - 36 -.
(47) Refer to Table 11 and Figure 20, 21 and 22, time period of phase 10 and 11 are much longer when changes compression algorithm of Squashfs from zlib to lzma. But with more fast CPU clock and memory clock frequency, the time would become shorter.. Table.11 Compression Algorithm of File-system and CPU clock Factor CPU/MEM 96/96. 96/24. 196/96. Figure 20:. Time (ms) FS type. P 10. P 11. Squashfs(zlib). 10.17. 737.86. Squashfs(lzma). 24.01. 3242.1. Squashfs(zlib). 41.95. 2374.2. Squashfs(lzma). 63.55. 4545.4. Squashfs(zlib). 7.9. 516.91. Squashfs(lzma). 15.63. 1752.37. Compression algorithm of Squashfs changed on OMAP5912. - 37 -.
(48) Figure 21:. Compression algorithm of Squashfs changed on OMAP5912. Figure 22:. Compression algorithm of Squashfs changed on OMAP5912. The effects of different version of U-boot and kernel are list in Table 12, Figure 23 and Table 13, Figure 24. Refer to Table 12, the new version of Linux kernel need more time at phase 5, 8, 9, 10, and 11. The version 2.6.xx support more new features than 2.4.xx. Even the same application is also changed to new revision. So kernel image size will much - 38 -.
(49) bigger than 2.4.xx. Then the time of kernel decompression take much longer. New driver support, or more features of device s initialization also take more time. But at phase 12 2.6.xx kernel take shorter time to run the same RC script and enable the same shell than 2.4.xx kernel.. Table.12 U-boot: 1.1.3 / FS: JFFS2 Factor CPU/MEM 96/96 CPU/MEM 96/96. Figure 23:. Time (ms) Kernel. P5. P8. P9. 2.4.20. 632.71. 1188.89. 462.61. 2.6.15. 950.82. 1878.35. 1654.19. Kernel. P 10. P 11. P 12. 2.4.20. 187.78. 838.47. 175.85. 2.6.15. 4458.19. 1280.05. 91.3. Kernel version changed on OMAP5912. Refer to Table 13, the new version of U-boot shorten the time of phase 3, 5, and 10. The version 1.1.3 optimization the initialization of U-boot and improve the image verification and movement methods. Table.13 Kernel: 2.4.20 / FS: JFFS2 Factor CPU/MEM. Time (ms) U-boot. P3. P5. P 10. 1.1.1. 124.56. 744.32. 220.99. 1.1.3. 110.93. 632.64. 187.62. 96/96. - 39 -.
(50) 192/96. Figure 24:. 1.1.1. 90.8. 612.08. 176.36. 1.1.3. 77.22. 500.57. 141.86. U-boot version changed on OMAP5912. 5.3.2 PXA270. In the PXA270 platform, the experiments are done under the environment of U-boot 1.1.3 and Kernel 2.6.15. Refer to Table 14 and Figure 25 and 26, time period of phase 8, and 11 are become much shorter with higher CPU clock frequency. These phases need more computing power than other phases.. Table.14 FS: JFFS2 Factor SysBus/MEM 208/104. 52/52. Time (ms) CPU Freq.. P8. P 11. 520. 673.20. 524.70. 208. 1324.75. 779.85. 208. 1600.4. 1288.1. 52. 4879.9. 2578.75. - 40 -.
(51) Figure 25:. CPU frequency modified on PXA270. Figure 26:. CPU frequency modified on PXA270 - 41 -.
(52) Refer to Table 15 and Figure 27, time period of phase 9, 10, 11, and 12 are all become much shorter with higher memory clock frequency. Although most phases need frequently memory access, only these phases have much improvement by higher system bus clock frequency. Table.15 CPU: 208/ FS: JFFS2 Factor. Time (ms). SysBus./Mem. P9. P 10. P 11. P 12. 208/104. 1980.6. 3736.25. 779.85. 115.95. 52/52. 2710.75. 7802.05. 1288.1. 163.2. Figure 27:. System bus speed modified on PXA270. Refer to Table 16 and Figure 28 and 29; time period of phase 10 is much shorter when changing from JFFS2 to Cramfs and Squashfs. The initialization and built time of Read only file-system is much fast than the time of Read/Write file-system. The CPU and memory clock frequency have only few influence on phase 10 with different file-system type.. Table.16 File-system and CPU clock Factor CPU/SysBus 208/208. Time (ms) FS type. P 10. JFFS2. 3736.25. Cramfs. 16.78. Squashfs. 6.46. - 42 -.
(53) 520/208. 520/104. JFFS2 Cramfs. 3618.55 15.6. Squashfs. 5.24. JFFS2 Cramfs. 3836.05 17.54. Squashfs. 6.38. Figure 28:. File-systems changed on PXA270. Figure 29:. File-systems changed on PXA270 - 43 -.
(54) Refer to Table 17 and Figure 30 and 31, time period of phase 10 and 11 are much longer when changes compression algorithm of Squashfs from zlib to lzma. But with more fast CPU clock and memory clock frequency, the time would become much shorter. Fast CPU clock frequency will let LZMA algorithm more faster and more similar to zlib and Cramfs.. Table.17 Compression Algorithm of File-system and CPU clock Factor CPU/SysBus 208/208. 520/208. 520/104. Figure 30:. Time (ms) FS type. P 10. P 11. Squashfs(zlib). 6.46. 623.33. Squashfs(lzma). 13.46. 1724.35. Squashfs(zlib). 5.24. 499.75. Squashfs(lzma). 8.28. 906.45. Squashfs(zlib). 6.38. 577.07. Squashfs(lzma). 13.46. 960.09. Compression algorithm of Squashfs changed on PXA270. - 44 -.
(55) Figure 31:. Compression algorithm of Squashfs changed on PXA270. 5.3.3 Others From first instruction in the boot-loader to the end of shell prompt output, all the function executions need to using internal caches of processor. In these platforms, only on OMAP5912 it supports enable/disable the internal I-cache or D-cache by software configurations. So referring to Figure 32 and 33, in the U-boot stage only I-cache enabled would reduce the boot time of the boot-loader stages. In the kernel and user space stage, I-cache or D-cache enabled could reduce the boot time of these two stages, but D-cache affect the boot time more than I-cache. Both caches enabled could reduce most boot time.. Figure 32:. Caches enable/disable in the boot-loader stage - 45 -.
(56) Figure 33:. Caches enable/disable in the kernel and user space stage. According to the CPU/memory speed modification on OMAP5912, there is an optimization CPU/memory speed ratio for the boot time reduction. Refer to Table 18, 19 and Figure 34, 35, the CPU/memory speed ratio kept 4:1 could lead to most influence of the boot time reduce.. Table.18 CPU/Memory speed ratio on OMAP5912 CPU/MEM. Ratio. P3. P4. P5. P6. P8. P9. P10. P11. P12. Total. 24/24 -> 48/24 1-->2 30.4% 14.7% 20.9% 23.3% 44.2% 9.3% 18.3% 25.4% 21.6% 22.8% 48/24 -> 96/24 2-->4 19.3%. 6.1%. 11.9%. 5.6%. 34.4% 3.3% 11.1% 11.0% 12.3% 12.8%. 4.9%. 0.5%. 7.3%. 2.5%. 20.0% 1.4%. 96/24->192/24 4-->8. 5.0%. 5.5%. 7.7%. 5.9%. P11. P12. Total. Table.19 CPU/Memory speed ratio on OMAP5912 CPU/MEM. Ratio. P3. P4. P5. P6. P8. 24/24 -> 48/24 1-->2 30.4% 14.7% 20.9% 23.3% 44.2%. P9 9.3%. P10. 18.3% 25.4% 21.6% 22.8%. 24/24 -> 96/24 1-->4 43.8% 19.9% 30.3% 27.5% 63.4% 12.2% 27.4% 36.6% 31.2% 32.6% 24/24->192/24 1-->8 46.6% 20.3% 35.4% 29.4% 70.7% 13.5% 31.1% 37.2% 36.5% 36.6%. - 46 -.
(57) Figure 34:. CPU/Memory speed ratio on OMAP5912. Figure 35:. CPU/Memory speed ratio on OMAP5912. On PXA270 platform, kernel image uncompressed could be done by the U-boot. Refer to Figure 36 and 37, the z-lib uncompressed at the kernel stage is more fast than other uncompressed algorithm at the U-boot stage. But LZMA algorithm has the highest compression ratio. If the system has the storage limitation, LZMA is a better choice for the kernel compression algorithm.. - 47 -.
(58) Figure 36:. Figure 37:. Kernel image uncompressed time of different algorithms. Compression ratio of different compression algorithms. 5.4 Analysis Results The factors, no mater hardware or software, all have influence on some phases in the boot times. But at some phases some factors only have minor influence. With those changes can’t have many improvement of boot time reduction. So according to the section 5.3, there are some major factors which lead to great improvements at some phases. The experiments are done on OMAP5912osk and PXA270 platforms. Both platforms have different architectures. OMAP5912 have great improvement in boot time when modify the CPU and memory clock frequency. But PXA270 only have improvement at fewer phases when modify the CPU and memory clock frequency. - 48 -.
(59) Different file-system types only major affect the phase 10, 11, and 12 of boot time in both platforms. When it is using kernel 2.6.15, the time phase 12 don’t affect by different file-system types. But kernel 2.4.20 will. Because the architectures are different, the higher CPU and memory clock frequency could get great improvement in phase 10, 11, and 12 with different file-systems type on OMAP5912 platform. But on PXA270 platform those two factors modifications don’t affect such more times of phase10, 11, and 12 when using JFFS2, Cramfs and Squashfs. Compression algorithm could be change at both the kernel image and file-systems. But the kernel image with different compression algorithm only could be used at U-boot on PXA270 platforms. The decompression speed is very slow under U-boot stage. When using LZMA compression algorithm for the Squashfs, the times will be longer than original one using zlib. But when the system has the powerful processor, the Squashfs with LZMA algorithm could almost reach the same time as original with zlib algorithm. Because only OMAP5912 could switch the internal cache on/off, the results of experiments are that only I-cache affects the time of U-boot and both I-cache and D-cache affect the time of the Kernel. When changing to the new version kernel and U-boot on OMAP5912 platform, the new version kernel need more time for boot-up and new version U-boot need less time for boot-up. The kernel version 2.6.15 support more features by default and enhance the features from old version 2.4.20. So the large size of image also affect the boot time of the boot-loader. The U-boot version 1.1.3 optimizes the initialization process of U-boot and improves the methods of verification and movement of kernel image. Boot time is related to the system architecture, software factors, hardware factors and related peripherals. So according to the analysis at section 5.4.3 and experiments results of section 6.3, there are some conclusions of this chapter: OMAP5912, with Dual-core architecture, have more flexible bus architectures so the faster CPU and memory clock frequency could have great improvement in boot time. But after the frequency ratio of the CPU and the memory bus over 4:1, the improvement will slow down. Because of the flexible bus architectures, when using different type of file-systems, the modification of CPU and memory still could improve the boot time. Dual-core architecture also separates the peripherals - 49 -.
(60) into two groups and this will reduce the initialization of boot time. PXA270, with single-core architecture, major use system bus for all communication between processor and peripherals. So even using higher CPU and memory clock frequency, the improvements are limited. When it is at the phase needing frequently peripherals access, the boot-up speed is bounded by the bus architecture. Even using powerful single-core processor, there are many peripherals needed to be initialized by the processor. So it needs more time for booting up the system. The kernel image configurations of these two platforms are all using the default configuration of the Linux kernel. But these two platforms supporting different peripherals and default inserted different device drivers. So the kernel initialization time at the kernel stage will much different of these two platforms. Therefore in the thesis it is more focused on the factors related to each phases.. - 50 -.
(61) Chapter 6 CONCLUSION. More and more multimedia device are developed. The trend is using open source Linux kernel as system operating system. The boot time of such device are become longer and longer. So in this thesis we use two platforms, OMAP5912 and PXA270, to analysis the Linux system boot time. Because Linux is not a real-time OS, it needs extra DSP core or one more powerful processor to handle many real-time applications. We choose one Dual-core platform and on powerful single-core platform as our experimental platforms. Then we modify the hardware and software factors of boot time to see which factors play a major role in the boot time and the relationship between hardware and software factors. According to the architecture analysis and the experimental results, we found that Dual-core architecture has benefits to reduce the boot time of systems. Dual-core has more flexible bus architectures and separates the peripherals into two groups to reduce the initialization time of boot-up. The hardware factors improvements in Dual-core platform have better impact on software factors change. According to the boot procedures analysis and experimental results, we could know that the boot procedures are most related to the memory device access. Because all hardware related assembly code, software functions and device drivers are needed to execute between the main processor and memory devices. The total boot times of the embedded Linux system are most bounded by the memory bus. However the platform selection is usually restricted, so how to achieve the boot time optimization under limited environments is more important. In the thesis we point out which factor has major influence on which phase. When you have a different embedded Linux system for your application, but some factors are fixed. For example CPU frequency is not higher, memory size is limited, or new kernel version is chosen, we could focus on the phases which is major bounded by these factors, such as to lower the CPU usage, to choose the higher compression ratio but fast compression algorithm, or remove the unused - 51 -.
(62) functions in the new kernel version to achieve the boot time optimization.. - 52 -.
(63) Chapter 7 Future Work. We already know some factors are the major factors of the boot times. But the experiments of these factors are also limited by the platforms we chosen. Except these factors, we’ll try to analysis the influence of the MMU supported and different compiler modes. The boot procedures should be also related to the MMU supported or not. The MMU supported should have the better memory utilization and easier software programming. But if the systems boot up phases need less memory requirements or not bounded by the memory, MMU supported or not should not serious affect the boot times. When the systems boot up need large memory requirements, the MMU supported should benefit the boot time of memory bounded phases. Using different compiler modes to supports the 32-bit ARM or 16-bit Thumb instruction sets, it could provide the user to trade off between high performance and high code density so it will also affect the boot time of the systems. It could reduce the code size of user application program if supporting Thumb instruction in the kernel. But these modifications may affect the existing software module execution and let special 3rd party applications unstable.. - 53 -.
(64) REFERENCES. [1] The Consumer Electronics Linux Forum, “Kernel Execute-In-Place,” http://tree.celinuxforum.org/CelfPubWiki/KernelXIP [2] Jimmy Wennlund, “Next Generation Init System – InitNG,” http://www.initng.org/ [3] Keun Soo Yim, Jihong Kim, and Kern Koh, “A Fast Start-Up Technique for Flash Memory Based Computing Systems,” Proceedings of the ACM Symposium on Applied Computing, 2005 [4] Tim R. Bird, “Methods to Improve Boot Time in Linux,” Proceedings of the Ottawa Linux Symposium, Sony Electronics, 2004 [5] Linus Torvalds, “The Linux Kernel Archives,” http://www.kernel.org/ [6] Wolfgang Denk, “Das U-Boot - Universal Bootloader,“ http://sourceforge.net/projects/u-boot/ [7] Rob Landley, “BusyBox - The Swiss Army Knife of Embedded Linux,” http://www.busybox.net/ [8] Alessandro Rubini, Jonathan Corbet, “Linux Device Drivers, Second Edition,” O'Reilly Media, Inc., 2001 [9] Texas Instruments, “OMAP5912 Applications Processor (Rev. E),” http://www-s.ti.com/sc/ds/omap5912.pdf [10] Texas Instruments, “OMAP5912 Multimedia Processor OMAP3.2 Subsystem Reference Guide (Rev. B),” http://www-s.ti.com/sc/psheets/spru749b/spru749b.pdf [11] Texas Instruments, “OMAP5912 Applications Processor Silicon Errata (Rev. I),” http://focus.ti.com/lit/er/sprz209i/sprz209i.pdf [12] Intel, “PXA27x Processor Family Developer's Manual,” [13] Intel, “PXA27x Processor Family EMTS,” [14] Intel, “Intel XScale Core Developer's Manual,” [15] Intel, “PXA27x Processor Family Specification Update,” [16] Catherine Dodge, Cynthia Irvine, and Thuy Nguyen, “A Study of Initialization in Linux and OpenBSD,” ACM SIGOPS Operating Systems Review, Vol. 39, Issue 2, pp. 79-93, April 2005 - 54 -.
數據

+7
相關文件
Given proxies, find the optimal placement of the proxies in the network, such that the overall access cost(including both read and update costs) is minimized.. For an
Promote project learning, mathematical modeling, and problem-based learning to strengthen the ability to integrate and apply knowledge and skills, and make. calculated
We have proved that both M and m are finite real numbers.. We have proved that both M and m are finite
In addressing the questions of its changing religious identities and institutional affiliations, the paper shows that both local and global factors are involved, namely, Puhua
命令解釋程式 作業系統 (MS-DOS,UNIX, WINDOWS 98/NT, 2000, XP, LINUX).
Performance metrics, such as memory access time and communication latency, provide the basis for modeling the machine and thence for quantitative analysis of application performance..
• In Shutter-speed priority mode, photographers sets the shutter speed and the camera deduces the aperture. • In Program mode, the camera decides both exposure and shutter
• In Shutter-speed priority mode, photographers sets the shutter speed and the camera deduces the aperture. • In Program mode, the camera decides both exposure and shutter
