行政院國家科學委員會專題研究計畫 期中進度報告
嵌入式網路通訊裝置評比技術與工具之研發--子計畫二:嵌
入式網路通訊裝置耗能評比基準與工具之研發(中心分
項)(1/2)
期中進度報告(精簡版)
計 畫 類 別 : 整合型 計 畫 編 號 : NSC 98-2220-E-009-046- 執 行 期 間 : 98 年 08 月 01 日至 99 年 07 月 31 日 執 行 單 位 : 國立交通大學資訊工程學系(所) 計 畫 主 持 人 : 曹孝櫟 處 理 方 式 : 本計畫可公開查詢中 華 民 國 99 年 06 月 26 日
1. Introduction
Mobile embedded devices are battery powered devices and they have limited run-time due to the limited battery capacity. Limitation of battery capacity has been a problem since the invention of the battery. This limitation has become even a bigger burden for mobile devices especially after wireless networking era. To obtain aforementioned benefits through improvements in software components, it is necessary to analyze energy characteristics of these components preferably in real or close-to-real platforms. Obviously, this requires software designers to collect sufficiently detailed data, which represent the energy characteristics of their applications and systems, by using a set of proper tools. Being motivated by this need in the last decade, researchers have put intensive efforts to build such tools. These tools, hereafter referred to as energy profiling tools, basically aim to provide data about resource usage of applications by collecting system-level data. Application developers can analyze outputs of energy profiling tools to spot the “hot” portions of the code they have written and then optimize them for better performance and lower energy consumption. Additionally, they can write and test applications that make use of some specific system parameters or user-inputs to conserve energy on specific run-time cases, thus applications can become energy-aware.
The resolution and accuracy of data that these tools provide vary according to the way how they instrument the underlying hardware/software infrastructure. Traditionally these tools have been categorized into two main groups; simulation-based [7, 8, 9, 10, 11, 12] and measurement-based [1, 2, 3, 4, 5, and 6] tools. A few of the existing measurement-based energy profiling tools can provide energy consumption of CPU, memory and disk separately for an application [2, 4]. These hardware components are among the most energy-hungry ones in a typical embedded system, so this design consideration is reasonable. There are some tools that include WNIC (Wireless NIC) devices to this list [5]. Although WNICs are considered as typical I/O devices like disks in these tools, they are actually not. As known, WNICs are used to transmit and receive packets of data via radio waves, not cables. Air as the transmission medium, the distance between wireless card(s) and access point(s), channel contentions, noise and many other factors can directly or indirectly affect the transmission of packets. This exceptional I/O characteristic makes it quite a challenge to obtain a stable and realistic energy consumption figure for a specific real-life wireless channel behavior. This challenge may especially restrict developers from optimizing for lower energy consumption and turning embedded applications into energy-aware ones. To overcome the challenge, an energy profiling tool must provide a user-friendly platform that allows developers to test applications repeatedly against these channel behaviors.
Being motivated by this necessity, we attempted to build an energy profiling tool, named PowerMemo, which can profile energy consumption of applications while emulating any desired set of wireless channel behaviors in a controllable wireless environment. Our contribution to the existing energy profiling tools is the hardware/software platform that allows developers to emulate these channel behaviors by creating and running wireless field test scenarios, hereafter referred to as mobility scripts.
Results of our experiments demonstrate that the overhead of PowerMemo does not exceed 1% in most cases. Using PowerMemo, we have been able to reduce energy consumption of an email application by 30%.
2. Design and Implementation of PowerMemo
PowerMemo has the following functionalities: (1) Produces per process energy consumption results of CPU and WNIC. Produces per C-code-block energy consumption results of CPU(Provided marker IOCTLs must be used to mark the beginning and end of a C-code-block) (2) Calculates CPU power rating for each process. (3) Outputs total CPU time spent and number of bytes transmitted and received by each process. (4) Emulates a user-defined mobility script by controlling wireless channel conditions in an RF-isolated chamber.
The key design goals for PowerMemo were to provide a low-overhead and sufficiently accurate energy profiling tool that can simultaneously profile energy usage and perform WLAN field tests, and to have the highest portability and user-friendliness.
Our first design goal, low-overhead has always been one main criteria for tools that instrument the target devices. The opposite of this, high-overhead, has the high risk of causing tool to produce erroneous or less accurate results. This design consideration is especially critical for embedded devices. Since they have quite limited hardware resources, a high-overhead tool may prevent the target applications from running normally, thus causing to produce different results from the cases when running without the profiling tool. To achieve the first goal, we separated the process of profiling system activities and process of mapping power measurements with profiled system activities into two different stages. We also provided a command line argument in the user-daemon for users to adjust frequency of periodic file saves. Frequent file I/O may cause large overhead at the cases when CPU is highly utilized, so we thought it could be beneficial to have the frequency argument. Tool users can pick a proper frequency value that minimizes user-daemon overhead. To meet the goal, we also minimized the clock cycles spent in each instrumentation function of our kernel module. According to our measurements average overhead of PowerMemo does not exceed 1%.
As the second design goal, kernel portability was considered to be important since our tool targeted mobile embedded devices. PowerMemo was designed to produce per process and per C-code-block energy consumption results that consist of individual energy results of some most energy-hungry hardware components (CPU and WNIC). The existing energy profiling tools which provide this level of detailed results instrumented the specific drivers in the kernel. We considered that would restrict our tool to be ported to other hardware architectures. Of course it would not be impossible, but would require tedious hours of driver code tracing and testing. Such as for our WNIC, if we wanted to instrument the driver code, we would not only have to understand the internals of physical layer, but also have to deal with the coding style and naming conventions that driver developer used. So as a result, we managed to escape driver level instrumentation by only modifying the new mac80211 subsystem [13] in the kernel. This subsystem provides a framework for the soft-MAC or half-MAC wireless devices. In these type of devices, the 802.11 frame management (MLME) is performed by software. This allows for a finer control of the hardware, and provides valuable information that was once only available in hardware logic or device driver. Because most of the 802.11 devices today are soft-MAC type, our tool can be easily used with various types of WNIC devices
We put our best effort to provide the highest accuracy and user-friendliness possible while striving to achieve above design goals. We started the design process by evaluating the existing
measurement-based energy profiling tools. Our purpose was to identify the most useful functionalities of all these tools and combine them with the WLAN field test emulator.
HW Instrumentation for Power Measurement Voltage/Current Sampling and Logging User-defined Mobility Scripts
WLAN Field Test Simulation 6. Map Power Measurements to Profiling Results User-Daemon for Recording/Transferring Profiling Results
Kernel Module for Collecting Kernel-level Data about User Apps
Target Mobile Device
Kernel Instrumentation Wireless NIC CPU 1. Send “BEGINTEST” 2. Trigger DAQ 3. Sample I/V
PowerMeMo Control Center
4. Send “ENDTEST” 5. Receive Profiling Results IOCTL_ MARKER User Apps
Figure 1: Operational overview of PowerMemo.
Figure 2: System architecture of PowerMemo.
As depicted in Figure 2, PowerMemo consists of two different sets of hardware/software components; target side components and host side components. At the core of host side components is the graphical user interface (GUI), or as we titled “PowerMemo Control Center”. The GUI is mainly responsible for collecting power measurement results from DAQ card, controlling the signal attenuator to emulate the mobility script that user defined and mapping the power measurements with the results of target profiling to calculate the total energy consumption for each process and function. The main component at the target side is the kernel module that
provides the instrumentation functions to collect kernel level data. We have a few instrumentation points where we call the relevant functions from this kernel module. These functions basically store time of system activities and some other parameters needed. A user-space daemon keeps transferring these kernel level data from kernel-space to user-space as files, and at the end of the profiling it automatically transfers these files to host side for the mapping process. An operational overview of PowerMemo can be seen in Figure 1 and system architecture in Figure 2.
Kernel Module and User Daemon
To provide a modular interface that eases development and porting efforts, we developed a Linux kernel module, “powermemo.ko”, which is a type of character device. Current implementation was built against kernel version 2.6.28. This module is the so called “System Monitor” that collects information about the system activities of our interest. These instrumentation functions basically store the current time that is returned by “do_gettimeofday()” and several other kernel parameters like Process ID, size of transmitted/received packet, etc. Our user-daemon, “pmemo_client”, is responsible for several tasks. First of all it is responsible for transferring profiling results from the allocated kernel-space buffer to user-space. It periodically saves these results to files to prevent the limited buffer space from overflowing.
Recording System Activities
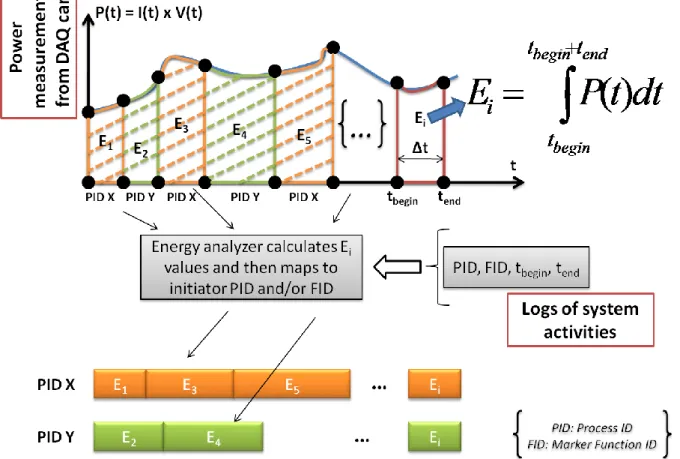
As known, energy is equal to power value multiplied by duration (E=P x ∆t), that’s, energy of an activity is a function of duration. In measurement-based energy profilers, while power values are obtained from measurement device, duration values (∆t) are generally obtained from underlying operating system by recording begin and end time of activities. Since different hardware components may be serving different processes at the same time slice, target hardware components (in our case, CPU and WNIC) as well as processes must be distinguished during profiling process. Then separate energy values of these hardware components and processes for a given duration can be calculated by multiplying the power values measured between begin and end time by the duration value.
Recording CPU System Activities
Begin and end time of each process activity in a CPU can be easily obtained by modifying the scheduler function of underlying kernel. The scheduler gives each process a time quantum to use CPU exclusively. A process may or may not use the whole time quantum, and the interval it uses is defined as CPU time slice. A process activity on CPU happens when this time slice is used. Therefore we can add the instrumentation functions at the point where the current process is scheduled out and a new one is scheduled in. Because this is the exact point where the previous time slice ends and new one begins, we can correctly record begin and end time of activities here. PIDs (Process ID) of processes which are given the time slices can be simply obtained by reading task data structures of these processes.
Recording WNIC System Activities
To obtain begin and end time of process activities that cause energy consumption in the WNIC, we have employed a novel technique that takes advantage of the new mac80211
subsystem in Linux kernel. This subsystem provides a framework for soft-MAC or half-MAC type of WNIC devices. It lies between the kernel’s networking stack and WNIC device drivers and provides valuable information that was once only available in hardware logic or device drivers. We can get the data bit rate value for each packet transmitted or received from this subsystem without modifying any driver code. Most of the modern WNIC devices now employ the framework which mac80211 provides, thus our tool can easily adapt to the majority of existing WNIC devices without any instrumentation in the device drivers.
A duration value (∆t) is the key to energy calculation for a system activity, but is not sufficient to be able to charge processes correctly for the energy they consume. We also need to identify the processes that are responsible for the energy consumed during every set of begin-end time. As briefly explained in the previous subsection, achieving this for CPU is as simple as reading the task data structure, but generally for I/O components, it is more complicated due to the asynchronous nature of I/O operations. When a process writes data to a socket, this data travels down through the layers of kernel’s network stack and finally reaches the device driver as a packet. At some time during this flow, when we sniff the packet that is forming, the current active process may have already been changed by kernel scheduler. If we simply record the current PID at this time, we may incorrectly identify the initiator of this system activity. To solve this problem for WNIC devices, we have added one more item, PID, to the socket data structure. When we record the time values for a packet, we simply access this item through the packet’s socket structure.
Power Measurement
We employed the PCI-6115 data acquisition (DAQ) card from National Instruments as the measurement device. This card has 4 analog inputs and a trigger input. There are many different types of DAQ cards provided by National Instruments. All these cards support a common API that can be used under various programming languages like VB, C, C++ and C#. Although our card is a high-end model, any other NI card with 4 analog inputs and 1 trigger input can be used with our tool.
Correlating Power Measurements with System Activities
One important task of PowerMemo Control Center is to map, or correlate, power measurements with system activities. After a test is finished, user-daemon transfers profiling results to host side. When this transfer ends, energy consumption analyzer module in the control center analyzes the result file of CPU system activities to detect the PID and FID (Marker Function ID) values that were collected during the test. Later on PID values are charged with energy values for both CPU and WNIC activities. As one of PowerMemo’s limitation, FID values are charged only with the energy values of CPU activities. Figure 3 illustrates this process.
Figure 3: Mapping power measurements with system activities.
Time Synchronization between Host and Target
We collect power measurements and system activities at two different devices, and hardware clock, thus system clock, of these two devices are not synchronized. We use time values to map measurements with activities. Therefore we need to synchronize the clocks for correct mapping. There are two common techniques to achieve clock synchronization. The first one is to use external trigger mechanism of measurement device like in [1]. Although this technique produces acceptable results, it requires one more trigger pin from the measurement device. Because we have used the only available trigger pin of our measurement device, we were unable to employ this technique. The second well-known technique is to use NTP (Network Time Protocol). An NTP server runs in the host PC, and a NTP client in the target mobile device. Right before measurement begins, host and target synchronizes system times using NTP service, then measurement and profiling can begin. The NTP client periodically connects to NTP server for re-synchronization.
Wireless Environment Emulator
Emulating wireless environment is achieved by using a wireless signal attenuator and a RF-shielded chamber. A Wireless LAN (WLAN) channel model is employed to calculate the signal attenuation caused by movement of the mobile device under test. Then attenuator is set to this attenuation value. Since the mobile device is in a preserved volume that is filled with the controlled wireless signal, it gradually senses the attenuation as if it was moving away/close from/to wireless AP. We have designed a simple scripting language to allow users to run desired scenario for a wireless field test. We call a script written with our language as a mobility script
since it allows users to define movements of a mobile device. When a user loads a mobility script, the control center first parses the script, calculates the distance from the wireless AP, and then feeds it to our WLAN channel model. After that the model calculates the signal attenuation for the given distance. Finally, this attenuation value is sent to the signal attenuator. Wireless channel models are used to simulate the channel conditions. PowerMemo employed the below primitive channel model for the current version presented here. We plan to use a more enhanced model in the future.
Run Scripts
Run scripts are used to run the desired benchmarks in target mobile device. For the current version of PowerMemo, we have used simple bash scripts at target side. Paths of programs that are planned to test are inserted to the “runtest.sh” script. When user clicks the “START” button at the control center’s main window, user-daemon is triggered to start benchmarks and profiling. After profiling begins, the user-daemon runs this bash script to load the benchmark programs so that profiler can record their system activities.
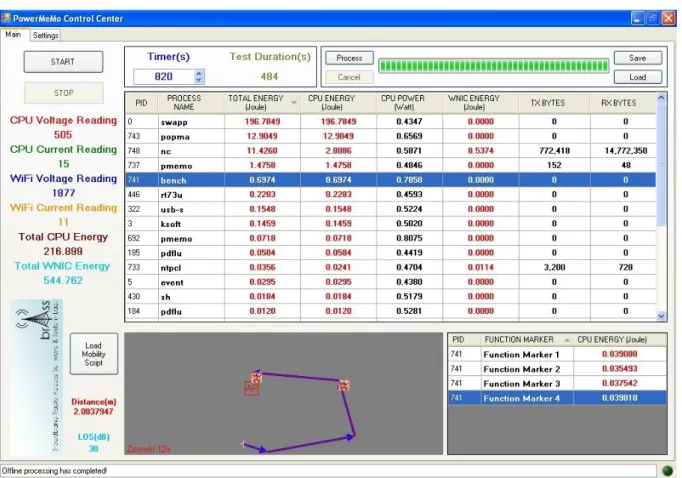
Control Center and Result View
As the hearth of the tool, PowerMemo Control Center contains several of the most important modules like power measurement module, energy consumption analyzer, and wireless environment emulator. If wished, users can define and load a mobility script to emulate a wireless field test during energy profiling. They can view the actions of an active mobility script. After energy analyzing ends, results are listed in a tabular format like in Figure 4.
Figure 4: Main window of PowerMemo control center.
We tested the usefulness of our energy profiling tool by using it to turn a simple email client application into an energy-aware and network-aware one. The application (popmaildir) [21] is a command line based application and does not have built-in TCP transport mechanism. That’s, it needs external programs like netcat or tcpclient to be able to fetch or send emails. In this test case, it connects to an email server on internet and receives one email with a 10MB attachment.
Energy consumption of an application can be reduced by applying numerous techniques, such as by optimizing the algorithm to take less time to complete, or to consume less memory, etc. Because our tool aims to combine energy profiling with emulation of wireless environment, in this case study, we focused on the techniques that make applications aware of external conditions, specifically wireless network conditions, that can cause them consume more or less energy. Being able to test various optimization techniques and mobility scenarios in terms of energy consumption and network behavior, we were able to successfully optimize the email client in a way that it can adapt itself to changing wireless channel conditions, hence became an energy and network aware application.
Our optimization method is based on the notion that the energy consumption of an application is directly related with the amount of time that application uses CPU or WNIC device for. Such as, if the application uses WNIC device for shorter time periods, the device can sleep for longer durations, thus can conserve more energy. To use WNIC device for a shorter duration, application must transmit or receive data, in our case one email with a 10MB attachment, with the highest achievable bit rate, and highest bit rate can be achieved only when wireless signal quality is the best.
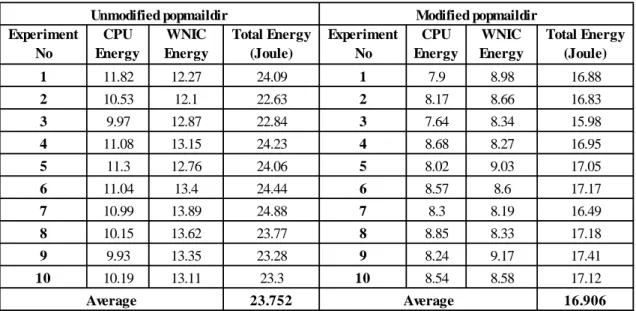
Unmodified version of email client does not observe wireless signal level. It immediately begins to download the email. On the other hand, modified version of the email client periodically observes wireless signal level to receive the email at the highest bit rate possible. If the level is below a certain threshold (-82dBm), it sleeps for a while. When it detects the level is above the threshold, it begins to download the email at a high bit rate. In total, we ran 20 sets of experiments for unmodified and modified versions of email client. Table 1 lists the results of these experiments.
Table 1: Results of case study
Experiment No CPU Energy WNIC Energy Total Energy (Joule) Experiment No CPU Energy WNIC Energy Total Energy (Joule) 1 11.82 12.27 24.09 1 7.9 8.98 16.88 2 10.53 12.1 22.63 2 8.17 8.66 16.83 3 9.97 12.87 22.84 3 7.64 8.34 15.98 4 11.08 13.15 24.23 4 8.68 8.27 16.95 5 11.3 12.76 24.06 5 8.02 9.03 17.05 6 11.04 13.4 24.44 6 8.57 8.6 17.17 7 10.99 13.89 24.88 7 8.3 8.19 16.49 8 10.15 13.62 23.77 8 8.85 8.33 17.18 9 9.93 13.35 23.28 9 8.24 9.17 17.41 10 10.19 13.11 23.3 10 8.54 8.58 17.12 23.752 16.906
Unmodified popmaildir Modified popmaildir
Average Average
each test, the modified email client waited for about 380 seconds before downloading the email. The slight differences between each set of experiment in the same column are caused by several factors in our tool setup. One main reason is that we used a free email server from internet. Due to the server loading, sometimes it may take longer or shorter time to download the email with 10MB attachment. Depending on the time it takes to download, this may cause grater or smaller energy consumption on CPU. Another reason is that we cannot keep transmit bit rate of our wireless AP fixed. Transmit bit rate is automatically decided by the AP, and unfortunately we cannot modify the setting for this behavior. According to our readings, bit rate dynamically changes for each packet received from AP. This dynamic behavior causes a slight fluctuation in the total WNIC energy consumption.
4. Summary
In this project, PowerMemo, which is a measurement-based energy profiling tool with software controllable wireless environment was proposed and implemented. We reduced the energy consumption of a simple email client application by 30% using PowerMemo. The observed overhead of PowerMemo does not exceed 1% in most cases. We believe PowerMemo can help its users better understand the relation between energy consumption and wireless network conditions, thus enables to develop better energy efficient applications.
We are going to release PowerMemo source codes through Openfoundry. Meanwhile, we are preparing two papers based on this project and will submit them to international journals.
References
1. Flinn, J., and M. Satyanarayanan, "PowerScope: A tool for profiling the energy usage of mobile applications," in Proceedings of the 2nd IEEE Workshop on Mobile Computing Systems and Applications, 1999.
2. Dongkun Shin, Hojun Shim, Yongsoo Joo, Han-Saem Yun, Jihong Kim, and Naehyuck Chang, "Energy-monitoring tool for low-power embedded programs," Design & Test of Computers, IEEE , Vol. 19, No. 4, pp. 7-17, Jul/Aug 2002.
3. W. Baek, Y. Kim, and J. Kim, "ePRO: A Tool for Energy and Performance Profiling for Embedded Applications," in Proceedings of International SoC Design Conference (ISOCC'04), pp. 372-375, Seoul, Korea, October 2004.
4. T. Stathopoulos, D. Mclntire, and W. J. Kaiser, "The Energy Endoscope: Real-Time Detailed Energy Accounting for Wireless Sensor Nodes," in Proceedings of the 7th International Conference on Information Processing in Sensor Networks (IPSN '08), pp. 383-394, 22-24 April 2008.
5. Changjiu Xian, Le Cai, and Yung-Hsiang Lu, "Power Measurement of Software Programs on Computers With Multiple I/O Components," IEEE Transactions on Instrumentation and Measurement, Vol. 56, pp. 2079-2086, 2007.
6. Songah Chae, Doo-Hyun Kim, Changhee Jung, Duk-Kyun Woo, andChaedeok Lim,“Experimental Analysis on
Time-Triggered Power Consumption Measurement with DVS-Enabled Multiple Power Domain Platform,” Software Technologies for Embedded and Ubiquitous Systems, Vol. 4761/2007, pp. 149-158, Springer Berlin / Heidelberg, 2007.
7. W. Ye, N. Vijaykrishnan, M. Kandemir, and M. J. Irwin, "The design and use of simplePower: A cycle-accurate energy estimation tool," in Proceedings of Design Automation Conference, pp. 340-345, 2000.
8. D. Brooks, V. Tiwari, and M. Martonosi, "Wattch: A framework for architectural-level power analysis and optimizations," in Proceedings of International Symposium Computer Architecture (ISCA'00), pp. 83-94, 2000. 9. S. Gurumurthi, A. Sivasubramaniam, M. J Irwin, N. Vijaykrishnan, and M. Kandemir, "Using complete machine
simulation for software power estimation: the SoftWatt approach," in Proceedings of the 8th International Symposium on High-Performance Computer Architecture (HPCA’02), pp. 141-150, 2-6 Feb. 2002.
10. V. Tiwari, S. Malik, and A. Wolfe, "Power analysis of embedded software: A first step towards software power minimization," IEEE Transactions on Very Large Scale Integration (VLSI) Systems, Vol. 2, Issue 4, pp. 437-445, Dec. 1994.
11. A. Sinha and A. P. Chandrakasan, "JouleTrack - A Web based tool for software energy profiling," in Proceedings of Design Automation Conference, pp. 220-225, 2001.
12. H. Blume, D. Becker, L. Rotenberg, M. Botteck, and J. Brakensiek, T. G. Noll, "Hybrid functional and instruction-level power modeling for embedded and heterogeneous processor architectures," Journal of Systems Architecture, Vol. 53, Issue 10, pp. 689–702, 2007.
13. “mac80211 Framework for Soft-MAC Wireless Devices”, http://wireless.kernel.org/ 14. “NI PCI-6115 DAQ Card”, http://sine.ni.com/nips/cds/view/p/lang/en/nid/11886 15. “FLUKE i30s 30 AC/DC Current Clamp”,
http://us.fluke.com/fluke/usen/Accessories/Current-Clamps/i30s.htm?PID=56297 16. “EPA-400 Programmable Attenuator”,
http://e-channel.com.tw/zencart/index.php?main_page=product_info&products_id=1175 17. “D-Link DIR-600 Wireless AP”, http://www.dlink.com/DIR-600
18. “NI PCI-GPIB Interface Card”, http://sine.ni.com/nips/cds/view/p/lang/en/nid/203786 19. “Microtime PreSOC with Create XScale-PXA270 Daughter Board”,
http://www.microtime.com.tw/English/PreSOC.htm
20. “D-Link DWL-G122 USB Wireless NIC - FW Version 3.0”, http://www.dlink.com/products/?pid=334
可供推廣之研發成果資料表 □ 可申請專利 ■ 可技術移轉 日期:99 年 06 月 26 日
國科會補助計畫
計畫名稱:嵌入式網路通訊裝置耗能評比基準與工具之研發 計畫主持人:曹孝櫟 計畫編號:NSC 98–222 –E–009–046– 學門領域:資訊技術/創作名稱
PowerMemo: 用於嵌入式行動終端裝置之耗能剖析工具發明人/創作人
曹孝櫟、Ilter Suat、游政錕技術說明
中文: 本計畫開發一套適用於嵌入式行動終端裝置之耗能剖析工具,其功 能在於提供軟體開發者很容易在一個模擬的無線網路環境中,剖析 與偵測其行動終端裝置上執行的各軟體所造成的耗電。使用者可在 本工具上宣告各種網路網路模擬環境以及行動終端之移動行為,同 時可以執行各種應用程式。本工具將分析出各個程式以及各程式片 段的耗電,基於這樣的工具將協助程式或系統設計者掌握耗電資訊 並對其開發系統進行耗能的最佳化設計。 英文:Our tool uses event-driven energy accounting approach introduced in previous works and contributes to those with a software controllable wireless environment. Software developers can make their products more energy and network aware by using the tool. It helps them emulate a real-life mobility scenario that their applications may encounter. At the same time, the tool profiles C-code-block level energy consumption of the applications to spot the “hot” code blocks. This gives them a broader view of the applications’ energy consumption and network behavior. The tool basically combines a profiler, power measurement hardware and signal attenuator with RF-shielded chamber for the controllable wireless environment.