Synthesis and Characterization of Rod-Coil Polymers Based on
Poly(ethylene oxide)s and Novel Luminescent Aromatic Cores
Hong-Cheu Lin,* Kuan-Wei Lee, Chien-Min Tsai, and Kung-Hwa Wei Department of Materials Science & Engineering, National Chiao Tung UniVersity, 1001 Ta Hsueh Road, Hsinchu, Taiwan 300, ROC
ReceiVed October 28, 2005; ReVised Manuscript ReceiVed April 4, 2006
ABSTRACT: A novel conjugated aromatic core containing direct-coupled fluorene, thiophene, and biphenyl groups via Suzuki coupling reaction was synthesized. The asymmetrical molecules contain two kinds of poly-(ethylene oxide)s (PEO, Mn ) 750 and 2000, n ) 17 and 44) on one side of the rigid cores. Asymmetrical FOC8PEO17and FOC16PEO17contain flexible PEO chains (n ) 17) displaying the smectic phases. However, FOC8PEO44and FOC16PEO44consisting of flexible PEO chains (n ) 44) exhibit two kinds of columnar phases, Colhand Colr. Besides, alkoxy groups with different lengths (-OC8H17and -OC16H33) on both sides of the rigid cores were used as another flexible chain to form symmetrical molecules. Symmetrical FOC8and FOC16exhibit the nematic and smectic mesophases, respectively. Optical textures (POM) and XRD patterns have confirmed the structure of the mesophases and the molecular arrangements. The photophysical characteristics of all luminescent compounds were studied by photoluminescence and UV-vis absorption. In addition, a series of double-layered PLED devices with the configuration of PVK:emitters(100:8 by weight)/TPBI/MgAg/Ag were fabricated and investigated.
Introduction
In recent years, the study of the polymeric light-emitting diode (PLED) and liquid crystalline (LC) materials is widely surveyed. Generally, a combination of rigid cores and flexible chains is required for LC molecules, and a conjugated rigid core is a necessary segment for PLED materials. Therefore, to merge LC with PLED properties, the conjugated aromatic rings are designed as the rigid cores. The development of self-assembled materials has received great attention due to their potential in the construction of well-defined supramolecular nanostructures. Rod-coil systems1,2consisting of rigid rod and flexible coil segments are excellent candidates for creating well-defined supramolecular structures through a process of spontaneous organization. Theoretical works in some literature3-5 have shown that various supramolecular structures such as nematic, smectic, and cylindrical phases dependon the relative volume fraction of blocks.
Stupp et al. reported on rod-coil copolymers consisting of an extended mesogenic rod block and a monodisperse polyiso-prene6or poly(isoprene-block-styrene)7coil blocks. These rod-coil copolymers self-assemble into ordered structures in terms of varying rod and coil volume fractions as monitored by transmission electron microscopy and electron tomography. These supramolecular structures were discovered to vary from lamellar to micellar microphase-separation. In addition to the above coils reported by Stupp, poly(ethylene oxide) and poly-(propylene oxide) as the flexible coils were used by Lee and co-workers.8,9Liquid-crystalline behavior of these kinds of rod-coil molecules is associated with the volume fraction of rod-coil segments. The mesophases changed from the nematic phase to the hexagonal columnar phase by increasing ethylene oxide units. A rigid rod and an elongated flexible coil connected by covalent linkage may result in new supramolecular structures because of the incompatible segregation ability of individual segments.
In recent publications, Stupp et al. also reported amphiphiles consisting of a well-defined oligo(p-phenylenevinylene) (OPV) trimer asymmetrically end-substituted with a hydrophobic alkyl chain and a hydrophilic poly(ethylene glycol) (PEG). They tuned the solubility and mesophase structure by controlling the length of the PEG block.10Besides the mesogenic rod block, Lee et al. also reported the luminescent rod-coil systems containing three biphenyl groups linked by double bonds11 or penta-p-phenylene12 as the conjugated rigid rods. So far, rod-coil diblock systems containing poly(ethylene oxide) coils and luminescent conjugated aromatic rods were only described in a few literatures. Therefore, in this paper we have synthesized a novel conjugated aromatic rod containing a fluorene core symmetrically connected by thiophene and biphenyl groups on both sides through single bonds to form a long luminescent rod. After then, poly(ethylene oxide) flexible parts with different lengths (PEO, n ) 17 and 44) were attached to one end of the luminescent core by ether linkage to form the luminescent rod-coil polymers. Besides, analogous derivative-containing sym-metric alkoxy flexible parts were synthesized and characterized. POM, DSC, and XRD data show that all investigated materials possess mesomorphism. Their PL and EL properties are also studied in this research.
Experimental Section
Materials. Chemicals and solvents were reagent grades and purchased from Aldrich, ARCROS, TCI, and Lancaster Chemical Co. Dichloromathane and THF were distilled to keep anhydrous before use. The other chemicals were used without further purifica-tion. Pyridine was dried by refluxing over calcium hydride.
Measurements. 1H NMR spectra were recorded on a Varian Unity 300 MHz spectrometer using CDCl3 solvent. Elemental analyses were performed on a HERAEUS CHN-OS RAPID elemental analyzer. Transition temperatures were determined by differential scanning calorimetry (Perkin-Elmer Pyris 7) with a heating and cooling rate of 10°C/min. Gel permeation chroma-tography (GPC) analysis was conducted on a Waters 1515 separa-tion module using polystyrene as a standard and THF as an eluant. UV-vis absorption spectra were recorded in dilute chloroform * Author for correspondence: Tel 5712121 ext 55305, Fax
8863-5724727, e-mail [email protected].
10.1021/ma052318n CCC: $33.50 © 2006 American Chemical Society Published on Web 05/06/2006
solutions (10-6 M) on a HPG1103A spectrophotometer, and fluorescence spectra were obtained on a Hitachi F-4500 spectro-photometer. Fluorescence quantum yields were determined by comparing the integrated PL density of a reference 9,10-diphenyl-anthracene in toluene with a known quantum yield (ca. 5× 10⁻⁵ M, quantum yield ) 1) and 9,10-DPA/PMMA film (quantum yield ) 0.83).24Cyclic voltammetry (CV) was performed at a scanning rate of 100 mV/s on a BAS 100 B/W electrochemical analyzer, which was equipped with a three-electrode cell. Pt wire was used as a counter electrode, and an Ag/AgCl was used as a reference electrode in the CV measurement. The concentrations of polymer solutions in dicholomethane were 10-2M as a working electrode with ferrocene as a standard in acetonitrile, and 0.1 M tetrabutyl-ammonium hexafluorophosphate (TBAPF6) was used as a support-ing electrolyte. The textures of mesophases were studied ussupport-ing a polarizing optical microscope (POM, model Leica DMLP) equipped with a hot stage.
A series of double-layer EL devices with the configuration of PVK:emitters(100:8 by weight)/TPBI(30 nm)/MgAg(50 nm)/Ag-(100 nm) were made by spin-coating the rod-coil diblock molecules blended with PVK onto indium-tin oxide (ITO) glass substrates. The solutions (30 mg/mL) of light-emitting materials in 1,2-dichloroethane were spin-coated on glass slides precoated with indium-tin oxide (ITO) with sheet resistances of∼20 Ω/sq and with an effective individual device area of 3.14 mm2. The ITO glasses were routinely cleaned by ultrasonic treatment in detergent solutions and diluted water, followed by through rinsing in acetone and then ethanol. After drying, the ITO glasses were kept in oxygen plasma for 3 min before being loaded into the vacuum chamber. The spin-coating rate was 3000 rpm for 40 s, and the thickness of the emitting layer was about 60 nm. One layer of magnesium and silver alloy (ca. 10:1, 50 nm) was deposited thermally as a cathode at a rate of 0.1-0.3 Å/s under a pressure of∼2 × 10⁻⁵Torr in an Ulvac Cryogenic deposition system, which was capped with 100 nm of silver. The current-voltage-luminescence properties were measured in ambient conditions with a Keithley 2400 Source meter and a Newport 1835C Optical meter equipped with an 818ST silicon photodiode.
Synthesis. The rigid cores of these aromatic conjugated mol-ecules containing fluorene, thiophene, and biphenyl groups con-nected by single bonds were synthesized via Suzuki coupling reaction.13,14The flexible chains were different alkoxy and poly-(ethylene oxide) groups (PEO, n ) 17 and 44). The synthetic route is shown in Scheme 1.
2,7-Dibromofluorene (2). Fluorene (8.3 g, 50 mmol) was dissolved in 80 mL of dry dichloromethane, and then bromide (5.1 mL, 100 mmol) was added to react. The reaction mixture was stirred at room temperature for 24 h, and a saturated aqueous sodium bisulfite solution was added to quench bromide. The solution was extracted with water and dichloromethane, the organic layer was dried over magnesium sulfate, and the solvent was removed by rotavapor. The compound was purified by recrystallization from hexane to yield white crystals (12.5 g, 77%). 1H NMR (ppm, CDCl3),δ: 3.84 (s, 2H), 7.48 (d, J ) 8.2 Hz, 2H), 7.58 (d, J ) 8.0 Hz, 2H), 7.64 (s, 2H).
2,7-Dibromo-9,9-diethylfluorene (3). A mixture of the com-pound 2 (12.5 g, 38.7 mmol) and potassium-tert-butoxide (13 g, 116 mmol) was dissolved in THF to reflux 1 h, and then ethyl bromide (7.2 mL, 96.9 mmol) was added dropwise and reacted for an additional 12 h. After reaction, THF was removed, the solution was extracted with diethyl ether and water, and the organic layer was dried over magnesium sulfate. The solvent was removed by rotavapor, and the crude product was purified by column chroma-tography (silica gel, hexane eluent) to yield a white solid (12.5 g, 85%).1H NMR (ppm, CDCl
3),δ: 0.29 (t, J ) 5.4 Hz, 6H), 2.07 (m, 4H), 7.42 (s, 2H), 7.44 (d, J ) 8.8 Hz, 2H), 7.51 (d, J ) 8.8H, 2 Hz).
2-Thioipheneboronic Acid (4). 2-Bromothiophene (10 g, 61.3 mmol) was treated with magnesium (1.72 g, 79.5 mmol) in 200 mL of dry THF under nitrogen. The reaction mixture was refluxed for 7 h to form Grignard reagent, and then the Grignard solution
was added dropwise to trimethyl borate solution (12.75 g, 122.7 mmol in 30 mL of dry THF) at -78°C. The mixture solution was allowed to warm to room temperature overnight. The final solution was acidified with 10% HCl solution (100 mL) and stirred for 2 h at room temperature. The solution was washed with saturated sodium carbonate solution and water, and then THF was removed. The crude product was extracted by diethyl ether, and the organic layer was dried over magnesium sulfate. After removing the solvent by rotavapor, the solid was recrystallized from ethyl acetate to obtain a white solid (4.72 g, 61%).1H NMR (ppm, d
6-DMSO): δ 7.15 (dd, J ) 4.8, 3.3 Hz, 1 H), 7.66 (d, J ) 3.3 Hz, 1 H), 7.72 (d, J ) 4.8 Hz, 1 H), 8.17 (s, 2 H).
2,7-Bis(thien-2-yl)-9,9-diethylfluorene (5). Compound 3 (5 g, 13.2 mmol), compound 4 (5.05 g, 39.4 mmol), and tetrakis-(triphenylphosphine)palladium(0) were reacted in DME (100 mL) for 10 min, and then 100 mL of 2 M aqueous Na2CO3 solution was added. The reaction mixture was refluxed for 48 h. The cooled solution was washed with dilute hydrochloric acid (10%) and water and dried over magnesium sulfate. The final solution was purified by column chromatography (silica gel, CH2Cl2/hexane 1:2) to yield a light green solid (4.2 g, 83%). 1H NMR (ppm, d
6-DMSO), δ: 0.26 (t, J ) 7.4 Hz, 6 H), 2.11 (q, J ) 7.4 Hz, 4 H), 7.15 (dd, J ) 5.1, 3.7 Hz, 2 H), 7.54 (d, J ) 5.1 Hz, 1 H), 7.55 (d, J ) 5.1 Hz, 1 H), 7.60 (d, J ) 3.7 Hz, 1 H), 7.61 (d, J ) 3.7 Hz, 1 H), 7.64 (d, J ) 7.8 Hz, 1 H), 7.64 (d, J ) 3.7 Hz, 1 H), 7.72 (s, 2 H), 7.84 (d, J ) 7.8 Hz, 2 H). 2,7-Bis(bromothien-2-yl)-9,9-diethylfluorene (6). N-Bromo-succinimide (2.5 g, 14.3 mmol, freshly purified by recrystallization from water) and compound 5 (2.4 g, 6.22 mmol) were stirred in chloroform (25 mL) and glacial acetic acid (25 mL). The solution was heated under reflux for 1 h and warmed to room temperature. Sequentially, the solution washed with water (100 mL), HCl (150 mL, 20%), and saturated aqueous sodium bisulfite solution and dried over magnesium sulfate. The final solution was purified by column chromatography (silica gel, CH2Cl2/hexane 1:1) to yield a light green solid (2.7 g, 80%).1H NMR (ppm, d
6-DMSO),δ: 0.24 (t, J ) 7.2 Hz, 6 H), 2.10 (q, J ) 7.2 Hz, 4 H), 7.27 (d, J ) 3.9 Hz, 2 H), 7.46 (d, J ) 3.9 Hz, 2 H), 7.58 (d, J ) 8.1 Hz, 2 H), 7.69 (s, 2 H), 7.85 (d, J ) 8.1 Hz, 2 H).
4-Bromo-4′-octoxybiphenyl. 1-Bromooctane (11.6 g, 60 mmol), 4-bromo-4′-hydroxybiphenyl (10 g, 40 mmol), and potassium carbonate (16.6 g, 120 mmol) were dissolved in butan-2-one (100 mL) and reacted under reflux for 24 h. After cooling to room temperature, the potassium salt was filtered off. The solvent was removed by a rotavapor, and the crude product was recrystallized from petroleum ether (bp 35-60°C) to yield a white solid (19.5 g, 54 mmol).15 1H NMR (ppm, CDCl
3),δ: 0.89 (t, J ) 6.9 Hz, 3H), 1.29-1.47 (m, 10 H), 1.80 (quintet, J ) 6.6 Hz, 2H), 3.98 (t, J ) 6.6 Hz, 2 H), 6.99 (d, J ) 6.9 Hz, 2H), 7.40-7.54 (m, 6H). 4′-Octoxybiphenyl-4-ylboronic Acid (7). 4-Bromo-4′ -octoxy-biphenyl (10 g, 28 mmol) was treated with magnesium (1.0 g, 42 mmol) in 250 mL of dry THF under nitrogen. The reaction mixture was refluxed for 10 h to form the Grignard reagent, and then it was added dropwise to trimethyl borate solution (8.6 g, 83 mmol) at -78 °C. The mixture solution was allowed to cool to room temperature overnight. The final solution was acidified with 10 % HCl solution (100 mL) and stirred for 45 min at room temperature. The solution was washed with saturated sodium carbonate solution and water, and then THF was removed. The crude product was extracted by diethyl ether, and the organic layer was dried over magnesium sulfate. After removing the solvent by rotavapor, the resulting solid was washed with petroleum ether and briefly dried on filter to obtain a white solid (5.2 g, 54%).1H NMR (ppm, d
6 -DMSO),δ: 0.85 (t, J ) 7.2 Hz, 3 H), 1.24-1.41 (m, 10 H), 1.71 (quintet, J ) 6.6 Hz, 2H), 3.98 (t, J ) 6.6 Hz, 2 H), 6.99 (d, J ) 6.9 Hz, 2 H), 7.56-7.62 (m, 4 H), 7.83 (d, J ) 6.3 Hz, 2 H), 8.03 (s, 2 H).15
FOC8(8). Compound 6 (2.7 g, 5.0 mmol), 4′ -octoxybiphenyl-4-ylboronic acid (7) (4.0 g, 12.2 mmol), and tetrakis(triphenylphos-phine)palladium(0) were reacted in THF (180 mL) for 10 min, and then 100 mL of 2 M aqueous Na2CO3solution was added. The
reaction mixture was refluxed for 48 h. The cooled solution was washed with dilute hydrochloric acid (10%) and water and dried over magnesium sulfate. The final solution was purified by column chromatography (silica gel, CH2Cl2) to yield a yellow-green solid (2.9 g, 62%).1H NMR (ppm,CDCl
3),δ: 0.40 (t, J ) 7.3 Hz, 6 H), 1.24-1.47 (m, 30 H), 2.11 (q, J ) 7.3 Hz, 4 H), 3.99 (t, J ) 6.6 Hz, 4 H), 6.97 (d, J ) 8.7 Hz, 4 H), 7.33 (d, J ) 3.9 Hz, 2 H), 7.36 (d, J ) 3.9 Hz, 2 H), 7.53-7.71 (m, 18 H). Element analysis
for C65H70O2S2 : Calcd C, 82.41; H, 7.45. Found C, 82.35; H, 7.42%. LRMS (FAB+) Calcd 946.5; Found 946.5.
FOH (9). FOC8 (8) (2.6 g, 2.7 mmol) was dissolved in dry chloroform (100 mL) under nitrogen, and then boron tribromide (2.1 g, 8.2 mmol) was added dropwise and reacted at -78°C. The mixture was allowed to warm to room temperature and reacted for 24 h. The solution was washed with sodium hydroxide (1 M, 50 mL) to basification. Then, the solution was acidified with 10% HCl
and stirred for 4 h. Finally, the suspension was filtered off and purified by column chromatography (silica gel, ethyl acetate) to yield a green solid (1.5 g, 76%).1H NMR (ppm, d
6-DMSO),δ: 0.29 (t, J ) 7.2 Hz, 6 H), 2.16 (q, J ) 7.2 Hz, 4 H), 6.86 (d, J ) 8.8 Hz, 4 H), 7.55 (d, J ) 8.8 Hz, 4 H), 7.60 (d, J ) 3.9 Hz, 2 H), 7.64-7.78 (m, 14 H), 7.87 (d, J ) 8.1 Hz, 2 H), 9.60 (s, 2 H).
FOC16(10), FOHOC8(11), and FOHOC16(12). Compounds 10-12 were synthesized using the same procedure, so a representa-tive example is described for FOC16(10). FOH (9) (300 mg, 0.41 mmol) and potassium carbonate (115 mg, 0.83 mmol) were dissolved in DMF (20 mL), and then 1-bromohexadecane (218 mg, 0.87 mmol) was added in solution to react for 24 h by reflux. After cooling to room temperature, the solution was extracted with dichloromethane and water, and the organic layer was dried over magnesium sulfate. The final solution was purified by column chromatography (silica gel, CH2Cl2) to yield a yellow-green solid (312 mg, 71%).1H NMR (ppm, CDCl
3),δ: 0.40 (t, J ) 7.3 Hz, 6 H), 1.21-1.48 (m, 62 H), 2.11 (q, J ) 7.3 Hz, 4 H), 3.99 (t, J ) 6.6 Hz, 4 H), 6.97 (d, J ) 8.7 Hz, 4 H), 7.33 (d, J ) 3.6 Hz, 2 H), 7.37 (d, J ) 3.6 Hz, 2 H), 7.53-7.71 (m, 18 H). Element analysis for C81H102O2S2: Calcd C, 83.02; H, 8.77. Found C, 82.77; H, 8.53%. LRMS (FAB+) Calcd 1171.7; Found 1171.7.
FOHOC8 (11). Yield: 50%.1H NMR (ppm, CDCl3),δ: 0.40 (t, J ) 7.0 Hz, 6H), 0.87 (t, J ) 6.6 Hz, 3H), 1.28-1.42 (m, 10 H), 1.79 (m, J ) 6.9 Hz, 2 H), 2.11 (q, J ) 7.2 Hz, 4 H), 3.99 (t, J ) 6.2 Hz, 2 H), 4.90 (s, 1 H), 6.89-6.98 (m, 4 H), 7.33-7.36 (m, 4 H), 7.50-7.70 (m, 18 H). Element analysis for C57H54O2S2 : Calcd C, 81.97; H, 6.52. Found C, 81.76; H, 6.78%.
FOHOC16(12). Yield: 43%.1H NMR (ppm, CDCl3),δ: 0.40 (t, J ) 7.5 Hz, 6 Hz), 0.87 (t, J ) 6.6 Hz, 3 H), 1.25-1.46 (m, 26 H), 1.80 (m, J ) 7.5 Hz, 2 H), 2.11 (q, J ) 7.5 Hz, 4 H), 3.99 (t, J ) 6.6 Hz, 2 H), 4.80 (s, 1 H), 6.90-6.98 (m, 4 H), 7.33-7.37 (m, 4 H), 7.50-7.70 (m, 18 H). Element analysis for C65H70O2S2 : Calcd C, 82.41; H, 7.45. Found C, 82.1; H, 7.75%.
Methyloxypoly(ethyleneoxy)ethyl Tosylate (15, 16). Poly-(ethylene oxide) monomethyl ether (n ) 17, 5 g, 6.6 mmol) (15) was dissolved in dry pyridine (5 mL) under nitrogen, and then a solution of toluene-p-sulfonyl chloride (1.4 g, 7.3 mmol) in 5 mL of dry pyridine was added to the mixture. The mixture was reacted at room temperature under nitrogen for 24 h. The resulting solution was washed with water and extracted with dichloromethane. The solution of dichloromethane was dried over magnesium sulfate. The solvent was removed by a rotavapor, and the crude product was purified by column chromatography (silica gel, ethyl acetate) to obtain a colorless liquid (4.8 g, 80%).1H NMR (ppm, CDCl
3),δ: 2.37 (s, 3 H), 3.38 (s, 3 H), 3.50-4.07 (m, 68H), 7.31 (d, J ) 8.0 Hz, 2H), 7.77 (d, J ) 8.0 Hz, 2H).
Poly(ethylene oxide) Monomethyl Ether (n ) 44) (16). Yield: 66%.1H NMR (ppm, CDCl
3), δ: 2.31 (s, 3H), 3.37 (s, 3H), 3.54-4.02 (m, 176H), 7.11 (d, Ar-H, J ) 7.8 Hz, 2H), 7.74 (d, Ar-H, J ) 8.1 Hz, 2H).
Polymers. FOC8PEO17(17), FOC16PEO17(18), FOC8PEO44 (19), and FOC16PEO44(20). Polymers 17-20 were synthesized using the same procedure, so a representative example is described for FOC8PEO17 (17). FOHOC8 (11) (150 mg, 0.18 mmol), potassium carbonate (75 mg, 0.53 mmol), and methyloxypoly-(ethyleneoxy)ethyl tosylate (15) (244 mg, 0.27 mmol) were refluxed in DMF for 24 h. After cooling to room temperature, the solution was extracted with dichloromethane and water, and the organic layer was dried over magnesium sulfate. The final solution was purified
by column chromatography (silica gel, CH2Cl2/methanol 5:1) to obtain FOC8PEO17(17) (yellow solid, 126 mg, 45%).1H NMR (ppm, CDCl3),δ: 0.39 (t, J ) 7.5 Hz, 6H), 0.87 (t, J ) 6.6 Hz, 3H), 1.27-1.46 (m, 10 H), 1.77 (m, J ) 6.9 Hz, 2 H), 2.10 (q, J ) 7.5 Hz, 4 H), 3.39 (s, 3 H), 3.51-3.75 (m, 64 H), 3.87 (t, J ) 5.1 Hz, 2H), 3.99 (t, J ) 6.6 Hz, 2H), 4.17 (t, J ) 5.1 Hz, 2H), 6.95-7.00 (m, 4H), 7.33-7.37 (m, 4H), 7.53-7.71 (m, 18H). LRMS (FAB+) Calcd 1552.8. Found 1552.8. Polydispersity index (PDI) ) 1.09.
FOC16PEO17(18). Yield: 34%.1H NMR (ppm, CDCl3),δ: 0.40 (t, J ) 7.2 Hz, 6H), 0.87 (t, J ) 6.6 Hz, 3H), 1.28-1.44 (m, 26 H), 1.78 (m, J ) 6.9 Hz, 2H), 2.11 (q, J ) 7.5 Hz, 4H), 3.39 (s, 3H), 3.50-3.75 (m, 64H), 3.86 (t, J ) 5.1 Hz, 2H), 3.99 (t, J ) 6.6 Hz,2H), 4.17 (t, J ) 5.1 Hz,2H), 6.95-7.00 (m, 4 H), 7.33-7.37 (m, 4 H), 7.53-7.71 (m, 18 H). LRMS (FAB+) Calcd 1664.9. Found 1665.0. Polydispersity index (PDI) ) 1.09.
FOC8PEO44(19). Yield: 41%.1H NMR (ppm, CDCl3),δ: 0.41 (t, J ) 7.5 Hz, 6H), 0.85 (t, J ) 6.6 Hz, 3H), 1.23-1.46 (m, 10 H), 1.77 (m, J ) 7.5 Hz, 2H), 2.12 (q, J ) 7.5 Hz, 4H), 3.36 (s, 3H), 3.52-3.71 (m, 172 H), 3.87 (t, J ) 4.7 Hz, 2H), 3.99 (t, J ) 6.6 Hz, 2H), 4.17 (t, J ) 5.1 Hz, 2H), 6.95-7.00 (m, 4H), 7.34-7.37 (m, 4H), 7.53-7.71 (m, 18H). LRMS (FAB+) Calcd 2785.5. Found 2785.5. Polydispersity index (PDI) ) 1.10.
FOC16PEO44(20). Yield: 35%.1H NMR (ppm, CDCl3),δ: 0.39 (t, J ) 7.5 Hz, 6H), 0.86 (t, J ) 6.9 Hz, 3H), 1.25-1.46 (m, 26H), 1.79 (m, J ) 7.5 Hz, 2H), 2.12 (q, J ) 7.2 Hz, 4H), 3.36 (s, 3H), 3.51-3.75 (m, 172 H), 3.87 (t, J ) 4.8 Hz, 2H), 3.99 (t, J ) 6.6 Hz, 2H), 4.17 (t, J ) 4.8 Hz, 2H), 6.95-7.00 (m, 4H), 7.33-7.37 (m, 4H), 7.53-7.71 (m, 18 H). LRMS (FAB+) Calcd 2897.6. Found 2897.6. Polydispersity index (PDI) ) 1.09.
Results and Discussion
Thermal Properties. A series of conjugated aromatic molecules containing fluorene, thiophene, and biphenyl groups were synthesized successfully via Suzuki coupling reaction. These aromatic rings were connected by single bonds and alkoxy groups with different lengths (-OC8H17and -OC16H33) were attached to the conjugated cores either on both sides or on one side of the molecules to form symmetrical and asymmetrical structures (as shown in Scheme 1), respectively. The analogous derivatives containing alkoxy chains on both sides of the rigid cores are symmetrical molecules. Besides these alkoxy groups, two kinds of commercially available poly(ethylene oxide) monomethyl ethers (n ) 17 and 44) were used as the other flexible chains to form rod-coil asymmetrical molecules.
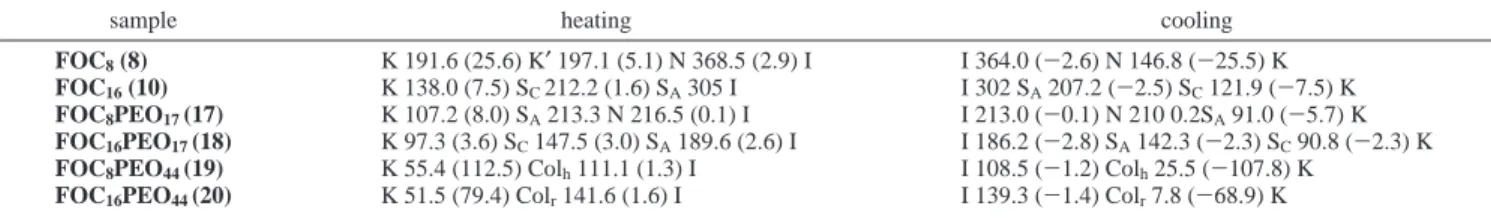
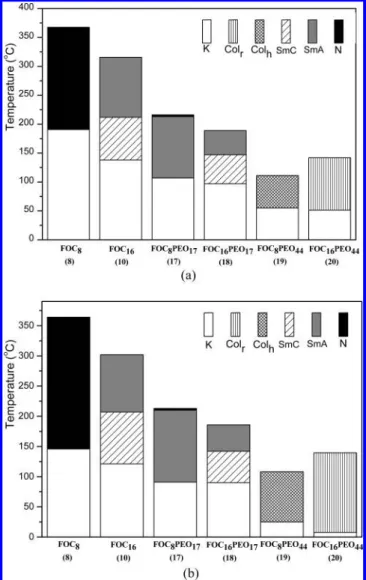
As previous literature showed that the phase behaviors of polymers, especially those with low molecular weights, were influenced by polydispersity.16Therefore, highly monodisperse polymers are important to investigate the representative phase behavior of rod-coil polymers. The rod-coil asymmetrical molecules containing poly(ethylene oxide) monomethyl esters as flexible chains showed polydispersity indexes (PDI) around 1.1, which were determined by GPC. The phase transition temperatures and enthalpies of all compounds were obtained from DSC traces (the second heating and first cooling scans) and summarized in Table 1. In addition, the phase diagrams of mesophases (during heating and cooling scans) are presented
Table 1. Phase Behavior of Synthesized Moleculesa,b
sample heating cooling
FOC8(8) K 191.6 (25.6) K′197.1 (5.1) N 368.5 (2.9) I I 364.0 (-2.6) N 146.8 (-25.5) K
FOC16(10) K 138.0 (7.5) SC212.2 (1.6) SA305 I I 302 SA207.2 (-2.5) SC121.9 (-7.5) K
FOC8PEO17(17) K 107.2 (8.0) SA213.3 N 216.5 (0.1) I I 213.0 (-0.1) N 210 0.2SA91.0 (-5.7) K
FOC16PEO17(18) K 97.3 (3.6) SC147.5 (3.0) SA189.6 (2.6) I I 186.2 (-2.8) SA142.3 (-2.3) SC90.8 (-2.3) K
FOC8PEO44(19) K 55.4 (112.5) Colh111.1 (1.3) I I 108.5 (-1.2) Colh25.5 (-107.8) K
FOC16PEO44(20) K 51.5 (79.4) Colr141.6 (1.6) I I 139.3 (-1.4) Colr7.8 (-68.9) K
aTransition temperatures (°C) and enthalpies (in parentheses, kJ/mol) were determined by DSC (heating and cooling rate of 10°C/min).bK ) crystalline;
in Figure 1. Figure 2 shows that various characteristic textures of all corresponding mesophases observed by POM.
For symmetrical molecules, FOC8 and FOC16 exhibit the
nematic and the smectic mesophases, respectively, which match the trends that the smectic phases are preferred in LC structures possessing longer flexible lengths. It is known that extending alkoxy chain length leads to the increasing lateral intermolecular interaction of flexible parts and the decreasing longitudinal interaction of rigid rods.17 As a result, FOC
16 exhibits the
smectic A and smectic C phases instead of the nematic phase in FOC8(see Table 1 and Figure 1). In the case of asymmetrical
rod-coil molecules containing poly(ethylene oxide) chains of n ) 17, both FOC8PEO17and FOC16PEO17display the smectic
phases (see Table 1 and Figure 1), but FOC8PEO17reveals a
short range of the nematic phase at high temperatures due to the shorter flexible octanoxy chain. Nevertheless, as temperature decreases, the immiscibility between the hydrophilic flexible chains and the hydrophobic rods leads to stronger lateral interaction of rigid rods and induces the smectic phases. By increasing the hydrophilic ethylene oxide units, the immiscibility increases and microphase separation is enhanced to form more order columnar phases. For instance, FOC8PEO44and FOC16
-PEO44 consisting of poly(ethylene oxide) of n ) 44 exhibit
two kinds of columnar phases, Colhand Colr(see Table 1 and Figure 1). The characterization of the columnar phases (i.e., Colhand Colr.) is identified by POM, as shown in Figure 2d,e,
and can be further confirmed by X-ray diffraction (XRD) measurements. It is not unusual for FOC8PEO44and FOC16
-PEO44 to form highly order columnar phases because
mi-crophase separation between stiff rod and flexible coil segments occurs as the number of ethylene oxide units increases.
In general, the melting temperatures (Tm) decrease with increasing the lengths of flexible chains, i.e., alkoxy chains in symmetrical molecules and ethylene oxide units in asymmetrical molecules. Besides, the trend of the isotropization temperature (Ti) is similar to that of Tm. In terms of symmetrical molecules, FOC8 and FOC16, they have lower viscosity at mesophasic
temperatures and thus have well-organized mesomorphic tex-tures, i.e., the nematic, smectic A, and smectic C phases shown in Figure 2a-c, owing to their lower molecular weights compared with analogous rod-coil compounds. Because of the higher flexibility of ethylene oxide units, rod-coil polymers possess lower transition temperatures of Tmand Tithan their corresponding symmetrical molecules. Accordingly, the transi-tion temperatures and the nature of the mesophases of rod-coil molecules are dependent on the lengths of the flexible chains in alkoxy and poly(ethylene oxide) units.
X-ray Investigation. To elucidate the structure of the mesophases, X-ray diffraction (XRD) measurements were carried out at the temperature ranges of mesophases for compounds FOC16, FOC8PEO17, FOC8PEO44, and FOC16
-PEO44. As shown in Figure 3a, the XRD patterns of FOC16
indicate the layer d spacing at 175 and 115 °C are 6.03 and 4.28 nm, respectively. In addition, the layer d spacing values in the ratio of 1:1/2 indicate a lamellar order exits in the mesophases. With regard to the fully extended molecular length (L) of 5.91 nm by the molecular modeling calculation, it suggests that the d spacing value of 6.03 nm corresponds to the monolayer SmA phase of FOC16at 175°C. Upon cooling to
115°C, the layer d spacing, i.e., 4.28 nm, is shorter than the theoretical molecular length (L ) 5.91 nm), so it implies a tilted SmC phase with a tilt angle of 43°(byθ calculation of d ) L cos θ) to the layer normal.18 In Figure 3b, FOC
8PEO17
possessing the layer d spacing, 7.50 nm (L ) 7.60 nm by the molecular modeling calculation), obtained from the XRD pattern, also shows the monolayer SmA phase, which is longer than that of FOC16due to the longer flexible chains of
poly-(ethylene oxide) with n ) 17 than those of alkoxy chains. As shown in the middle pattern of Figure 3b, compound FOC8PEO44in the mesophase displays reflection peaks at d1 ) 10.47 nm, d2) 6.04 nm, and d3 ) 5.49 nm in the small angle region; the ratio of the d-layer spacing values is about 1:(1/3)1/2:(1/2), and the lattice parameter calculates for a ) 12.09 nm. Furthermore, a typical pseudo-focal-conic texture was clearly observed by POM, as shown in Figure 2d, which is the characteristic of the hexagonal columnar phase (Colh). On the top XRD pattern of Figure 3b, the small angle region of FOC16PEO44exhibits strong coupling twin peaks (at d1) 7.82 nm and d2) 6.93 nm) along with a weaker peak (at d3) 5.13 nm), which correspond to the rectangular lattice constants: a ) 15.64 nm and b ) 7.75 nm. This type of diffraction pattern with two stronger peaks or one additional weaker peak at small angles corresponds to the rectangular columnar arrangement (Colr).19-21Besides the evidence of the XRD data, the mosaic texture of FOC16PEO44in Figure 2e supported by POM can
be recognized as the rectangular columnar phase (Colr). In the Supporting Information of XRD patterns, crystalline peaks in the wide angle regions were observed in both FOC16
and FOC8PEO17at room temperature. Thus, partial crystallinity
was occurred in both FOC16and FOC8PEO17 at room
tem-Figure 1. Phase diagrams of mesophases in all materials upon (a)
perature. The peaks of FOC16in the small angle region were
shifted to larger values. However, compared with FOC16, the
peaks of FOC8PEO17in the small angle region were almost
sustained at the same position. Thus, at room temperature, the d spacing value in the layer structure of FOC16did shrink, but
that of FOC8PEO17did not change. FOC8PEO44and FOC16
-PEO44consisting of longer poly(ethylene oxide) chains have
lower crystalline temperatures at 25 and 8°C (by DSC data), respectively. Therefore, FOC8PEO44and FOC16PEO44are still
in the temperature range of mesophase and have almost the same XRD patterns at room temperature as that shown in Figure 3b. Hence, it suggests that the molecular packing can be easily maintained at room temperature due to the flexible chains of poly(ethylene oxide)s in asymmetrical rod-coil molecules. Therefore, in addition to the characteristic textures of meso-phases observed by POM, the types of the mesomeso-phases and the molecular arrangements can be further proved and analyzed by
the results of XRD measurements, which are strongly dependent on the lengths of the flexible alkoxy and poly(ethylene oxide) units.
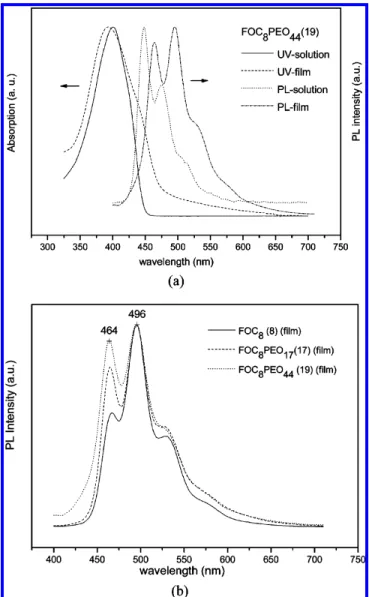
Photoluminescenct (PL) and Electroluminescent (EL) Properties. The photophysical properties of all luminescent compounds were studied by photoluminescence (PL) and UV-vis absorption spectra in dilute chloroform solutions and thin films. The optical properties of all compounds are summarized in Table 2. Because of the identical rigid cores, all synthesized materials in solutions have almost the same maximum absorp-tion wavelength around 400 nm in soluabsorp-tions and 390 nm in solid films. Similar to the absorption spectra, the maximum PL wavelengths of all compounds are around 448 nm in solutions and 496 nm in films, respectively. Compared with the maximum PL wavelength in solutions, the materials in thin films exhibit red-shifted PL emission owing to theπ-π* aggregation of the rigid cores. Comparing UV-vis absorption spectra of
asym-Figure 2. Optical textures of the mesophases observed by POM: (a) nematic phase in FOC8(8) at 280°C (cooling); (b) SmA phase in FOC8PEO17
(17) at 200°C (heating); (c) SmC phase in FOC16(10) at 175°C (cooling); (d) Colhphase in FOC8PEO44(19) at 115°C (cooling); (e) Colrphase
metrical rod-coil molecule FOC8PEO17(PEO, n ) 44) in solid
and solution states, the maximum absorption wavelength in solid state (390 nm) is more blue-shifted than in solution (400 nm), which might be due to different conformations in solid and solution states to induce distinct conjugation lengths and shifted λmax,Abs. In terms of the onset wavelengths (λonset,Abs) of UV-vis absorption spectra, the value ofλonset,Absis around 469 nm in solid films and 446 nm in solutions. Therefore, the optical band gaps (calculated by the equation Eonset) 1240/λ
onset) in
solid films are smaller than those in solutions, which is because of theπ-π* aggregation of the rigid cores in solids. Figure 4a shows an example of the UV-vis and PL spectra of the rod-coil molecule, FOC8PEO44. In Figure 4b, the influences of the
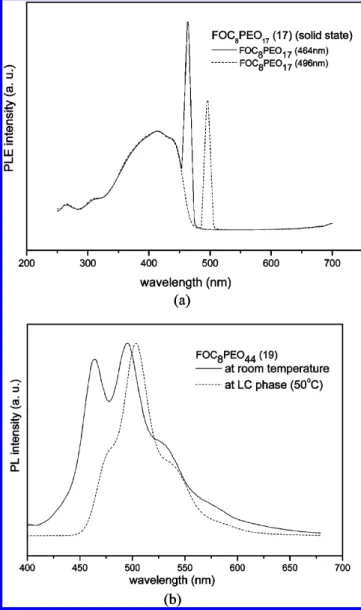
flexible chain lengths in PL spectra are compared. It shows that the intensity of the shorter wavelength peak at 464 nm grows as the flexible chains increase because the flexible chains of poly(ethylene oxide)s seem to be as solid solvents to insulate the intermolecular aggregation. Moreover, to realize the relation between two peaks at 464 and 496 nm, Figure 5a shows the normalized photoluminescence excitation (PLE) spectra of FOC8PEO17in the same film monitored the emissions at 464
and 496 nm. The patterns of PLE spectra monitored at 464 and 496 nm almost coincide with each other. This result demon-strates that the shorter wavelength peak at 464 nm is a vibronic peak rather than the nonaggregated molecular emission. The addition of flexible PEO chains in the polymers changes the state of the molecular aggregation which leads to the change of the emission energy distribution in PL spectra. Therefore, the two peaks in PL spectra at 464 and 496 nm are the nature emissions of the polymers rather than the coexistence of aggregated and nonaggregated emissions. Besides the insulation of flexible PEO chains, we believe that bulky PEO chains would influence the conformation of the rigid backbones.22For these reasons, we can predict that the peak at 464 nm will continue Figure 3. X-ray diffraction data: (a) SmA (170°C) and SmC (120
°C) phases of FOC16(10); (b) SmA (120°C) phase of FOC8PEO17 (17), Colh(50°C) phase of FOC8PEO44(19), and Colr(30°C) phase of FOC16PEO44(20).
Table 2. Absorption and Photoluminescence Spectral Data of Synthesized Molecules
absorption λmax(nm)
PL emission λmax(nm)
sample solutiona film solutiona film (solution)Φ b (film)Φ c
FOC8(8) 401 382 447 496 0.69 0.36 FOC16(10) 400 382 448 498 0.70 0.38 FOC8PEO17(17) 400 387 448 496 0.71 0.43 FOC16PEO17(18) 400 386 448 497 0.70 0.42 FOC8PEO44(19) 400 393 448 496 0.72 0.47 FOC16PEO44(20) 401 390 448 497 0.71 0.47
aAbsorption and PL emission spectra were recorded in dilute CHCl
3
solutions at room temperature.bPL quantum yield in CHCl
3 and
9,10-diphenylanthrance is the reference of quantum yield.cSolid film of 9,10-diphenylanthrance blended in PMMA is the reference of quantum yield.
Figure 4. (a) Absorption and PL spectra of FOC8PEO44 (19) in
solutions (CHCl3as solvent) and films. (b) PL spectra of films of materials contain different flexible chains.
to grow and the peak at 496 nm to decrease as the PEO length is increased. Furthermore, this prediction might be proved by the EL spectra of our PLED devices (the emitters were doped in PVK) in Figure 6a. The EL spectra show that the maximum EL wavelengths of analogous compounds (doped in PVK) are around 462 nm, which correspond to the dilution effect of PVK, and it is similar to the growing trend of PL emission peaks at 464 nm by extending flexible chain lengths of PEO in Figure 4b. Figure 5b displays the PL spectra of FOC8PEO44in the
solid state at room temperature and in the Colhphase at 50°C. At mesomorphic temperature, the asymmetrical rod-coil mol-ecule FOC8PEO44, was self-assembled to the highly ordered
Colhphase, and it led to aggregation of rigid cores. Hence, the PL spectra in solid state were red-shifted and the shorter wavelength peak at 464 nm became a shoulder.
To fit the energy band structures of PLED devices, it is necessary to determine the energy levels of the highest occupied molecular orbital (HOMO) and the lowest unoccupied molecular orbital (LUMO) in each component, which were carried out by CV measurements to investigate the redox behavior of the molecules in solutions (CH2Cl2as solvent). The potential values estimated here were based on the reference energy level of ferrocene (4.8 eV below the vacuum level) according to the
following equation:23EHOMO/ELUMO) [-(Eonset- 0.45) - 4.8] eV. The onset potentials were determined from the intersection of two tangents drawn at the rising and background currents of the cyclic voltammogram. A crude estimation of the LUMO levels of reduction compounds was deduced from the HOMO values and the optical band gaps. The HOMO and LUMO energies are summarized in Table 4. As expected, HOMO and LUMO energies are almost similar on account of the identical rigid cores.
Because of the poor film quality of the synthesized molecules, the emitters were doped into PVK to fabricate PLED devices. A series of double-layered EL devices with the configuration of PVK:emitters(100:8 by weight)/TPBI(30 nm)/MgAg(50 nm)/ Ag(100 nm) were made by spin-coating of PVK blended with the synthesized emitters (100:8 by weight) onto indium-tin oxide (ITO) glass substrates, and their EL data are demonstrated in Table 4. In Figure 5a, It is reasonable to expect that the Figure 5. (a) PLE spectra of FOC8PEO17(17) in solid state monitored
at 464 and 496 nm, respectively (normalized at 412 nm). (b) PL spectra of FOC8PEO44(19) in solid state at room temperature and at 50°C
(Colhphase).
Figure 6. (a) Normalized EL spectra of PLED devices,
PVK:emitters-(100:8 by weight)/TPBI(30 nm)/MgAg(50 nm)/Ag(100 nm). (b) Current-voltage and luminescence-voltage characteristics of the PLED device, PVK:FOC8(100:8 by weight)/TPBI (30 nm)/MgAg (50 nm)/
Ag (100 nm).
Table 3. HOMO and LUMO Energies and Electrochemical Properties sample Eox/onset (eV) EHOMO (eV)a ELUMO (eV)b Eopt (eV)c FOC8(8) 0.83 -5.49 -2.71 2.78 FOC8PEO17(17) 0.83 -5.5 -2.72 2.78 FOC8PEO44(20) 0.81 -5.48 -2.7 2.78
aHOMO energies were obtained from the cyclic voltammetry.bLUMO energies were deduced from HOMO values and optical band gaps.cOptical band gaps were obtained from the UV-vis spectra.
maximum EL wavelengths were around 462 nm, where the PLED devices were not optimized, because the emitters were doped into PVK, which behaved as a solid solvent. The current-voltage and luminescence-current-voltage, i.e., EL response, curves of one typical PLED device (PVK:FOC8(100:8 by weight)/
TPBI/MgAg/Ag) is displayed in Figure 5b. All these devices show turn-on voltages for current and turn-on voltages for light from 8 to 10 V, and their attainable maximum luminances are from 1045 to 2871 cd/m2.
Conclusion
A novel conjugated aromatic core containing direct-coupled fluorene, thiophene, and biphenyl groups via Suzuki coupling reaction was synthesized in this study. The rigid hydrophobic core was combined with two different lengths of poly(ethylene oxide)s as hydrophilic flexible chains. It is interesting that the increasing flexible chains lead to different mesophases (and molecular arrangements) and decrease the phase transition temperatures of Tm and Ti. The XRD patterns and optical textures by POM have proved their mesophasic structures and molecular arrangements. Besides mesophasic properties, the PL and EL properties of all rod-coil polymers and analogous derivatives are also investigated. Though all materials have almost the same maximum absorption and PL wavelengths originated from their identical rigid cores, the quantum yields of the solid films can be adjusted as the flexible chains are extended due to lessπ-π* aggregation separated by the bulky flexible poly(ethylene oxide) chains.
Acknowledgment. The powder XRD measurements are supplied by beamline BL17A (charged by Dr. Jey-Jau Lee) of the National Synchrotron Radiation Research Center (NSRRC), in Taiwan. The instruments of GPC and CV measurements are provided by Prof. Ching-Fong Shu (Department of Applied Chemistry, National Chiao Tung University). The financial support offered by the National Science Council of Taiwan (ROC) through NSC 93-2113-M-009-011 and NSC 94-2120-M-009-001 is acknowledged for this project.
Supporting Information Available: XRD patterns of sym-metrical FOC16 and asymmetrical rod-coil FOC8PEO17. This material is available free of charge via the Internet at http:// pubs.acs.org.
References and Notes
(1) Klock, H.-A.; Lecommandoux, S. AdV. Mater. 2001, 13, 1217. (2) Lee, M.; Cho, B.-K.; Zin, W. C. Chem. ReV. 2001, 101, 3869. (3) Halperin, A. Macromolecules 1990, 23, 2724.
(4) Semenov, A. N. Mol. Cryst. Liq. Cryst. 1991, 209, 191.
(5) Williams, D. R. M.; Fredrikcson, G. H. Macromolecules 1992, 25, 3561.
(6) (a) Radzilowski, L. H.; Wu, J. L.; Stupp, S. I. Macromolecules 1993, 26, 879. (b) Radzilowski, L. H.; Stupp, S. I. Macromolecules 1994, 27, 7747. (c) Radzilowski, L. H.; Carragher, B. O.; Stupp, S. I. Macromolecules 1997, 30, 2110.
(7) (a) Stupp, S. I.; Lebonheur, V.; Walker, K.; Li, L. S.; Huggins, K. E.; Keser, M.; Amstutz, A. Science 1997, 276, 384. (b) Tew, G. N.; Pralle, M. U.; Stupp, S. I. J. Am. Chem. Soc. 1999, 121, 9852. (c) Pralle, M. U.; Whitaker, C. M.; Braun, P. V.; Stupp, S. I. Macromolecules 2000, 33, 3550.
(8) (a) Lee, M.; Oh, N. K. J. Mater. Chem. 1996, 6, 1076. (b) Lee, M.; Oh, N. K.; Lee, H. K.; Zin, W. C. Macromolecules 1996, 29, 5567.
(9) (a) Lee, M.; Cho, B. K.; Kim, H.; Yoon, J. Y.; Zin, W. C. J. Am. Chem. Soc. 1998, 120, 9168. (b) Lee, M.; Cho, B. K. J. Am. Chem. Soc. 2001, 123, 9677.
(10) Hulvat, J. F.; Sofos, M.; Tajima, K.; Stupp, S. I. J. Am. Chem. Soc.
2005, 127, 366.
(11) (a) Lee, M.; Kim, J. W.; Hwang, I. W.; Kim. Y. R.; Oh, N. K.; Zin, W. C. AdV. Mater. 2001, 13, 1363. (b) Lee, M.; Jeong, Y. S.; Cho, B. K.; Oh, N. K.; Zin, W. C. Chem.sEur. J. 2002, 8, 876.
(12) (a) Lee, M.; Park, M. H.; Oh, N. K.; Zin, W. C.; Jung, H. T.; Yoon, D. K. Angew. Chem., Int. Ed. 2004, 43, 6466. (b) Lee, M.; Jang, C. J.; Ryu, J. H. J. Am. Chem. Soc. 2004, 126, 8082.
(13) Miyaura, M.; Suzuki, A. Chem. ReV. 1995, 95, 2457.
(14) Dingemans, T. J.; Murthy, N. S.; Samulski, E. T. J. Phys. Chem. B
2001, 105, 8845.
(15) Kiryanov, A. A.; Sampson, K. S.; Seed, A. J. J. Mater. Chem. 2001, 11, 3068.
(16) Percec, V.; Lee, M. Macromolecules 1991, 24, 1017.
(17) Collings, P. J.; Hird, M. Introduction to Liquid Crystals Chemistry and Physics; Taylor & Francis: London, 1997.
(18) Tian, Y.; Watanabe, K.; Kong, X.; Abe, J.; Iyoda, T. Macromolecules
2002, 35, 3739.
(19) Lai, C. K.; Tsai, C. H.; Pang, Y. S. J. Mater. Chem. 1998, 8, 1355.
(20) Ohta, K.; Azumane, S.; Kawahara, W.; Kobayashi, N.; Yamamota, I. J. Mater. Chem. 1999, 9, 2313.
(21) Wen, C. R.; Wang, Y. J.; Wang, H. C.; Sheu, H. S.; Lee, G. H.; Lai, C. K. Chem. Mater. 2005, 17, 1646.
(22) Contoret, A.-E. A.; Farrar, S. R.; O’Nell, M.; Nicholls, J. E.; Richards, G. J.; Kelly, S. M.; Hall, A. W. Chem. Mater. 2002, 14, 1477. (23) Sung, H. H.; Lin, H. C. Macromolecules 2004, 37, 7945.
(24) Guilbault, G. G., Ed. Practical Fluorescence; Marcel Dekker: New York, 1990; Chapter 1.
MA052318N
Table 4. EL Data of PLED Devicesa
sample λmax,EL (nm) Von (V)b Von (V)c max lumin (cd/m2) Φ F(%) FOC8(8) 460 9.5 9.5 2871 0.23 ]FOC8PEO17(17) 464 8 8 2126 0.39 FOC8PEO44(20) 462 10 10 1045 0.38
aPVK:emitters(100:8 by weight)/TPBI(30 nm)/MgAg(50 nm)/Ag(100
nm).bV
onis the turn-on voltage of current.cVonis the turn-on voltage of light.