Computer-based rating method for evaluating
multiple visual stimuli on multiple scales
Yaliang Chuang
a,*, Lin-Lin Chen
a, Ming-Chuen Chuang
ba
Graduate School of Design, National Taiwan University of Science and Technology, 43, Sec. 4, Keelung R.d., Taipei 106, Taiwan
b
Institute of Applied Arts, National Chiao Tung University, 1001, Ta-Hsueh R.d., Hsinchu 300, Taiwan Available online 19 September 2007
Abstract
In this research, two joint evaluation rating methods (focus-on-attribute and drag-and-drop) and a separate evaluation rating method (focus-on-stimulus) are proposed for rating multiple visual stimuli with respect to multiple scales. All three interactive methods incorporate a real-time adjusting mech-anism, allowing respondents to interactively adjust their ratings. Using the traditional paper-and-pencil method as the basis for comparison, the performance of these computer-based rating methods and the proposed real-time adjusting mechanism were investigated. First, it was found that the computer-based methods not only produced results equivalent to those produced by the paper-and-pencil method, but also improved the data quality by preventing the occurrence of missing values and allowing respondents to adjust their scores. Second, the two joint evaluation methods performed bet-ter than the separate evaluation method in bet-terms of usage experience, test–retest reliability, and the likelihood of simulating the daily shopping experience, in which multiple consumer products are often compared simultaneously. Of the two joint evaluation methods, the drag-and-drop method received better subjective evaluations than the focus-on-attribute method. Third, the proposed real-time adjusting mechanism was found to obtain better subjective satisfaction in rating. In sum-mary, for measuring multiple visual stimuli with multiple scales, the computer-based joint evaluation rating methods using a real-time adjusting mechanism were found to be better choices among the measurement tools investigated.
Ó 2007 Elsevier Ltd. All rights reserved.
Keywords: Joint evaluation; Separate evaluation; Comparative rating; Real-time adjustment
0747-5632/$ - see front matter Ó 2007 Elsevier Ltd. All rights reserved. doi:10.1016/j.chb.2007.08.003
* Corresponding author. Tel.: +886 2 27301284; fax: +886 2 27376303.
E-mail address:yaliang.chuang@gmail.com(Y. Chuang).
Computers in Human Behavior 24 (2008) 1929–1946
www.elsevier.com/locate/comphumbeh
Computers in Human Behavior
1. Introduction
During the last few decades, consumer product manufacturers have devoted much effort to improving the functionality and usability of products. As a result, the alternative options of each kind of consumer products are almost indistinguishable with regard to performance and functionality. For a product to differentiate itself from its competitors,
therefore, aesthetic quality becomes a key factor (Norman, 2004). Desmet and Hekkert
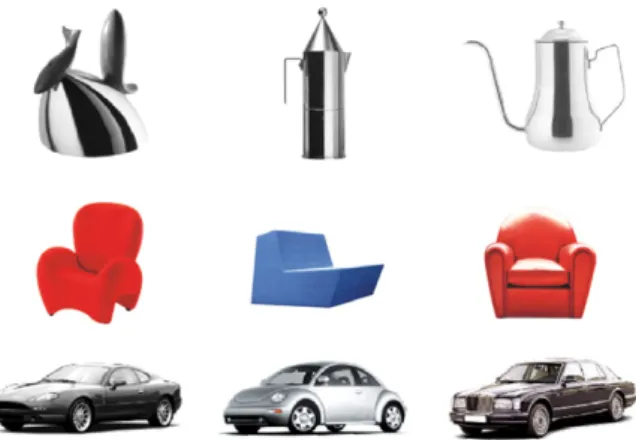
(2007)have defined the way that a product can be experienced according to three distinct levels: the aesthetic experience, the experience of meaning, and the emotional experience. The visual aspects of a product, such as form and color, play an important role in deliv-ering this overall product experience. Take, for example, the three different types of
con-sumer products shown inFig. 1– a teapot, an armchair, and a car. For these three product
types, each of the samples shown fulfills its respective functional and usability require-ments. But, each evokes a different emotional response via its shape, color, material, and other visual attributes. To address this growing need of developing each product’s aes-thetic qualities, it is important for companies to understand consumer perceptions and preferences with regard to these aesthetic, or visual, qualities. In fact, such understanding is essential if a company wishes to be successful in product design and marketing. In the research presented in this paper, rating methods were developed for evaluating multiple visual stimuli with respect to multiple scales. Such tools can be useful for studying con-sumer perceptions regarding alternative concon-sumer product designs, or for other applica-tions in which the visual attributes of stimuli are the focus of evaluation.
Many methods have been employed for the evaluation of multiple stimuli, including paired comparisons, ranking, ordered-category sorting, and rating. Among these, the rat-ing method represents one of the most popular and most easily applied data collection
methods (Smith & Albaum, 2005). In the literature, two different evaluation modes are
considered possible for comparing alternative options (Hsee, 1996). In the separate
evalu-ation mode, each stimulus is separately rated on a number of scales; whereas in the joint evaluation mode, a number of stimuli are rated in comparison with each other on a specific scale. These two modes have also been referred to as absolute and comparative measures
(Boc¨kenholt, 2004), or monadic and comparative scaling methods (Peterson, 2000; Smith & Albaum, 2005).
Hsee (1996)found that a person’s preference for an object differs when rated according to different evaluation modes. An object rated as better in the separate evaluation mode might be seen as less preferred when evaluated in the joint evaluation mode. Despite the potential difference in results, the separate evaluation rating form is more often applied
in current studies (Boc¨kenholt, 2004) than the joint evaluation form. This might be due to
the limitations of available computer-based joint evaluation tools and to the complexity involved in rating multiple objects using the conventional paper-and-pencil approach.
Even though joint evaluation methods are less often employed, they have been found to provide solutions for several defects that occur when using separate evaluation methods, including what are referred to as the anchoring problem, the halo effect, intransitivity, and
unreasonably long questionnaires (Hughes, 1975). The anchoring problem refers to the
biases that arise when making comparisons against a reference, or anchor, point (Sherif
& Hovland, 1961). The halo effect occurs when a respondent rates an object with respect to a scale based on the results of a previously rated scale. Intransitivity refers to contradic-tions in rating results, for example when a is judged to be preferable to b and b preferable to c, and yet c is also judged to be preferable to a. When it comes to the problem of unrea-sonably long questionnaires, which occur as the number of scales increases, it is easy to understand that such a process might increase the possibility of the fatigue effect, thus
reducing participants’ response rates and resulting in missing values. Boc¨kenholt (2004)
has also reported that by using joint evaluation methods, it is possible to avoid the unde-sirable effects of idiosyncratic interpretations, to facilitate respondents in being more con-sistent in rating objects, and to collect richer information on their preferences. In addition, joint rating is also better at simulating respondents’ daily experiences, in which alternative options are usually compared in parallel, for example, when shopping for consumer prod-ucts in a store.
Using the paper-and-pencil approach, Downs (1978) verified Hughes’ findings and
found that the ratings obtained using the joint evaluation methods offer higher reliability than those obtained using the separate evaluation method. However, participants involved in studies using the joint evaluation methods felt the rating tasks to be more difficult and confusing than using the separate evaluation method, and needed more time to complete them. By redesigning the rating forms, the efficiency of using joint evaluation methods
have been improved (Golden, Albaum, & Zimmer, 1987; Narayana, 1977). However,
the negative aspects of the confusing and difficult experience in rating objects were not discussed in these studies.
Although paper-based methods have been used for a long time, and they allow a researcher to easily conduct a survey without requiring computer skills or equipment, computer-based methods, used in conjunction with the Internet, offer several advantages (Barak, 1999; Epstein & Klinkenberg, 2001). These include the following points: (1) the contents of the test can be dynamically adapted according to participants’ responses; (2) the sequence of stimuli can be randomly generated for each participant in order to reduce ordering effects; (3) scores can be automatically checked and rapidly computed; (4) the same experimental setting can be assured for every participant; (5) multimedia or interac-tive representations, such as animations, films or virtual prototypes, can be displayed for evaluation; and (6) target users can be recruited over the Internet to take the survey. In addition, computer-based and web-based methods have been shown to obtain results
equivalent to those obtained by using conventional paper-and-pencil methods (e.g.,Huang, 2006; Knapp & Kirk, 2003; Lukin, Dowd, Plake, & Kraft, 1985; Wilson, Genco, & Yager, 1985).
Based on the previous results, as described above, three types of interactive rating meth-ods based on the joint evaluation and the separate evaluation modes were developed in the research presented in this paper. Using the traditional paper-and-pencil method as the basis for comparison, the performance of these computer-based interactive rating methods and a proposed real-time adjusting mechanism were investigated, and the results are also pre-sented here.
2. Rating methods
Rating is one of the most popular data collection methods for studying people’s pref-erences among alternative options. It allows participants to express their opinions by reg-istering a degree directly on a scale. Among the different types of scales that can be used,
semantic differential scales (Osgood, Suci, & Tannenbaum, 1957) are frequently employed
for collecting information on participants’ perceptions of products (Nagamachi, 1995).
This approach involves using a set of bipolar adjectives, such as Simple/Complex and
Modern/Traditional. For example,Chuang, Chang, and Hsu (2001)used a set of 11
bipo-lar adjectives to investigate the perceptual factors in users’ preferences regarding the design
of mobile phones; andPetiot and Yannou (2004)utilized a set of 17 bipolar adjectives to
examine user preferences at the front end of product development. In the research pre-sented here, semantic differential scales are used in the evaluation of the proposed com-puter-based rating methods.
In addition, to address the potential problem of intransitivity and inconsistency of rat-ing results, a real-time adjustment mechanism for displayrat-ing the ratrat-ing results and enabling participants to adjust their scores was developed in the research presented here. This function was integrated into the computer-based rating methods, and the effects of this new function were investigated.
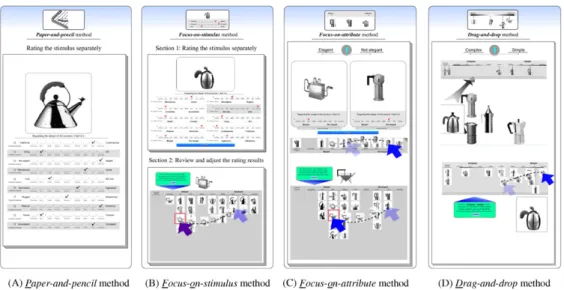
2.1. Development of three types of interactive rating methods
Three types of computer-based rating methods were developed in this research. First, a focus-on-stimulus (FOS) method was developed based on the traditional separate
evalua-tion approach (Osgood et al., 1957). Using this method, a participant rates every stimulus
separately, and then adjusts the overall rating results. An example of the rating and
adjust-ing process for this method is shown in Panel B ofFig. 2. Second, the focus-on-attribute
(FOA) method was developed based on the joint evaluation approach (Hughes, 1975;
Wells & Smith, 1960), in which a participant rates the stimulus and immediately sees the result in comparison with others on a specific bipolar scale. An example of this rating
process is shown in Panel C ofFig. 2. Third, the drag-and-drop (D&D) method was
devel-oped based on the graphic positioning scale (Narayana, 1977) and the joint evaluation
mode. With this method, all of the stimuli are visible for rating, and a participant drags each one directly to the chosen location on a bipolar scale. During the rating process, the participant can adjust any rated stimulus to a new location. After all of the stimuli have been rated, the participant can review the overall rating results and make any desired
adjustments interactively. An example of the rating and adjusting process for this method
is shown in Panel D ofFig. 2.
In order to evaluate the performance of these three computer-based rating methods, the
traditional pencil-and-paper (P&P) method (Osgood et al., 1957) was included in the study
as the basis for comparison. An example of the rating process for this method is shown in
Panel A ofFig. 2.
2.2. Development of real-time adjusting mechanism
Due to the differences in the rating process between the separation and joint evaluation methods, the real-time adjustment mechanism is different for FOS and for the other two methods (FOA and D&D). A participant can update his/her previous scores with respect to a specific scale anytime during the rating process for FOA and D&D, but not for FOS (because of the yet incomplete rating information). After all of the stimuli have been rated against all of the scales, the participant can see the overall results with pictures of the
stim-uli and adjust the scores for each scale (bottom of Panel B, C, D ofFig. 2) for all three
methods (FOS, FOA, D&D). The participant is asked to review and correct any possible misjudgments during the separate or joint rating processes. It was hypothesized in this research that the influence of order biases and the anchor effect of the (pen-and-pencil)
semantic differential methods (Landon, 1971) could be eliminated to a certain extent with
the real-time adjusting mechanism. 3. Research design
The tea/coffee pot, a type of product familiar to many people, was used as the example product to experimentally evaluate the performance of the methods developed in this research, making use of the data and the results (by a paper-and-pencil survey) from a
pre-vious study (Hsiao & Chen, 2006). Participants rated the tea/coffee pots using different
methods in a randomly assigned sequence, except in the case of the D&D method, which requires different equipment and was assessed after the other methods had been evaluated. During the experiment, the different amounts of time a participant required for different tasks (rating the stimuli, confirming and adjusting the overall results) were recorded for purposes of analyzing the efficiency of the alternative methods. At the end of the experi-ment, several stimuli were randomly chosen and retested to evaluate the reliability of the method. Finally, a subjective questionnaire was used to determine each participant’s expe-rience in using the various methods.
3.1. Experiment design 3.1.1. With-in subject design
The experiment was designed as a with-in subject experiment, in which a participant evaluates the items (in this case, the tea/coffee pots) using all of the rating methods, one at a time, on a weekly basis for four weeks. The ordering effect of the with-in subject
design was controlled by using a counterbalancing technique (McBurney & White,
2004), such that the frequency of each rating method, except for the D&D method assessed
in the end, at each ordinal position of the experiment sequence was identical. 3.1.2. Experiment procedure
Each time a participant began to evaluate the stimuli using a specific rating method, he/
she was given instructions similar to those suggested by Osgood (Osgood et al., 1957, p.
82), as shown inFig. 3. After completing several warm-up tests, the participant started
to rate the stimuli with respect to the bipolar adjective scales, which were given in a ran-domized sequence. When the participant finished the rating task, several of the stimuli and adjective scales were randomly chosen and retested to evaluate the reliability of the
method (see Test/retest reliability of Section3.2.3). At the end of the experiment, the
par-ticipant was asked to rate the method with respect to his/her subjective feelings and expe-rience in using the method.
3.1.3. Materials (stimuli and bipolar adjective scales)
In order to compare the results of this study to those obtained in a previous study (Hsiao & Chen, 2006), the same 21 tea/coffee pot stimuli and 10 bipolar adjective scales
were selected (Tables 1 and 2). The scales were labeled in 9-degree units, adapted from
those in Surveyor (Heise, 2001), e.g., extremely rational, very rational, quite rational,
slightly rational, neutral, slightly emotional, quite emotional, very emotional, extremely emotional. In addition, there was an extra ‘‘unable to express’’ checkbox that participants
could select when they did not consider the specific bipolar scale to be applicable (Hughes,
1969). This extra option was included to attempt to eliminate errors resulting from forced
answers.
3.1.4. Control of other factors
To make it unlikely that any differences found were due to irrelevant differences among the rating methods, the layout and user interface of each method were designed to be as similar as possible. A 19-in. LCD monitor was used to present a stimulus in the same size as it was printed on paper. For the D&D method, the display was enlarged by putting two
monitors next to each other, allowing a participant to easily drag stimuli and to have a better overview of the rating results for the multiple stimuli.
3.2. Dependent measurements
Comparing the differences among alternative methods for collecting participant
opin-ions, Bijmolt and Wedel (1995) reported that different methods result in differences of
On every sheet (or screen), you will see picture(s) of the product(s), with the rating scale(s) shown below, as illustrated in the example displayed here.
Please use the following rating rules to express your impressions or intuitive feelings toward the product(s) by clicking the appropriate item on the scale:
1. If you feel that the overall design of the product corresponds to an extremely high degree with the specific adjective given, then please click the option “extremely high”, such as:
for extremely emotional, or
for extremely rational.
Regarding the design of this product, I feel it is
Fig. 3. An example of the first introduction page from the total five pages used in introduction. The contents were translated from the Chinese texts displayed in the experiment.
Table 1
several aspects: (1) the completion time; (2) the occurrence of missing values; (3) the par-ticipants’ usage experience, involving such factors as fatigue and boredom; and (4) the rep-resentation of results derived from statistical analysis. Based on these findings, the performance of each rating method was assessed according to the following characteristics:
3.2.1. Efficiency
During the data collection process, the time used by a participant was automatically recorded. The P&P method was somewhat different from the computer-based methods, because the real-time adjusting task is absent in this method and the data needs to be keyed in by the researcher. To be able to analyze the differences, the recording of times
was coded in three categories: rating time (Tr), adjusting time (Ta), and keying-in time
(Tk).
3.2.2. Occurrence of missing values
The occurrence of missing values was counted and analyzed. 3.2.3. Test/retest reliability
Every time a participant finished the preference judgment task, two supplementary rounds were conducted to evaluate the reliability of the specific method right after the actual test. Again, because these questions needed to be printed prior to the actual exper-iment, the task of retesting was designed differently for P&P than for the computer-based methods. For the P&P method, two stimuli and five bipolar adjective scales were randomly selected to generate ten questions for retesting. For the computer-based methods, two bipolar adjective scales were selected to be retested for all of the stimuli. In order to reduce the learning effects during retesting, the bipolar scales were chosen from the 3rd and 7th scales, which were randomly assigned at the beginning of the test.
3.2.4. Subjective feelings
Each time after the rating task was finished, the participant was asked to indicate his/ her feelings toward the different rating methods, with respect to simplicity, fatigue, likeli-hood of expressing actual opinions, similarity to daily shopping experience, and overall satisfaction. Five rating scales with adverb labels were developed, e.g., extremely difficult, very difficult, quite difficult, slightly difficult, neutral, slightly easy, quite easy, very easy, and extremely easy. The participant dragged the slider to the proper location on the scale to Table 2
The 10 bipolar affective adjectives
1 Traditional–contemporary 2 Old–young 3 Not elegant–elegant 4 Monotonous–varied 5 Not cute–cute 6 Submissive–aggressive 7 Rugged–streamlined 8 Rational–emotional 9 Complex–simple 10 Inconsistent–consistent
express his/her feelings toward the specific method (as illustrated inFig. 4). The score was calculated in real-time and shown next to the scale. The participant could also directly input a score, ranging from 0 to 100. During the experiment, the rating results of the other methods that the participant had previously evaluated were shown on the left of the com-puter screen for reference. The participant could then adjust the previous scores with respect to the current method that he/she had just evaluated. Several animation files were also available for helping the participant to recall the specific rating method.
3.3. Multidimensional analysis of resulting data
Two statistical analysis methods of multidimensional scaling (MDS) were employed.
First, the MDPREF method (Smith, 1999) was applied to analyze the rating data obtained
using the alternative methods. Second, the MULTISCALE method (Ramsay, 1981, 1997)
was applied to estimate the likelihood that the MDS solutions derived from the alternative
data collection methods represented the underlying common perceptual map (Bijmolt &
Wedel, 1995).
3.4. Profile of participants
By using card-sorting method,Tullis and Wood (2004)found that the similarity matrices
and tree structures derived from the sorting data of 15 participants can reach a correlation Fig. 4. Subjective feelings toward rating methods.
of 0.90 to that of total 168 participants. While testing 20 and 30 people, the correlations
are 0.93 and 0.95, respectively. Based on the analysis,Nielsen (2004)recommended that 15
or 20 participants are good enough for most practical purposes. In several researches com-paring alternative data collection methods, the sample size of around 20 participants was
employed. For example,Falahee and MacRae (1997)invited 20 participants to investigate
the reliability of sorting and ranking data for MDS;Van der Kloot and Van Herk (1991)
compared three procedures of MDS to process the sorting data collected from 25
partic-ipants;Ba´rcenas, Elortondo, and Albisu (2003)invited 20 participants to compare the
dif-ference of three sensory methodologies (free choice profiling, direct similarity measurements, and hedonic data). In this research, based on the counterbalancing tech-nique used in arranging the sequence of experiment, a random sample of 16 males and 8 females (aged 21–29) was drawn from the student list of the first author’s department. Among the participants, 15 were students majoring in Industrial Design, and 9 were majoring in Visual Communication. In each session, it took a participant about 30 min to go through the experiment introduction and warm-up test, and to complete the actual test (210 ratings in total, it consisted of 21 stimuli and 10 scales) and retest (42 ratings for computer-based methods, 10 ratings for the P&P method). The participants each received an incentive of 500 New Taiwan Dollars (about 17 US dollars) for their participation. 4. Results
The overall results are displayed inTable 3. Before comparing the differences among the
alternative rating methods, the average data (210 scores in total, consisting of 21 stimuli and 10 scales) of each method was first compared to the results of the previous study (Hsiao & Chen, 2006). The results showed a high correlation (0.85–0.88) between each alternative rating method and the previous survey results. In addition, different partici-pants’ characteristics and different sequences of the alternative rating methods did not appear to have significant effects on the results. Thus, it is plausible that the differences found were due mainly to the dissimilarities among the alternative rating methods. 4.1. Efficiency
As described previously, the time usage data were automatically recorded and coded in
three categories: time used by a participant to rate the stimuli (Tr), time used by a
parti-cipant to adjust and confirm the overall results (Ta), and time used by a researcher to key
in the data (Tk). An overall comparison of the time usage is given inTable 4.
The 12 sets of time data (3 sets for each of the 4 rating methods) were analyzed with the Shapiro-Wilk test for normality at the 0.05 level. The results showed that most sets of the
data were normally distributed, except for the Tkfor P&P and the Tafor D&D (p < 0.04
and p < 0.01, respectively). However, the results were reasonable with regard to the
exper-iment setting. Because the Tk for the P&P method was the time the researcher used to
input participants’ scores, there was a higher frequency of values near the mean. On the other hand, because the D&D method provides flexibility by allowing the participant to adjust the pre-rated stimuli while rating the other stimuli or in the confirm section, the
Tadata didn’t include the time a participant used in the rating section. At the end, the
The time data was then analyzed with one-way ANOVA, and the Student–Newman– Keuls method was used for post hoc comparison. First, for participants to complete the
survey (Tr+ Ta), the fastest method was the P&P, which showed a mean completion time
of 15.83 min, but the differences between this and the times for the computer-based meth-ods were not significant, (p = 0.13) at 0.05 level. However, because the paper-based P&P
method required additional time (Tk, mean of 9.52 min) for keying in each participant’s
data, the overall efficiency of the computer-based methods was better than that of the tra-ditional P&P approach.
Second, the time that participants used for rating and adjusting is discussed, respec-tively, as follows. Because the rating time data for D&D compounded the time many par-ticipants used for adjusting the previous rated stimuli while rating the other stimuli, the
data for D&D shown in Tables 3 and 4 were excluded from the analysis and are not
Table 3
Performance of the four rating methods
Variables Methodsa
P&P FOS FOA D&D
Subjective feeling variables
Degree of simplicityb l 77.46c,d 71.08c 81.29c,d 84.54d
D 18.25 18 9.3 17.61
Degree of fatigueb l 34.29c 50.08d 37.54c 27.17c
D 23.09 19 20.25 21.3
Likelihood of expressing actual opinionsb l 61.83c 73.58d 83.33e 85.92e
D 20.32 14 6.66 12.01
Similarity to daily shopping experienceb l 44.79c 66.71d 79.46e 89.29f
D 20.55 16 8.29 7.54 Overall Satisfactionb l 61.92c 64.33c 80.88d 84.21d D 19.3 19 7.38 17.08 Test–retest reliability l 0.755 0.764 0.788 0.824 D 0.25 0.08 0.11 0.09 Absolute deviation > 4 (%) 4.26 2.18 2.48 1.79
Completion time (min) l 15.83 17.91 17.84 17.37
Rating stimuli (Tr) l 15.83 12.74 13.92 13.57
Adjusting the result (Ta) l 0 5.17 3.92 3.80
Keying in the data (Tk) l 9.52 0 0 0
Missing values 23 (0.4%) 0 0 0
MDS Solution
Cumulative proportion of variance for three-dimensional solution
0.940 0.957 0.946 0.954
Mean correlation between the MDS solution and the common perceptual map derived from the MULTISCALE (with three-dimensional solution)
Correlation 0.95 0.97 1.00 0.98
Estimation of standard error 0.12 0.10 0.00 0.09
l: The mean, D: the standard deviation.
a P&P = paper-and-pencil method, FOS = focus-on-stimulus, FOA = focus-on-attribute method, D&D =
drag-and-drop method.
bSignificant differences in the 0.05 level.
c–f Means in the same row that share the same superscript are not significantly different from one another
presented in the discussion. With regard to rating time (Tr) only, the computer-based
methods were faster than the P&P method (F(2,46) = 3.52, p = 0.035). Among the com-puter-based methods, FOS (with a mean of 12.74 min) was faster than FOA (13.92 min), but the difference was not significant (p = 0.23). With regard to adjusting
the overall rating results (Ta), the results of the paired-sample T-test showed that FOA
(3.92 min) was faster (p = 0.05) than FOS (5.17 min), at 0.05 significant level. 4.2. Occurrence of missing values
There was no occurrence of missing values for the computer-based methods. For the P&P method, there were a total number of 23 (0.4%) missing values found in 4 (16.7%) participants’ sheets. Regarding those records with missing values, two participants had skipped the entire 10 scales on one sheet, one of the other two participants had forgotten to rate a stimulus on two scales, and one had forgotten to rate a stimulus on one scale. 4.3. Reliability
The reliability of each rating method was calculated as the degree to which the same scores could be reproduced when the same stimuli were measured repeatedly by the same
participant (Osgood et al., 1957). Two approaches of comparison were employed. First,
the correlation between the values given by each participant for the same stimulus in the actual test and the additional retest were calculated. There were 1008 pairs of compar-ison of raw rating data (consisting of 21 stimuli, 2 scales, and 24 participants) for each computer-based method and 240 pairs of comparison (consisting of 2 stimuli, 5 scales, and 24 participants) for the P&P method. Using Pearson’s correlation to compute the degree of linear relationship between the pairs of data, the results showed that the test– retest correlation of all the methods was significant at the 0.01 level (2-tailed). Among the methods, D&D (0.824) was found better than FOA (0.788), FOS (0.764) and P&P (0.755). Second, the absolute deviation between test and retest values for each rating Table 4
Efficiency of the alternative rating methods
Methoda The average time used for completing different tasksb
a P&P = paper-and-pencil method, FOS = focus-on-stimulus, FOA = focus-on-attribute method, D&D =
drag-and-drop method.
bT
method was calculated. For deviations of larger than 5 units (out of 9 units), the percent-age was highest for the data collected by the P&P method(4.26%); whereas the percentpercent-ages were only around 2% for the computer-based methods with real-time adjusting mechanism.
4.4. Subjective feelings
After completing the rating task, a participant was asked to rate the survey method based on his/her subjective feelings with respect to (a) degree of simplicity, (b) degree of fatigue, (c) likelihood of expressing actual opinions, (d) similarity to daily shopping experience, and (e) overall satisfaction. Differences between the alternative methods were analyzed using ANOVA for each of these five aspects separately. The Student–Newman– Keuls method was used for post hoc comparison. Using a 0.05 significance level, the results indicated that there were significant differences among the methods for all of the subjective feelings. For degree of simplicity (F(3,69) = 2.88, p = 0.04), all of the methods were considered to be relatively easy to use, with D&D being the easiest (mean of 84.54) and FOS the least easy (mean of 71.08). FOS was deemed to generate greater feelings of fatigue (mean of 50.08) than the other methods (F(3,69) = 4.79, p < 0.01). With regard to the likelihood of each method expressing actual opinions, D&D (mean of 85.92) and FOA (mean of 83.33) were found to be significantly better than FOS (mean of 73.58) and P&P (mean of 61.83) (F(3,69) = 13.81, p < 0.01). Similarly, D&D was considered to stimulate the daily shopping experience (mean of 89.29) significantly better than FOA (mean of 79.46) and the other two methods (FOS with a mean of 66.71 and P&P with a mean of 44.79) (F(3,69) = 42.95, p < 0.01). Finally, as for overall satisfaction, D&D (mean of 84.21) and FOA (mean of 80.88) were rated significantly better (F(3,69) = 10.97, p < 0.01) than FOS (mean of 64.33) and P&P (mean of 61.92).
4.5. The likelihood of representing participants’ actual opinions
The likelihood that the participants’ actual opinions were collected by the alternative rating methods was analyzed from two perspectives: homogeneity of variance and devia-tions of MDS soludevia-tions.
First, classical reliability theory was employed to examine the variances of item responses. Classical reliability theory assumes that the relationship between observed score Y and unobserved true score T can be represented as: Y = T + e, where e is the error (Golden et al., 1987). It is suggested that, assuming the variance of the true score T is the same for the alternative rating methods, a smaller observed variance for Y of a specific rating method implies a smaller error variance of the method, and indicates a better ability to collect participants’ true opinions. From the tests for homogeneity of variance, we found that there were 25 cases (from a total of 210 instances, consisting of 21 stimuli and 10 scales) in which differences in variance were statistically significant (at p < 0.05),
at the 0.05 level. The variances are arranged and shown inTable 5. Among those cases,
the results of D&D and FOA were found to have more instances (15 and 5, respectively) with the smallest variances. In contrast, P&P was found to have the most instances with the largest variances (15).
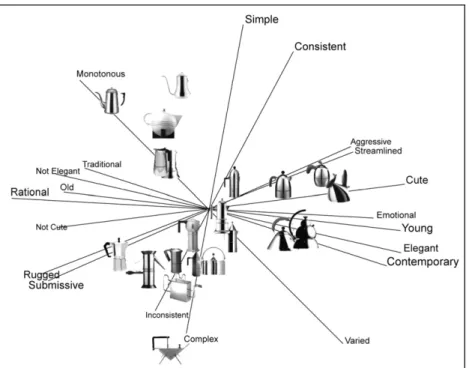
Second, MDS solutions were obtained using MDPREF and were further analyzed using MULTISCALE. The analysis of MDPREF showed that the three-dimensional
solution was appropriate for each method (with the cumulative proportion of variance for P&P, FOS, FOA, and D&D being 0.940, 0.957, 0.946, and 0.954, respectively). According to the results of factor analysis, the three dimensions could be represented as Trend factor (contemporary-traditional), Emotion factor (aggressive-submissive), and Complexity
fac-tor (simple-complex). The results were similar to those ofHsiao and Chen’s study (2006).
An example of the three-dimensional perceptual map of D&D is shown inFig. 5.
To compare the difference and the likelihood of these MDS solutions in representing the participants’ actual perceptions, the three-dimensional coordinates derived from
MDPREF were investigated in two steps (Bijmolt & Wedel, 1995). First, for each rating
method, we computed a distance matrix of the pairwise distances between stimuli from the three-dimensional coordinates of the perceptual map. The initial scores of the three computer-based methods, which participants rated before adjusting, were also included. The resulting seven distance matrices, corresponding to seven perceptual maps, were then simultaneously analyzed with MULTISCALE to produce a (three-dimensional) common
perceptual map (Bijmolt & Wedel, 1995; Ramsay, 1981). The results showed that FOA
and D&D had higher correlations (1.00, 0.98, respectively) than FOS (0.97) and P&P (0.95). At the same time, the estimation of standard errors for fitting the results of each alternative rating method to the common perceptual map were FOA(0.00), D&D(0.09), FOS (0.10) and P&P (0.12). If the real-time adjusting mechanism was absent, the estima-tion of standard errors of FOA, D&D, and FOS methods increased to 0.02, 0.13, and 0.12, respectively. In general, the real-time adjustment mechanism helped to improve the data quality, and the perceptual maps derived with MDPREF from the joint evaluation rating methods represented the common underlying perceptual map better than those derived from the separate evaluation methods.
4.6. Performance of the real-time adjusting mechanism
The mechanism of real-time adjustment allows participants to correct rating errors dur-ing the evaluatdur-ing process. Whether or not the real-time adjustment is a useful tool was investigated by analyzing the frequency with which it was used and the extent of the adjustments. Since the stimuli can be directly and freely adjusted on a continuous scale in the D&D method, a participant used the adjusting mechanism as many as 66.29 times on the average, compared to FOS (27.96) and FOA (19.75). However, the adjustments were mostly small changes on the level of response intensity. For FOS, 91.5% of the Table 5
The comparison of variances among the four rating methods
Methodsa Instances with
smallest variances Instances with 2nd smallest variances Instances with 3rd smallest variances Instances with largest (4th smallest) variances P&P 2 (38) 3 (40) 5 (45) 15 (87) FOS 3 (43) 6 (42) 11 (70) 5 (55) FOA 5 (63) 12 (75) 6 (47) 2 (25) D&D 15 (66) 4 (53) 3 (48) 3 (43)
(*) Numbers of instances that are from the total 210 instances.
a P&P = paper-and-pencil method, FOS = focus-on-stimulus method, FOA = focus-on-attribute method,
Fig. 5. Three-dimensional perceptual map obtained by MDPREF based on the data collected with the drag-and-drop method.
Table 6
Comparisons of initial ratings and final ratings after adjustments Stimulus
1 2 3 4 5 6 7 8 9 10 11 12 13 14 15 16 17 18 19 20 21
complex-simple scale based on the data collected with the focus-on-stimulus method
Initial 5.83 6.46 5.29 6.54 4.96 7.04 6.58 3.63 7.83 4.67 4.08 6.46 3.17 4.08 2.75 4.29 6.58 5.13 5.17 6.5 4.96 Final 5.71 6.71 5.33 6.5 5.17 7.29 6.46 3.5 7.92 4.79 4.04 6.38 3.21 4 2.63 4.33 6.79 5.21 5.17 6.58 5.25 F-I -0.12 0.25 0.04 -0.04 0.21 0.25 -0.12 -0.13 0.09 0.12 -0.04 -0.08 0.04 -0.08 -0.12 0.04 0.21 0.08 x 0.08 0.29 Initial Rank 13 14 12 17 8 20 18 3 21 7 4 15 2 5 1 6 19 10 11 16 9 Final Rank 13 18 12 16 8 20 15 3 21 7 5 14 2 4 1 6 19 10 9 17 11 FR- IR x 4 x -1 x x -3 x x x 1 -1 x -1 x x x x -2 1 2
rugged-streamlined scale based on the data collected with the focus-on-attribute method
Initial 2.50 7.58 6.83 4.71 4.50 5.71 2.08 2.38 4.04 5.33 7.46 4.79 3.58 3.96 1.92 5.65 8.25 4.00 6.33 5.88 4.68 Final 2.04 7.96 6.96 4.75 4.42 5.83 2.08 1.96 3.96 5.33 7.58 4.79 3.67 3.61 1.63 5.70 8.54 4.08 6.54 5.96 4.78 F-I -0.46 0.38 0.13 0.04 -0.08 0.12 x -0.42 -0.08 x 0.12 x 0.09 -0.35 -0.29 0.05 0.29 0.08 0.21 0.08 0.10 Initial Rank 4 20 18 9 10 16 3 1 6 11 19 12 5 8 2 14 21 7 15 17 13 Final Rank 4 20 18 10 9 15 3 2 6 12 19 11 5 8 1 14 21 7 16 17 13 FR- IR x x x 1 -1 -1 x 1 x 1 x -1 x x -1 x x x 1 x x
adjustments showed deviations of smaller than 3 units (out of 9 units) between the final ratings and the initial ratings; for FOA and D&D, the percentage were 93.2% and 88.8%, respectively. Examples of the comparisons between the average data of initial
rat-ings and the adjusted final results are shown inTable 6. From the tracking data (of
adjust-ments), the effect of comparisons among stimuli were clearly identified. Although the adjusting mechanism allowed the participants to modify their rating results, the order of the stimuli on the specific scale remained approximately constant. This might be the rea-son for getting similar MDS solutions between the initial ratings and the adjusted data. It was concluded that the improvements due to the use of the real-time adjusting mechanism were not statistically significant, but this mechanism was found to receive better subjective scores in the usage experience.
5. Conclusion
The benefits of computer-based rating methods and the proposed real-time adjusting mechanism were investigated in this research. First, it was found that the use of com-puter-based methods not only produced results equivalent to those produced by the paper-and-pencil method, but also improved the data quality by preventing the occurrence of missing values and providing a real-time adjusting mechanism for participants to use to adjust their scores as needed. Second, among the computer-based rating methods, the joint evaluation methods (focus-on-attribute and drag-and-drop) performed better than the sep-arate evaluation method (focus-on-stimulus) in terms of usage experience, test–retest reli-ability, and the likelihood of simulating the daily shopping experience. Of the two joint evaluation methods, the drag-and-drop method received better subjective evaluations than the focus-on-attribute method. Third, the proposed real-time adjusting mechanism was found to receive better subjective scores in the rating experience. In general, for measuring multiple objects with respect to multiple scales, the joint evaluation computer-based rating methods with real-time adjusting mechanism were found to be better tools.
On the basis of these findings, we propose that comprehensive rating methods can be developed by providing (1) joint evaluation in which stimuli are rated in parallel with respect to scales, and (2) a real-time adjusting mechanism that participants can use to review and adjust their scores during the process. Effective use of interactivity not only speeds up the survey process, but also provides a better usage experience. Such com-puter-based rating tools can allow designers to obtain more accurate information about users’ perceptions and preferences for the purposes of developing new products or services. References
Barak, A. (1999). Psychological applications on the Internet: A discipline on the threshold of a new millennium. Applied and Preventive Psychology, 8(4), 231–245.
Ba´rcenas, P., Elortondo, F. J. P., & Albisu, M. (2003). Comparison of free choice profiling, direct similarity measurements and hedonic data for ewes’ milk cheeses sensory evaluation. International Dairy Journal, 13(1), 67–77.
Bijmolt, T. H. A., & Wedel, M. (1995). The effect of alternative methods of collecting similarity data for multidimensional scaling. International Journal for Research in Marketing, 12(4), 363–371.
Bo¨ckenholt, U. (2004). Comparative judgments as an alternative to ratings: Identifying the scale origin. Psychological Methods, 9(4), 453–465.
Chuang, M. C., Chang, C. C., & Hsu, S. H. (2001). Perceptual factors underlying user preferences toward product form of mobile phones. International Journal of Industrial Ergonomics, 27(4), 247–258.
Desmet, P. M. A., & Hekkert, P. (2007). Framework of product experience. International Journal of Design, 1(1), 57–66.
Downs, P. E. (1978). Testing the upgraded semantic differential. Journal of the Market Research Society, 20(2), 99–103.
Epstein, J., & Klinkenberg, W. D. (2001). From Eliza to Internet: A brief history of computerized assessment. Computers in Human Behavior, 17(3), 295–314.
Falahee, M., & MacRae, A. W. (1997). Perceptual variation among drinking waters: The reliability of sorting and ranking data for multidimensional scaling. Food Quality and Preference, 8(5–6), 389–394.
Golden, L. L., Albaum, G., & Zimmer, M. R. (1987). The numerical comparative scale: An economical format for retail image measurement. Journal of Retailing, 63(4), 393–410.
Heise, D. R. (2001). Project Magellan: Collecting cross-cultural affective meanings via the Internet. Electronic
Journal of Sociology, 5(3). <http://http://www.sociology.org/content/vol005.003/mag.html> Retrieved
31.07.05.
Hsee, C. K. (1996). The evaluability hypothesis: An explanation for preference reversals between joint and separate evaluations of alternatives. Organizational Behavior and Human Decision Processes, 67(3), 247–257. Hsiao, K. A., & Chen, L. L. (2006). Fundamental dimensions of affective responses to product shapes.
International Journal of Industrial Ergonomics, 36(6), 553–564.
Huang, H. M. (2006). Do print and Web surveys provide the same results? Computers in Human Behavior, 22(3), 334–350.
Hughes, G. D. (1969). Some confounding effects of forced choice scales. Journal of Marketing Research, 6(2), 223–226.
Hughes, G. D. (1975). Upgrading the semantic differential. Journal of the Market Research Society, 17(1), 41–44. Knapp, H., & Kirk, S. A. (2003). Using pencil and paper, Internet and touch-tone phones for self-administered
surveys: Does methodology matter? Computers in Human Behavior, 19(1), 117–134.
Landon, E. L. (1971). Order bias, the ideal rating, and the semantic differential. Journal of Marketing Research, 8(3), 375–378.
Lukin, M. E., Dowd, E. T., Plake, B. S., & Kraft, R. G. (1985). Comparing computerized versus traditional psychological assessment. Computers in Human Behavior, 1(1), 49–58.
McBurney, D. H., & White, T. L. (2004). True experiments, part 1: Single-factor designs. In Research methods (6th ed., pp. 265–285). Belmont, CA: Wadsworth/Thomson Learning.
Nagamachi, M. (1995). Kansei engineering: A new ergonomic consumer-oriented technology for product development. International Journal of Industrial Ergonomics, 15(1), 3–11.
Narayana, C. L. (1977). Graphic positioning scale: An economical instrument for surveys. Journal of Marketing Research, 14(1), 118–122.
Nielsen, J. (2004). Card sorting: How many users to test. <http://www.useit.com/alertbox/20040719.html>
Retrieved 31.07.05.
Norman, D. A. (2004). Emotional design. New York: Basic Books.
Osgood, C. E., Suci, G. J., & Tannenbaum, P. H. (1957). The measurement of meaning. Urbana: University of Illinois Press.
Peterson, R. A. (2000). Rating scales. In Constructing effective questionnaires (pp. 61–81). Thousand Oaks, CA: Sage.
Petiot, J. F., & Yannou, B. (2004). Measuring consumer perceptions for a better comprehension, specification and assessment of product semantics. International Journal of Industrial Ergonomics, 33(6), 507–525.
Ramsay, J. O. (1981). How to use MULTISCALE. In S. S. Shiffman, M. L. Reynolds, & F. W. Young (Eds.), Introduction to multidimensional scaling: Theory, methods, and applications (pp. 211–235). London: Academic Press.
Ramsay, J. O. (1997). MULTISCALE manual (extended version). <ftp://ego.psych.mcgill.ca/pub/ramsay/ multiscl>. Retrieved 31.01.06.
Sherif, M., & Hovland, C. I. (1961). Social judgment: Assimilation and contrast effects in communication and attitude change. New Haven: Yale University Press.
Smith, S. M. (1999). A short guide to MDPREF: Multidimensional analysis of preference data. <http://
marketing.byu.edu/htmlpages/books/pcmds/mdpref.html>. Retrieved 31.01.06.
Smith, S. M., & Albaum, G. S. (2005). Measurement and scaling in marketing research. In Fundamentals of marketing research (pp. 371–412). Thousand Oaks, CA: Sage.
Tullis, T., & Wood, L. (2004). How many users are enough for a card-sorting study? In Paper presented at the usability professionals association conference, Minneapolis, MN.
Wells, W. D., & Smith, G. (1960). Four semantic rating scales compared. Journal of Applied Psychology, 44(6), 393–397.
Wilson, F. R., Genco, K. T., & Yager, G. G. (1985). Assessing the equivalence of paper-and-pencil vs. computerized tests: Demonstration of a promising methodology. Computers in Human Behavior, 1(3–4), 265–275.
Van der Kloot, W. A., & Van Herk, H. (1991). Multidimensional scaling of sorting data: A comparison of three procedures. Multivariate Behavioral Research, 26(4), 563–581.