行政院國家科學委員會專題研究計畫 成果報告
客製化產品色彩配置介面設計與評估
研究成果報告(精簡版)
計 畫 類 別 : 個別型 計 畫 編 號 : NSC 96-2411-H-151-001- 執 行 期 間 : 96 年 08 月 01 日至 97 年 08 月 31 日 執 行 單 位 : 國立高雄應用科技大學文化事業發展系 計 畫 主 持 人 : 李穎杰 計畫參與人員: 講師級-兼任助理人員:陳潔瑩 報 告 附 件 : 出席國際會議研究心得報告及發表論文 處 理 方 式 : 本計畫涉及專利或其他智慧財產權,2 年後可公開查詢中 華 民 國 97 年 11 月 30 日
行政院國家科學委員會補助專題研究計畫
■ 成 果 報 告
□期中進度報告
(客製化產品色彩配置介面設計與評估)
計畫類別:■ 個別型計畫 □ 整合型計畫
計畫編號:NSC 96 - 2411 - H - 151 - 001
執行期間:96 年 08 月 01 日至 97 年 08 月 31 日
計畫主持人:李穎杰
共同主持人:
計畫參與人員:陳潔瑩
成果報告類型(依經費核定清單規定繳交):■精簡報告 □完整報告
本成果報告包括以下應繳交之附件:
□赴國外出差或研習心得報告一份
□赴大陸地區出差或研習心得報告一份
■出席國際學術會議心得報告及發表之論文各一份
□國際合作研究計畫國外研究報告書一份
處理方式:除產學合作研究計畫、提升產業技術及人才培育研究計畫、列
管計畫及下列情形者外,得立即公開查詢
■涉及專利或其他智慧財產權,□一年■二年後可公開查詢
執行單位:國立高雄應用科技大學
中 華 民 國 九十七年 十一月 三十日
目錄
==========================================================
摘 要 --- 3 前 言 --- 4 研究目的 --- 5 文獻探討 --- 5 研究方法 --- 6 結果與討論 --- 10 結論與建議 --- 12 參考文獻 --- 13 計畫成果自評 --- 14 出席國際學術會議心得報告--- 15 出席國際學術會議發表論文--- 17==========================================================
摘要
客製化是體驗經濟的一種良好途徑,消費者可透過客製化的模組自行設計喜愛的產品, 而產品客製化後,會自動轉變為一種服務,當服務客製化後,可為消費者帶來積極體驗。在 客製化的產品設計中,改變產品色彩比改變產品造形在生產程序中來的快速且簡易許多,色 彩豐富多樣化,不同的色彩搭配會造成不同的色彩意象,可以應付不同的消費者需求。因此, 利用色彩配置的客製化設計,並藉由電腦影像合成技術展現配色後的各種不同效果,無論是 在實體商店中或是在虛擬網際網路中,都可以帶給消費者不同的色彩魅力與設計體驗。本研 究主要目標探究影響客製化產品色彩選擇介面設計之因素,亦想了解不同的客製化產品色彩 配置介面與使用者的操作績效之關係。本研究以行動電話配色作為介面設計範例,研究結果 顯示在介面設計時應該要優先考慮介面設計形式,色彩組合方式及排列分群方式,另外是否 有色名的輔助較不重要。此外,建議產品色彩組合可依客製化的零件作分群要項而以分項色 票呈現方式作介面設計,此將可降低螢幕中呈現色票組合數目,亦可達到多樣化色彩組合之 使用效率。本研究之成果可供相關業者以及設計師作為產品色彩配置介面設計之重要參考。 關鍵詞:客製化、體驗經濟、色彩配置、介面設計、影像合成Abstract
Customization is one kind of experience economy tools. Consumers can design their own products by means of customization modules. While a product is customized, it will turn to be a service. Thus the service will bring consumers active experiences. In customized products, it is more easy produce to vary product’s color than its form for meeting the need and preference of each individual consumer. Different color combination creative vary image and is able to provide different needs for consumers. Therefore, different color combinations by applying image compositing technique to the customized color arrangement; it will give the consumers different color fascination and design experience. The objective of this study is to explore factors affecting the interface design of the customized product color selection. In addition, this study also explores the relationship between the interfaces with user’s operation performance. This study takes a mobile phone as an example for designing the interface. Results demonstrate that combination type, layout type and alignment type should be considered first when designing interfaces for selecting product color combinations. Whether assistance is provided from additional color names appears less important. Furthermore, it makes sense to recommend itemized color chip for arrangement type, which has the best search time performance and subjective satisfaction degree for easy of use, preference, easy of comparison of product colors and uneasy confusion by users. Furthermore, it is suggested that product color combinations be grouped according to customized product module components, and then be displayed in the layout of itemized color chips. Such an arrangement can reduce the number of combinations of color chips displayed on the screen, and also meet the use efficiency for massive color combination.
Keywords: Customization; Experience economy; Color combination; Interface design, Image
1. 前言
客製化是體驗經濟的一種良好途徑,消費者可透過客製化的模組而自行設計喜愛的產 品,並在產品上生產線之前就能感受到產品未來的面貌。因此,不同的消費者不可能對同一 產品得到完全相同的體驗,因為任何一種體驗都是由個人本身心智狀態參與客製化事件所產 生互動的體驗結果。產品經由客製化之後,會自動轉變為一種服務,而當服務客製化後,可 為消費者帶來更為積極的體驗,企業想要利用體驗經濟方法超越競爭對手,首先必須要客製 化消費者的產品與服務 (Pine & Gilmore, 1999)。在客製化的產品設計過程中,藉由改變產品 的色彩比改變產品造形在產品開發程序中來的快速且簡易。色彩具備豐富且多樣化的特性, 不同的色彩搭配將會造成不同的色彩意象,可以滿足不同的消費者的感性需求(張澄,1988)。 因此,色彩可以反應人的感性需求,並進而能刺激消費者購買的慾望,此也是塑造個人獨特 風格的要件。一件產品利用不同色彩配置可迎合不同生活型態的消費者,而且必須考量不同 社會階層的消費者確實存在於各種不同類型產品的設計與行銷之中。有鑑於此,本研究運用 色彩配置的客製化設計,並藉由影像合成技術來展現色彩配置後的各種不同效果,無論是在 實體商店中或是在虛擬網際網路中,都可以帶給消費者不同的色彩魅力與設計體驗。 消費者對於產品的喜好具有相當大的主觀性差異,喜歡從不同造形與色彩中以感性的方 式挑選心中理想的產品,因此產品的呈現也力求多樣化。就產品開發的成本與效率而言,改 變產品的色彩將比改變造形來得容易且較易生產製造,也較能快速地符合消費者的喜好與需 求。當產品色彩改變時,感性的質也會隨之改變,不同色彩組合的產品可以展現不同的視覺 效果,甚至可以產生不同的產品意象風格( Chronicle Books, 1997)。藉由客製化設計方式讓消 費者能與設計師或業者產生互動,同時提供多樣化色彩構件讓消費者涉入設計的過程,將可 延續產品的生命週期,並能讓業者降低開發成本,獲取更高的利潤。目前市面上有許多通訊 產品早已成為消費者在生活中不可或缺的必需品,而不同生活型態的消費者對於此類產品的 風格意象亦有所不同,例如:銀髮族與年輕族群不同、男性與女性對產品的風格要求也會不 同等。此種類型的產品往往考量其整體所呈現的色彩搭配風格以符合不同消費族群所需。因 此,對企業而言,必須推出一系列不同色彩的產品以符合不同生活型態的消費者所需。目前 一般通訊業者販售行動電話相關產品常常受限於展示空間的大小,並無法將所有的相關產品 進行完整展示,因此提供產品的色彩圖片供消費者參考,而消費者也只能望著展示產品與色 彩圖片加以想像不同色彩組合的產品意象。若業者能讓消費者涉入產品的色彩搭配,讓消費 者能客製自己的產品色彩,藉由影像合成技術呈現消費者所自行設計的產品色彩配置的虛擬 影像,讓消費者可以體驗不同色彩配置所展現的不同意象,此舉將能刺激消費者購買的情 緒,增強其涉入的程度,來驗證體驗式過程有助消費者進行購買的決策。因此,在產品替換 成本以及需要滿足消費者的感性需求的雙重考量下,業者讓消費者能以客製化的方式參與(涉 入)改變產品的色彩應是有其必要性的做法。 本研究運用體驗經濟之概念對客製化消費體驗之影響進行分析,期使客製化設計能具彈 性與多元化,而利用各種不同的電腦人機介面置入在體驗消費過程中,除能更符合企業者與 消費者之使用期望外,也帶來不同的體驗與記憶。有關人與電腦的互動與使用者介面議題, 過去亦有許多相關的研究,人與電腦的互動是一種訊息轉換的過程,它由電腦到使用者,再 由使用者到電腦,也就是說,人透過電腦介面與電腦所完成傳遞與交換的互動是以訊息為內容 (Dix et al., 2003)。因此,如何將訊息轉換並呈現在電腦螢幕上,以便讓使用者有所注意, 並進而有效率地處理而作出正確地決定是非常重要的。隨著科技的腳步,人將透過軟體與電 腦互動得更緊密,而扮演人與電腦互動溝通角色的「電腦使用者介面」,也將越來越重要。 本研究欲探討的內容就是在客製化設計中,關於人類對於產品色彩訊息與色彩配置的介面在 電腦螢幕上呈現之間的互動關係,以及此種關係是否受人類的認知所影響或是色彩資訊量過 多是否造成使用者的資訊負荷等,另外利用體驗經濟的行銷方式,加以設計不同形式的客製 化產品色彩配置的電腦介面,並探討消費者對於介面的涉入情況與使用性探討的議題。
2. 研究目的
本研究主要目的探討影響客製化產品色彩配置介面設計之因素,並藉由實驗設計配置發 展數種不同的客製化產品色彩配置介面設計,輔助消費者體驗產品色彩配置之擬真影像,並 能從中篩選符合消費者所希望風格意象的產品色彩配置。為能找出較佳的客製化產品色彩配 置介面設計,本研究探究影響客製化產品色彩選擇介面設計之因素,亦想了解不同的客製化 產品色彩配置介面與使用者的操作績效之關係。本研究以行動電話配色作為介面設計範例, 希望能由研究結果找出影響使用者操作介面績效之因素,並能藉以提供產品色彩選擇介面設 計的準則,供相關業者以及設計師作為產品色彩配置介面設計之重要參考。3. 文獻探討
在介面設計相關研究中,羅家駿與王勇傑 (2005) 針對使用者認知型態設計個人化電子 商務網站介面,考量電子商務網站需面對不同的瀏覽者,因此在設計網站的內容呈現時必須 考量到不同的因素,並且需要依據不同的瀏覽者特徵進行了解。 Dix et al. (2003)認為所謂的 「人與電腦的互動」(human- computer interaction,HCI),即是關於人、電腦與這兩者相互影 響之關係的研究;而研究 HCI 的目的至少有三件事必須被瞭解,分別就是電腦科技、與電腦 互動的人以及可用性的意義。Eberts (1994)則認為,在人與電腦的互動中,更重要且必須被 強調的重點便是人與電腦互動的效率性。若是該使用者介面沒有被正確地設計,則將使得完 成一項電腦作業變得更為困難並造成時間上更多的花費。 Galitz (2002)認為「電腦使用者介 面」設計在人與電腦的互動中有重要性的影響,因為一個設計良好的螢幕可以增加人類處理 的速度、減少錯誤與加速電腦處理的時間。 Jordan (1999)認為電腦使用者介面是虛擬網路存 在的基礎,透過電腦使用者介面,可以深一層地體驗到網路無遠弗界的空間。因此,電腦與 人的互動將越來越密不可分,且更重要的是,人與電腦的互動將「以使用者為中心」。在涉 入與消費行為相關研究中,Day(1970)將涉入定義為「個人對某一事物產生興趣的程度,或是 此事物對個人自我概念及價值產生的集中度」。 Antil (1984)認為涉入是在特定的情況下,經 由某種刺激引發個人感受到的重要性,以及興趣的程度。 Zaichkowsky (1986)則定義涉入為 「消費者基於本身固有的需求、價值觀和興趣,對某項事物所認知之攸關程度」。4. 研究方法
本實驗主要探究客製化產品多樣化色彩選擇介面設計與使用者的操作績效之關係,並以 行動電話配色作為介面設計範例,由實驗的結果可提供產品多樣化色彩選擇介面設計的準 則。本實驗要探討影響產品色彩選擇介面設計的變數包含色彩組合方式、介面設計形式、色 名呈現方式以及排列分群方式等因子。 除了操作效率外,使用者的主觀滿意度也是介面設 計的重要指標。因此,本研究將針對受測者對於介面的操作績效(完成特定實驗工作的平均搜 尋時間)以及對於介面的主觀滿意度進行深入的探討。 最後,本研究將運用聯合分析(conjoint analysis)找出各影響因子對於操作績效之貢獻比。 4.1. 受試者 本實驗邀請18 位大學生 (男性與女性各 9 人)參與實驗,均擁有正常或經矯正後達到 1.0 以上之視力,平均年齡為20.5 歲(SD=1.2) ,平均使用網路 5 年以上經驗。 4.2. 實驗器材/實驗刺激物本實驗使用多媒體電腦 (CPU: AMD Athlon 2.0GHz; RAM: 512MB PC3200 DDR)與 19” LCD 液晶螢幕 (螢幕解析度設定為 1280*1024 像素; 閃爍頻率設定為 75HZ )呈現實驗刺激物 (亦即本實驗規劃設計之 18 種介面設計樣本) ,為了避免學習效果產生,所有實驗刺激物以 隨機方式在螢幕上呈現,並藉以量測各介面之績效與主觀滿意度。 4.3. 實驗設計 本實驗欲探討影響客製化產品多樣化色彩選擇介面設計共有色彩組合方式(含 2 水準)、 介面設計形式(含 3 水準)、色名呈現方式(含 3 水準)以及排列分群方式(含 3 水準)等四種因子, 各因子及其相對之水準(level)的定義如表 1。因此,所有的因子水準組合數達 2*3*3*3=54 種, 此即構成介面設計配置的組合數達54 種,若將此 54 種介面完全納入實驗中,恐造成受測者 的負擔,並可能在實驗過程出現疲勞效果及影響實驗的績效。有鑒於此,為能將實驗次數降 低且又能達到檢驗實驗因子是否影響實驗績效,本研究運用直交表 (orthogonal array)進行實 驗的配置,並能藉由聯合分析找出各因子對於所要探討的績效之貢獻比(percentage of contribution)。 直交表是一種有效節省實驗成本的最佳化機制,直交表呈現出平衡且不混合, 亦即統計上的獨立性,也就是說直交表中的每一欄中各水準出現的次數是相同的。考量本實 驗的色彩組合方式僅有2 水準,另外三個因子各有 3 水準的情況,採用 L18 直交表是較為適 當的實驗配置,依據 L18 直交表的配置設計後,介面設計樣本由原本 54 個縮減為 18 個 (如 表2),此舉將有效降低受測者負擔,並能提升實驗效率。
表1 產品多樣化色彩選擇介面設計的因子及其水準 因子 水準(Level) A: 色彩組合方式 A1: 單色與雙色組 合不分群 A2: 單色與雙色組 合分群 B: 介面設計形式 B1: 色票呈現 B2: 產品小圖呈現 B3: 分項色票呈現 C: 色名呈現方式 C1: 無色名輔助 C2: 系統色名輔助 C3: 慣用色名輔助 D: 排列分群方式 D1: 矩陣式排列 (欄寬等於列高) D2:垂直式排列 (欄寬大於列高) D3:水平式排列 (列高大於欄寬) 表2 依據 L18 直交表所配置的 18 個介面設計樣本 因子 介面設計樣本 A B C D #01 1 1 1 1 #02 1 1 2 2 #03 1 1 3 3 #04 1 2 1 2 #05 1 2 2 3 #06 1 2 3 1 #07 1 3 1 3 #08 1 3 2 1 #09 1 3 3 2 #10 2 1 1 2 #11 2 1 2 3 #12 2 1 3 1 #13 2 2 1 1 #14 2 2 2 2 #15 2 2 3 3 #16 2 3 1 3 #17 2 3 2 1 #18 2 3 3 2 A:色彩組合方式; B:介面設計形式; C:色名呈現方式; D:排列分群方式 茲將在本實驗中的色彩組合方式、介面設計形式、色名呈現方式以及排列分群方式等四 個因子(factor)及其相關水準詳細說明如下: (1) 因子 A:色彩組合方式 考量市場上行動電話的色彩主要為單色或雙色為主,因此,本實驗將行動電話區分為”上 蓋”與”底座與鏡頭區域”兩個配色區域,經由 5 位設計師以焦點群組方式選出 6 種行動電話流 行色彩,並將這些色彩配置於行動電話的兩個配色區域中。介面設計中的色彩組合方式會有 兩種,其中一種色彩組合方式是將單色行動電話與雙色行動電話不分群(A1),亦即單雙色混 在一起,則會有 36(6*6=36)組配色;另一種色彩組合方式則將單色行動電話與雙色行動電話 分群(A2), 則會有 6 組單色配色與 30 組雙色配色等兩群。此因子主要想了解不同的色彩組合
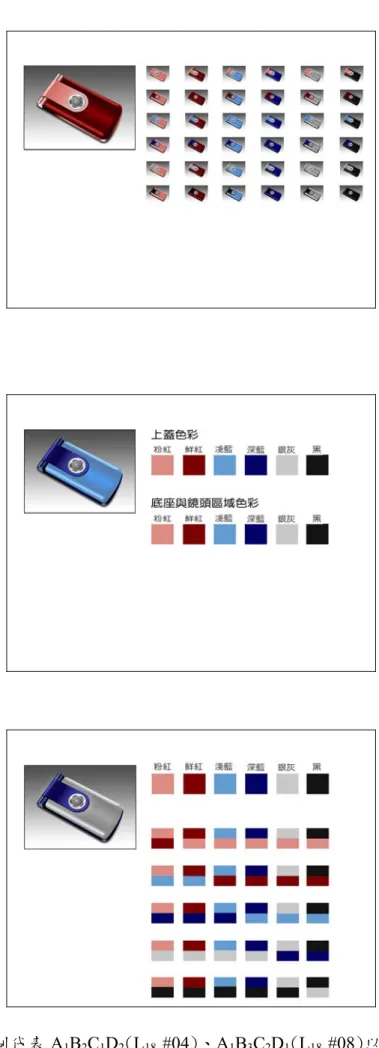
方式對於使用者在挑選產品配色上的操作績效上是否具有差異。 (2)因子 B:介面設計形式 本實驗將介面設計形式歸類為三種:第一種介面設計形式是以色票呈現方式(B1)將產品色 彩配色予以呈現,利用此方式可以正確表達色彩資訊,也可以全覽所有36 組行動電話配色的 情況,但介面複雜度高。第二種介面設計形式是以產品小圖方式(B2)呈現所有產品色彩配色, 利用產品小圖呈現方式可以表達產品的色彩與外觀資訊,也可以全覽所有 36 組配色情況,介 面的複雜度仍高。第三種介面設計形式是分項色票呈現(B3) ,並依照行動電話客製化色彩模 組零件分為”上蓋”與”底座與鏡頭區域”兩個配色區域各自具有 6 組單色色票, 並分別點選”上 蓋”與”底座與鏡頭區域”兩個配色區域的色彩以顯現 36 組配色。以此種方式可以排除多種色 彩的複雜度,亦可以正確表達色彩資訊,但無法在介面中同時全覽所有36 組配色情況。 (3) 因子 C: 色名呈現方式 由於在同一個介面中如果色彩太多容易造成混淆,因此可適當地增加色名以輔助使用者 了解色彩資訊。本實驗將色名呈現方式歸類為三種:第一種為無色名輔助(C1), 純粹以產品色 彩呈現; 第二種是以系統色名(C2)作為輔助色彩呈現,例如: 粉紅色、鮮紅色、淺藍色、深藍 色、銀灰色、黑色等代表不同程度色相;第三種則以慣用色名(C3)加以輔助色彩呈現,如珊 瑚紅、玫瑰紅、天空藍、鮮寶藍、亮銀灰、墨炭黑等,利用習俗名稱或常見物品色名來命名 不同色彩。因此,本研究亦想探討色名呈現方式對介面設計是否產生影響。 (4) 因子 D: 排列分群方式 在介面設計上,行列的編排方式也經常被討論,也會影響使用者執行的效果,所以本實驗 利用行列的排列方式作為排列的分群,並將此排列分群方式作為實驗因子,在本實驗中,藉 由行列編排時所造成的排列分群方式有三種:第一種是矩陣式排列 (代表欄寬等於列高,D1), 因此所有行動電話的色彩組合呈現矩陣式排列而無特別的行列形式。第二種是垂直式排列 (代表欄寬大於列高,D2),所以色彩組合會呈現以行為主的垂直排列方式,第三種是水平式 排列(代表列高大於欄寬,D3),所以色彩組合會呈現以列為主的水平排列方式。因此,本研 究也將探討藉由行列的編排方式所產生的排列分群方式對介面設計所產生的影響。為能更具 體了解本實驗依據L18 直交表配置的介面設計樣本,以 A1B2C1D2(L18_#04)、A1B3C2D1(L18_#08) 及A2B1C2D3(L18_#11)等三種介面設計作為介面範例說明(亦如圖 1 所示): z A1B2C1D2 (L18_#04): 色彩組合方式採用A1: 單色與雙色組合不分群; 介面設計形式採用 B2: 產品小圖呈現; 色名呈現方式採用C1: 無色名輔助; 排列分群方式採用 D2:垂直式排列 z A1B3C2D1(L18_#08) : 色彩組合方式採用A1: 單色與雙色組合不分群; 介面設計形式採用 B3: 分項色票呈現; 色名呈現方式採用C2: 系統色名輔助; 排列分群方式採用 D1: 矩陣式排列 z A2B1C2D3(L18_#11) : 色彩組合方式採用A2: 單色與雙色組合分群; 介面設計形式採用 B1: 色票呈現; 色名 呈現方式採用C2: 系統色名輔助; 排列分群方式採用 D3:水平式排列
圖1. 由上至下分別代表 A1B2C1D2(L18_#04)、A1B3C2D1(L18_#08)以及 A2B1C2D3(L18_#11)
4.3. 實驗程序 在實驗前由實驗者先向受測者說明實驗中必須執行的實驗工作及其實驗目的,本實驗的 產品色彩選擇介面設計共有 18 個 (由 L18 直交表的配置設計之結果),每個介面的實驗工作 是要求受測者找指定配色之行動電話與一份對於介面主觀滿意度問卷。此外,受測者必須完 全了解整個實驗過程才可進行正式實驗。 爲了讓受測者儘可能減輕工作負擔與壓力,每執行 完6 個介面的實驗後休息 10 分鐘,然後再進行下 6 個介面,如此反覆地進行實驗工作與休息 直到完成18 個介面。爲了避免產生學習效果,每位受測者所執行的 18 個介面之實驗順序是 採隨機出現。此外,在實驗過程中將自動紀錄所有受測者在各個介面所執行的實驗工作的操 作時間以及主觀滿意度,以利後續的統計分析。
5. 結果與討論
5.1. 就介面的平均搜尋時間之變異數分析 就執行尋找行動電話色彩組合的工作的平均搜尋時間進行變異數分析,色彩組合方式、 介面設計形式與排列分群方式等三個因子主效果對於介面的平均搜尋時間具有顯著性。然而, 在色名呈現方式方面顯示有沒有色名輔助使用在進行介面的搜尋工作並沒有顯著的影響。此 外,在因子間的交互作用方面,僅有”介面設計形式”與”色名呈現方式”等兩個因子間存在交 互作用效果。 就色彩組合方式的效應而言,色彩組合的分類形式在產品多樣化色彩選擇介面設計的平 均搜尋時間具有顯著差異,單色彩與雙色彩組合不分群較優於單色行動電話與雙色組合行動 電話分群。由於將單色行動電話抽離另成一群反而造成雙色行動電話排列上較為零亂而造成 增加搜尋時間的現象。在單色色票並以點選連結顯現的介面方式中,單色行動電話色彩與雙 色組合行動電話之色彩呈現不分群的選擇方式較為簡單,單色行動電話色彩與雙色組合行動 電話之色彩分群由於多了一組單色分群介面反而變複雜,容易搞混不清造成搜尋時間的增加。 就介面設計形式效應而言,因不同的介面設計形式在介面的平均搜尋時間具有顯著差異, 因此本研究進一步進行多重比較檢定,結果顯示以分項色票呈現方式在介面的平均搜尋時間 較優於色票呈現的配置方式與產品小圖呈現的配置方式。在分項色票呈現是以 6 組單色色票 並以點選連結顯現36 組配色,此種方法是利用色票呈現,將可正確表達色彩資訊又可以排除 多種色彩組合呈現的複雜度。在螢幕上的色彩組合方式若是屬於單色彩與雙色彩組合不分群 的情況下僅顯示6 組”行動上蓋”色票與 6 組”底座與鏡頭區域”色票的介面設計; 若是單色彩與 雙色彩組合分群的情況下,也只再多一組 6 組單色行動電話色票, 遠比 36 組的色票呈現(B1) 與產品小圖呈現(B2)介面設計簡潔單純。因此,在產品多樣化色彩選擇介面設計上,色彩太 多所造成組合量變大,難以讓使用者在同一畫面顯示大量色彩資料中進行搜尋的工作。因此, 以分項色票呈現設計方式(B3)是可以考慮應用的。 就色名呈現方式效應而言,不同的色名呈現方式在產品多樣化色彩選擇介面設計上並沒 有呈現統計顯著差異,也就是有沒有色名輔助說明並不會影響使用者在介面的搜尋時間,因為使用者在螢幕上直接看到產品色彩的色票或圖片可以感受色彩差異與變化。 5.2. 就介面的平均搜尋時間進行聯合分析(Conjoint analysis) 對於一個良好的客製化產品多樣化色彩選擇介面設計而言, 設計師在進行介面設計時需 將影響介面的因素加以考慮,如果能瞭解介面因子對於整體多樣化色彩選擇介面設計的影響 程度,那麼設計師將能比較有效率的來進行介面設計的工作。因本研究運用直交表來進行實 驗的配置,可進一步運用聯合分析找出各因子對於所要探討的績效之貢獻比。因此,本研究 針對介面的平均搜尋時間進行聯合分析,結果顯示介面設計形式對於平均搜尋時間的貢獻比 最大、排列分群方式次之。 因此,在進行客製化產品多樣化色彩選擇介面設計時,如果同時 要考慮介面操作的搜尋時間縮短以及盡量避免操作錯誤的情況下,設計師應該要優先考慮介 面設計形式與排列分群方式。 5.3. 使用者對於介面的主觀滿意度分析 所有受測者在進行實驗時,每完成一個介面的指定工作就必需填寫對該介面主觀滿意度 問卷,此問卷設計包含了受測者對此介面設計在選擇行動電話色彩的容易使用程度、容易辨 識產品色彩程度、容易比較產品色彩程度、容易困惑程度、容易焦慮程度以及對此介面設計 的喜愛程度。 就色彩組合方式因子而言,針對受測者的主觀滿意度資料進行變異數分析,使用者在選 擇行動電話色彩介面時有容易使用程度、容易辨識產品色彩程度、對於各種介面的喜好程度、 使用介面時的困惑程度等四項是呈現顯著(表 3)。 表3 針對主觀滿意度所進行的變異數分析 主觀滿意度評估項目 因子 容易使用 容易辨識 容易比較 困惑的 焦慮的 喜好的 A: 色彩組合方式 * * * * B: 介面設計形式 * * * * C: 色名呈現方式 D: 排列分群方式 * * *: p<0.05 就介面設計形式因子而言,使用者在選擇行動電話色彩介面時有”容易使用的程度”、” 對於各種介面的喜好程度” 、”容易比較色彩的程度” 、”使用介面時的困惑程度”等四項主觀 滿意度呈現統計顯著性。行動電話分為”上蓋”與”底座與鏡頭區域”兩群色票呈現方式較為簡 潔而容易搜尋使用並且不容易產生困惑; 而色票呈現(B1 )與產品小圖呈現(B2)的介面設計形 式有36 種色彩組合,確實是太多組合同時在螢幕上而顯得複雜不易使用。
就色名呈現方式因子而言,使用者在選擇行動電話色彩介面時,主觀滿意程度的各項評估 項目均沒有呈現顯著性,所以無論是有色名或無色名都對介面的主觀滿意度沒有影響, 其實 使用者在介面中進行產品色彩選擇時,主要還是以觀看色彩本身為主。 就排列分群因子而言,使用者在選擇行動電話色彩介面時有二項主觀滿意度評估項目(包 含對於各種介面的喜好程度與容易辨識色彩的程度)是呈現統計顯著性。對於排列分群,使用 者喜歡垂直式排列或是水平式排列,此兩種排列特別在色票呈現(B1 )與產品小圖呈現(B2)的配 置型態,還會呈現排列分群的效果,使用者也覺得垂直式排列或是水平式排列比較容易辨識, 特別是36 組色彩呈現的(B1 )與 (B2),因為排列分類所以更容易辨識。 就對使用者選擇行動電話色彩介面的焦慮程度進行變異數分析, 但所有因子皆不顯著, 所以使用者針對這四種因子而設計下的18 種介面編排,在操作使用中其焦慮感覺不會有很大 差異,代表使用者對於各種介面設計並不會產生很嚴重的焦慮感。
6. 結論與建議
一個介面不該讓使用者在瀏覽時產生疑惑與焦慮,也不要考驗使用者的操作方式,好的使 用者介面設計主要使介面更貼近使用者的需求,讓使用者以最短的時間來找到想要的資訊。 本實驗研究客製化產品多樣化色彩選擇介面設計與使用者的操作績效之關係,其結果可提供 產品多樣化色彩選擇介面設計的參考。茲將本研究的主要結果敘述如下: (1) 當產品色彩組合很多的情況,可藉由介面設計來改善其傳達與顯現之功能。 (2) 藉由聯合分析可得知進行介面設計時應該要優先考慮介面設計形式,色彩組合方式及 排列分群方式,另外是否有色名的輔助似乎較不重要。 (3) 使用者在搜尋時間與主觀滿意度評估中,分項色票呈現方式(B3 )有最佳的表現。因此, 建議產品色彩組合可以依其客製化的零件作分群要項而以分項色票呈現方式作介面設 計,此將可降低螢幕中呈現色票組合數目,亦可達到多樣化色彩組合之使用效率。 (4) 分群在介面設計中是很重要的因子,但是分群的方式必須慎重選擇才能達成有效率的 使用操作,特別是群內個數不宜太多,本研究發現排列分群較色彩組合分群好,因為 在排列分群當中,每一群的個數較少而且平均。參考文獻
1. 張澄, 1988,色彩行銷戰略, 世茂出版社,台北.
2. 羅家駿、王勇傑, 2005, 針對使用者認知型態設計個人化電子商務網站介面, 中華管理學報, S_1, 47-56.
3. Antil, J. H. 1984, “Conceptionalzation and Operationalization of Involvement,” Advances in Consumer Research, Vol. 11, pp 203-209.
4. Chronicle Books Inc., the color book, 1997.
5. Day, G. S., 1970, Buying Attitudes and Brand Choice, NY: The Free Press, New York 6. Dix, Alan, & Janet E. Finlay, Gregory D. Abowd, Russell Beale, 2003, Human-Computer
Interaction Prentice Hall, 3 edition.
7. Eberts, Ray E., 1994, User Interface Design (Prentice-Hall International Series in Industrial and Systems Engineering), Prentice Hall College Div.
8. Galitz, Wilbert O., 2002, The Essential Guide to User Interface Design, Wiley, 2 edition 9. Jordan, Tim, 1999, Cyberpower: The Culture and Politics of Cyberspace and the Internet,
Routledge.
10. Pine II,B. & Joseph, James H. Gilmore, 1999, The Experience Economy: Work Is Theatre & Every Business a Stage, Harvard Business School Press.
11. Zaichkowsky, J.K., 1986, “Measuring the Involvement Constructure,” Journal of Consumer Research, Vol.12, No3, pp341-352.
計畫成果自評
研究內容與原計畫相符,達成目標如下: (1) 有效達成產品色彩組合之客製化目標 本研究建立體驗式客製化產品色彩配置之電腦介面,讓消費者可以體驗產品各 種色彩配置,建立消費者體驗互動式介面,營造消費過程的動態與喜悅,並依據自 己的喜好選擇色彩配置,因此每個人所獲得的方案也不同,再者,經由影像合成的 擬真效果,讓消費者可以立即看到最佳方案,不但不會因為太多顏色造成太多選案 而浪費過多選擇時間,可以更有效率來選擇色彩組合並符合自己的喜愛。 (2) 有效協助業者透過此虛擬影像合成之各介面與消費者更快速溝通 體驗式客製化產品色彩配置之電腦介面可以輔助客製化生產銷售,因為所選擇 的行動電話造形,可搭配不同的色彩組合產生多樣化的風格意象,而生產成本與時 間增加不多,又可以延長產品生命週期,且可讓消費者從預設的顏色中自行組合色 彩設計,滿足個性化消費方式,達到企業與消費者雙贏的局面,此外,運用此種輔 助模式可以讓業者與消費者進行更快速的溝通,有效節省雙方的溝通時間,同時, 亦可以協助業者進行促銷並增進雙方的滿意度。 (3) 決策模式具有彈性,可擴及其他類似產品,產業應用價值極高 目前市面上行動電話大多數以單色或二種色彩作為搭配組合,但是此體驗式客 製化產品色彩配置之電腦介面可以推廣到三色以上的色彩組合,或者是其他產品的 色彩組合。但是因為產品類別不同,所以必須依據其產品特性做情境分析與語意調 查,再重新建立該產品的體驗式客製化產品色彩配置之電腦介面。此外,值得注意 的是:情境與意象的感覺會因時代潮流而有所改變,所以基本的意象調查也須隨者 時間而更新,並能提供消費者最新的訊息。另外,本研究所建議之體驗式客製化產 品色彩配置之電腦介面應可擴及至其他相關產品或產業,產業應用價值極高。 (4) 對於參與之工作人員,可以在影像合成(Image compositing)技術、電腦使用者介 面分析、客製化設計等理論方法上得到充分領悟與熟識;並透過實務上的資料蒐 集、電腦操作模擬與分析,達到理論與實務並重之學習效果。 (5)本研究之部分成果已發表於國際學術研討會(會議名稱:2008 The International Conference on Industrial Globalization and Technology Innovation),未來將整理更完整 之成果投稿學術期刊,可提供學術界做為介面設計以及影像處理技術領域應用之價 值性參考。出席國際學術會議心得報告
計畫編號NSC 96 - 2411 - H - 151 - 001
計畫名稱 客製化產品色彩配置介面設計與評估 出國人員姓名 服務機關及職稱 李穎杰 國立高雄應用科技大學文化事業發展系副教授兼系主任 會議時間地點 2008/08/06 ~ 2008/08/08 中國大陸 南京市會議名稱 2008 The International Conference on Industrial Globalization and Technology Innovation
發表論文題目 Exploring usability of screen layout and selecting product color options on e-commerce web
一、參加會議經過
2008 年 8 月 6 日上午 9:00 舉行研討會開幕典禮,由各國專業教授分別上台致詞與勉 勵,並簡述International Association of Organizational Innovation 協會之重要性與其推動之 學術領域與成果。
8 月 6 日上午 10:00 由 Dr. Frederick Dembowski 主講 『How to be an author or reviewer for The International Journal of Organizational Innovation』,此期刊為組織創新協會 所主編,主要論文領域為: 並鼓勵在場專家學者可以將其研究論述 發表於此期刊中,甚 至在此領域之專家亦邀請成為該期刊之審查評論者,為期刊共創更嚴謹審慎的品質。 8 月 6 日下午 13:30 開始至 8 月 8 日下午 16:30 連續三天 32 場次的論文發表與討論, 來自20 多個國家的專家學者總共發表 126 篇論文。發表內容包含: 電子商務、創新管理、 資訊管理、工業管理、市場管理、服務業管理、教育管理、數位學習、消費者行為、創 新策略…等。本人亦聆聽多場次論文發表,特別是電子商務領域在不同國家如何運用發 展以及新技術研發討論。另外在創新策略技術發展於各類管理領域中也有許多新的嘗試 與模式應用,激發一些新的想法與概念作為日後研究之參考。
本人所投稿之論文主題『Exploring usability of screen layout and selecting product color options on e-commerce web』於 8 月 8 日下午 15:00 28 場次發表,在場與會的學者也給 於多方中肯的建議與討論。
二、與會心得
參加International Association of Organizational Innovation 舉辦『2008 The International Conference on Industrial Globalization and Technology Innovation』,將本身研究成果發表分享, 透過全球專家與學者之切磋研究,以刺激想法進而改善研究成果使其更臻完整。並希望在此 研討會中,藉由各國專家學者將其研究成果提出分享,了解產業國際化之模式與因應策略, 以應對科技變革的脚步與全球貿易國際化的潮流趨勢。此次參與 2008 The International Conference on Industrial Globalization and Technology Innovation,觀摩許多教授前輩的學術分
享、指正與寶貴建議,獲益良多。在研討會中聆聽許多不同議題,例如電子商務在歐美或亞 洲國家的應用,並瞭解該地區之特色與發展對日後研究有所助益。在本研討會中亦學習到一 些教育管理與數位學習的技術與方法,亦可以改善日後教學模式。
出席國際學術會議(2008 The International Conference on Industrial Globalization and Technology Innovation)發表論文
Exploring usability of screen layout and selecting product color
options on e-commerce web
Ying-Jye Lee* Chieh-Ying Chen** Fong-Gong Wu***
*Department of Cultural Business Development, National Kaohsiung University of Applied Sciences, 415 Chien Kung Road, Kaohsiung 807, Taiwan
** Department of Multimedia Design, Fortune Institute of Technology, No.1-10, Nwongchang Rd., Daliao Township, Kaohsiung County 831, Taiwan
***Department of Industrial Design, National Cheng Kung University, 1, Ta-Hsueh Road, Tainan, Taiwan 701, R.O.C.
Abstract
The objective of this study is to explore the usability of screen layout when selecting a series of customized product color combinations on e-commerce web. This study takes the mobile phone as an example to explore the users’ operational performance and preference in terms of screen layout design of customized product color selection. Two kinds of interface designs, including color chip and product thumbnail, are adopted in the experiment to investigate the relationship between the interface of product color combinations and users’ usability. Results showed that color chip used as color display method for screen layout design allowed users to take shorter search time on selecting product color. Additionally, it was suggested that color chip display of color module is used as the screen layout design with a large number of color combinations. Also, users significantly prefer color chip display to product thumbnail display and result in higher operational efficiency in screen layout.
1. Introduction
As advanced as technology has developed today, mass customization has become one kind of consumer activity on the internet. Consumers prefer to choose products combining different colors and forms from a wide variety of styles. The diversified and customized products gradually substitute for unified and standardized products, and then apply them to the e-commerce web. In addition, several products adopt modularity changes and mass customization to produce numerous product variations and styles. The modularity is applied product design to create flexibility, whereby a product can be designed with versatile modules and common parts and that a subtle difference in color for any modular parts results in a product feature that gives the prospective choice in a product with minimal cost or risk (Watanabe and Ane 2004). Product color can affect product image more strongly than product form (Lai et al. 2006). Different color combination can achieve different visual effect and create more pleasing and stylish product image (Ma et al. 2007). The overall image of the product is dominated by color rather than form. Therefore, varying color rather than form offers an easier approach to meet individual consumer’s preference within a modular manufacturing process for customized products. For example, the website of NIKEiD, where consumer can order custom designed NIKE shoes online, is typical customized product selection employed itemized modular color to show various color combination (Figure 1).
Figure 1. The website of NIKEiD for customized products
Regarding the application of the customization, manufacturers can customize color for many products including furniture, clothing, sports shoes, cars, motorcycles, and mobile phones. However, the display area of a shop can only provide a limited number of items, with other color combinations only viewable via catalogues or images displayed on the computer screen. In the majority cases, the option of the consumer is limited to color. Several vendors present virtual product images to consumers; however, the range of colors for choosing is usually large, and consumers often become confused and unable to choose among these colors. van Schaik and Ling (2001) suggested that screen layout should be structured in an organized manner to improve visual
search and therefore usability. Thus the problem of product color information overload may be alleviated using a well-designed screen layout. Therefore, usability research relating to product color information and the on-screen selection of color combinations for products is an increasingly importance to ensure high usability for users. Screen layouts need to be clear and uncluttered for display of color combinations of customized products.
The use of color for screen elements such as menus, buttons, and links are explored for web-based interface in several studies (van Schaik & Ling 2003, Pearson & van Schaik 2003, Ozok & Salvendy 2004). Now that e-commerce web shows the products on the internet to facilitate consumers browsing product information, the display of product color and image options have become important. Nevertheless, the interface of the customized product color combination selection relies greatly on diverse color combinations to present well their products, which bring about the advantage of the on-screen display--showing large amount of color combination information. Interface designers have to use appropriate method to apply colors to screen layout design. However, few studies have discussed the effects of different screen layouts for product color combination. Lindberg and Näsänen (2003) mentioned visual search as an efficient way of measuring the effects of different presentation factors on the speed by which humans can process large amounts of complex visual graphical information. Chen et al. (2007) discussed the effects of color grouping for screen layout on customized product color combination selection, and expressed that the layout type of itemized color chips, which are divided into some items according to the customized color module parts of product, have the best grouping type for customized product color combination selection in search time by users.
Furthermore, color display affects color identification and color selection by consumers on screen layout design. Two most common methods for product color display on e-commerce web are color chip and product thumbnail. Color chip, employed to display various product colors, attaches to product illustration (shown in Figure 2). Sometimes, when consumers click one of color chips on some of product websites, and then follow the link of corresponding product color illustration, and then consumers view product color in detail. Product thumbnail is another display of product colors (shown in Figure 3). Sometimes, when clicking one of product thumbnails, and also then link the corresponding product color illustration.
Figure 3. Product thumbnail: the second type of product color display
2. Method
This study takes the mobile phone as an example for the screen layout design on customized product color combination selection, and divides the mobile phone into three color combination regions of top cover, base, and camera face plate. Recently, wireless industry provides customized color options for covers or different appearance for press key to meet consumers’ distinctive needs. This study primarily explores the users’ operational performance and preferences in customized product colors on screen layout design. Results of the experiment in this study can be used to provide reliable references for product color selection on screen layout design. This experiment would like to explore the effect of color display and how it influence product color selection applied to interface design. Color display as a factor affects the color identification and color selection by consumers on screen layout design.
2.1. Experimental design
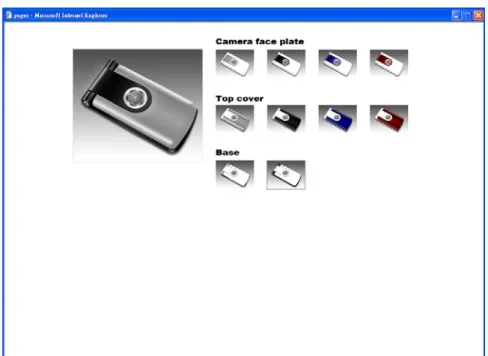
This experiment in this study adopts two types of color display: the first color display uses color chip to present the product color combination; this type can accurately express color information, and is shown in Figure 4. The second color display uses product thumbnail to present all product color combination; using product thumbnail the screen can display the products’ color and appearance information, such as Figure 5. These two color displays are found for many products on the e-commerce web. In the experiment, the mobile phone was divided into different components, including top cover, base, and camera face plate, according to the customized color module parts of the product. The top cover region has four different color options to choose from, camera face plate also has four colors, while the base region has two colors, and thus there are 32 (4*4*2) color combinations. In this study, the color chip or product thumbnail of the interface can not only display product color but also display the color option for product color selection. When
consumers click on a color chip or on a product thumbnail from respective sections for the customized module parts, the composite image of product color combination is immediately shown on the left side of the screen, which can allow users to have a more detailed view of the product. Specially, Descriptions and procedures with regard to image compositing technique can be found in the research conducted by Wu et al (2003, 2004).
Figure 4. The interface of color chips for product color options
Figure 5. The interface of product thumbnails for product color options
2.2 Dependent variable
This study focuses on the evaluation of different screen layouts used to present color combinations for products to potential customers who browse the Internet. Usability can be described as the extent to which a product can be used by specific users to achieve specific goals with effectiveness, efficiency, and satisfaction in a specified context of use (ISO 1998) (van
Harmelen, 2001). Hornbæk (2006) have classified the usability measures employed in the 180 studies into three groups: effectiveness, efficiency, and satisfaction measures. Therefore, this study investigates subjects’ operational performance with the screen layout design (including the mean search time and operational rate of error in completing specific tasks) as well as the subjective preference regarding the screen layout design.
2.3. Apparatus
A multimedia computer (CPU: AMD Athlon 2.0GHz; RAM: 512MB PC3200 DDR) was used to assist in the experiment. Furthermore, a high-resolution monitor (19”) with a 1280(horizontal)*1024(vertical) pixel resolution and 75HZ refresh rate displayed the experiment stimuli (i.e. the experiment samples of interface layouts).
2.4. Procedure
2.4.1. Color search experiment
Before the experiment, the experimenter explained to the subjects the experimental tasks and purposes. There were two different screen layouts of product color selection in this experiment. The experiment required the subject to find three specific color combinations among the layouts these were: 1.monochrome mobile phone with only black; 2.bi-color mobile phone with silver top cover, blue camera face plate, and silver base; 3.tri-color mobile phone with red top cover, black base and silver camera face plate. In order to prevent the learning effect, one subject only used one of the two interfaces, and each interface was tested with 30 subjects; in total there were 60 test subjects. Participants in this experiment were all university students between the ages of 19 and 25 (Mean age=20.82; SD=1.51), none of whom was color blind after color vision test. Additionally, for each test, the completion time and duration and numbers of errors made by the subjects in each interface were recorded for statistical analysis.
2.4.2. Survey of subjective satisfaction
This experiment also invited 30 subjects (who do not participate in the color search task) to fill out a survey of subjective satisfaction for the two screen layout design. Before filling out the survey, the subjects were asked to use the two interfaces, until all interfaces had been viewed. When each subject had tried, they must complete a questionnaire in Chinese on his subjective satisfaction for that screen layout, and the range 6–0 represents the participant cognitive attitudes (6 corresponding to “my preference”, and 0 represented opposite standpoint).
3. Results 3.1. Speed performance
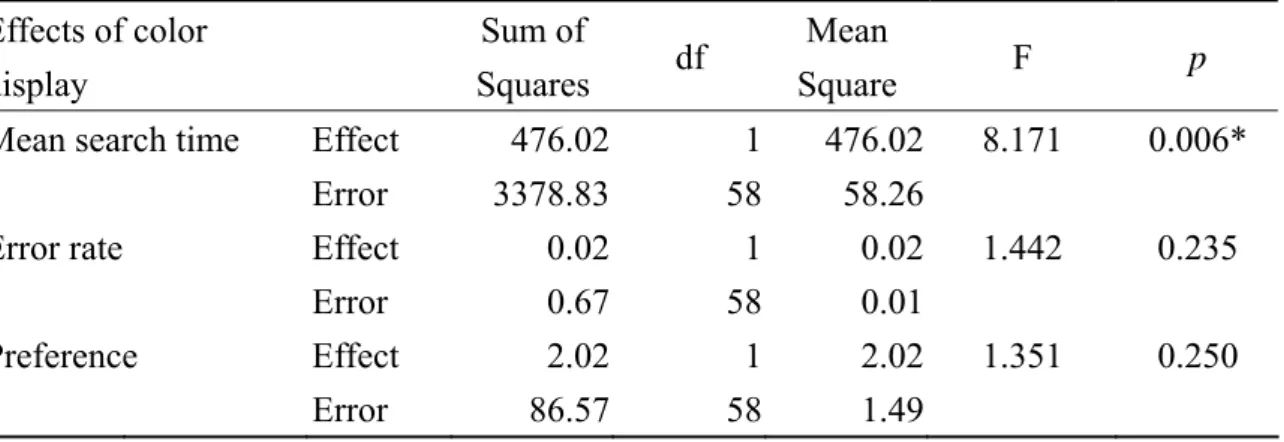
The mean search time of all subjects in the experimentation of two interfaces were compiled in Table 1. The mean search time of searching for mobile phone color combinations was analyzed using analysis of variance (ANOVA). From the ANOVA results in Table 2, the main effect of color display showed significance (F(1,58)= 8.171, p=0.006 < 0.05) in the mean search time among the interfaces, which indicated that two types of color display had a significant difference in the mean
search time.
The mean search time of the interface design of color chip (10.73 sec) is less than product (16.37 sec). The interface design of color chip could accurately express color information, and clicked quickly on color chips to show 32 different mobile phone color combinations, as in Figure 4. The interface design of product thumbnail primarily showed one color of certain module of the product, and the rest of the product was shown as white-based black frame. Those product thumbnails clearly presented the mobile phone’s camera face plate and top cover; but the base of the mobile phone seemed smaller and less clear due to the perspective of the product thumbnails, so that the mean search time was longer, as in Figure 5.
Table 1 .The mean search time and error rate for two interface designs Interface design Mean search time (sec) SD search time Mean error rate (%) SD rate of error Mean Preference SD Preference Color chip 10.73 6.10 2.22% 0.08 4.40 1.25 Product thumbnail 16.37 8.91 5.56% 0.13 4.77 1.19
Table 2. ANOVA for mean search time, error rate and preference Effects of color display Sum of Squares df Mean Square F p Mean search time Effect 476.02 1 476.02 8.171 0.006* Error 3378.83 58 58.26 Error rate Effect 0.02 1 0.02 1.442 0.235
Error 0.67 58 0.01
Preference Effect 2.02 1 2.02 1.351 0.250
Error 86.57 58 1.49
3.2. Error Rate
The mean of error rate for all subjects searching for mobile phone color in the two interfaces were shown in Table 1. The mean of error rate in the task was examined with the analysis of variance (ANOVA). From the ANOVA resulting in Table 2, color display did not show statistical significance with regard to the mean of error rate for the interfaces.
3.3. Subjective satisfaction: preferential sequence at screen layouts
The mean scores of 30 subjects with the two interfaces were shown in Table 1. An analysis of variance test was carried out. The ANOVA results in Table 2, there were not significant differences among user preferences with regard to different screen layout designs. The mean scores for preference of the two types of interfaces (color chip: 4.40), and (product thumbnail: 4.77) were higher. In other words, the screen layout designs were preferred by users. The screen layouts of itemized color module were also preferred, because regardless of color chip or product thumbnail, the colors of different parts of the product could be clearly distinguished, and could lowered the complexity of color combination display on the interface.
4. Conclusion
This study primarily uses mobile phone color combination as the example to explore the users’ operational performance and preference in terms of screen layout design of customized product color selection. When users select color combination for customized products, the product itself has many colors and then the customized color combination numbers also increase greatly. In the experiment of searching color combination, results show that the color chip and product thumbnail as color display for screen layout allowed users to have shorter search time and lower error rate when selecting products color. Such an arrangement can reduce the number of combinations on the screen, and also meet the use efficiency for massive color combinations. Additionally, an interface that uses color chip to display color would be better and faster than one that uses product thumbnail to display color on e-commerce web. If there are many customizable parts, with a high number of color combinations, it is suggested that color chip is adopted as the screen layout, because of preference by users and resulting in higher operational efficiency.
Acknowledgments
The authors would like to thank the National Science Council of the Republic of China for financially supporting this research under Contract No. NSC 96-2411-H-151 -001.
References
Chen, C.Y., Lee, Y.J., Wu, F.G., Su, C.F. (2007), “Screen Layout on Color Search Task for Customized Product Color Combination Selection”, Human-Computer Interaction. Interaction Platforms and Techniques. Lecture Notes in Computer Science 4551, 32-40.
Hornbæk, K. (2006), “Current practice in measuring usability: Challenges to usability studies and research”, International Journal of Human-Computer Studies 64(2), 79-102.
Lai, H.H., Lin, Y.C., Yeh, C.H., Wei, C.H. (2006), ”User-oriented design for the optimal combination on product design”, International Journal of Production Economics 100(2), 253-267.
Lindberg, T., Näsänen, R. (2003), “The effect of icon spacing and size on the speed of icon processing in the human visual system”, Displays 24(3), 111-120.
Ma, M.Y., Chen, C.Y., Wu, F.G. (2007), ”A design decision-making support model for customized product color combination”, Computers in Industry 58(6), 504–518.
Ozok, A. A., Salvendy, G. (2004), “Twenty guidelines for the design of Web-based interfaces with consistent language”, Computers in Human Behavior, 20(2), 149-161.
Pearson, R., van Schaik, P. (2003), “The effect of spatial layout of and link colour in web pages on performance in a visual search task and an interactive search task”, International Journal of Human-Computer Studies, 59(3), 327-353.
van Harmelen, M. (2001), “Object Modeling and User Interface Design”, Designing Interactive Systems, Addison-Wesley.
van Schaik, P., Ling, J. (2001), “The effects of frame layout and differential background contrast on visual search performance in Web pages”, Interacting with Computers 13(5), 513-525.
van Schaik, P., Ling, J.(2003), “The effect of link colour on information retrieval in educational intranet use”, Computers in Human Behavior, 19 (5), 553-564.
Watanabe, C., Ane, B. K. (2004), “Constructing a virtuous cycle of manufacturing agility: concurrent roles of modularity in improving agility and reducing lead time”, Technovation 24 (7), 573-583.
Wu, F.G. Lee, Y.J. Chen, C.H. (2003), “Evaluation of the Realistic Effect of Image Compositing to Assist in Curtain Selection”, International Journal of Industrial Ergonomics 32 (1), 1-12.
Wu, F.G., Lee, Y.J. Lin, M.C. (2004), “Using the fuzzy analytic hierarchy process on optimum spatial allocation”, International Journal of Industrial Ergonomics 33(6), 553-569.
出席國際學術會議心得報告
計畫編號NSC 96 - 2411 - H - 151 - 001
計畫名稱 客製化產品色彩配置介面設計與評估 出國人員姓名 服務機關及職稱 李穎杰 國立高雄應用科技大學文化事業發展系副教授兼系主任 會議時間地點 2008/08/06 ~ 2008/08/08 中國大陸 南京市會議名稱 2008 The International Conference on Industrial Globalization and Technology Innovation
發表論文題目 Exploring usability of screen layout and selecting product color options on e-commerce web
一、參加會議經過
2008 年 8 月 6 日上午 9:00 舉行研討會開幕典禮,由各國專業教授分別上台致詞與勉勵, 並簡述 International Association of Organizational Innovation 協會之重要性與其推動之學術 領域與成果。
8 月 6 日上午 10:00 由 Dr. Frederick Dembowski 主講 『How to be an author or reviewer for The International Journal of Organizational Innovation』,此期刊為組織創新協會所主編,主 要論文領域為: 並鼓勵在場專家學者可以將其研究論述 發表於此期刊中,甚至在此領域 之專家亦邀請成為該期刊之審查評論者,為期刊共創更嚴謹審慎的品質。 8 月 6 日下午 13:30 開始至 8 月 8 日下午 16:30 連續三天 32 場次的論文發表與討論,來 自 20 多個國家的專家學者總共發表 126 篇論文。發表內容包含: 電子商務, 創新管理,資 訊管理, 工業管理, 市場管理, 服務業管理, 教育管理, 數位學習, 消費者行為, 創新策 略…等。本人亦聆聽多場次論文發表, 特別是電子商務領域在不同國家如何運用發展以 及新技術研發討論。另外在創新策略技術發展於各類管理領域中也有許多新的嘗試與模 式應用,激發一些新的想法與概念作為日後研究之參考。
本人所投稿之論文主題『Exploring usability of screen layout and selecting product color options on e-commerce web』於 8 月 8 日下午 15:00 28 場次發表, 亦引起熱列回應,在 場與會的學者也給於多方中肯的討論與建議。
二、與會心得
參加 International Association of Organizational Innovation 舉辦『2008 The International Conference on Industrial Globalization and Technology Innovation』,將本身研究成果發表分享,
透過全球專家與學者之切磋研究,以刺激想法進而改善研究成果使其更臻完整。並希望在此 研討會中,藉由各國專家學者將其研究成果提出分享,了解產業國際化之模式與因應策略, 以應對科技變革的脚步與全球貿易國際化的潮流趨勢。此次參與 2008 The International Conference on Industrial Globalization and Technology Innovation,觀摩許多教授前輩的學術分 享、指正與寶貴建議,獲益良多。在研討會中聆聽許多不同議題,例如電子商務在歐美或亞 洲國家的應用,並瞭解該地區之特色與發展對日後研究有所助益。在本研討會中亦學習到一 些教育管理與數位學習的技術與方法,亦可以改善日後教學模式。