Emerging Markets Finance & Trade / May–June 2014, Vol. 50, Supplement 3, pp. 190–200. © 2014 M.E. Sharpe, Inc. All rights reserved. Permissions: www.copyright.com
ISSN 1540–496X (print)/ISSN 1558–0938 (online) DOI: 10.2753/REE1540-496X5003S311
Profit Performance of Financial Holding
Companies: Evidence from Taiwan
Wan- Chun Liu and Chen- Min Hsu
ABSTRACT: The paper aims to examine the determinants of profit performance of financial
holding companies (FHCs) using panel data for the period 2001–9. The effects of specific ownership structure and dual- core strategy are examined. Our findings show that (1) business diversification, a lower financial cost, a higher liquidity ratio, larger assets, and lower debt ratios can improve the profit performance of FHCs; (2) the percentage of director or government ownership does not affect FHCs’ profitability, whereas foreign ownership has a significantly negative impact on FHC profitability; and (3) a dual- core strategy including banking and insurance has higher profit performance than the other strategies.
KEY WORDS: financial holding companies, ownership structure, random effect, synergy. Since the 1980s, financial liberalization and globalization have become popularized, and certain developed countries such as Germany, Japan, and the United Kingdom have undergone financial reforms and removed many financial controls. Faced with the trend of financial globalization, Taiwan’s government started removing entry barriers and eas-ing restrictions on the business scope of financial institutions. Especially after 1990, the government allowed new applications for the establishment of financial institutions and permitted them to diversify their businesses. The number of domestic banks increased from twenty- four in 1990 to fifty- three in 2001. The average rate of return on assets (ROA) for banks dropped to 0.26 percent in 2001 from 0.9 percent in 1990. The average rate of return on net worth (ROE) also decreased, from 20.79 percent in 1990 to 3.61 percent in 2001. The nonperforming loan ratio rose from 3.71 percent at the end of 1997 to 7.48 percent at the end of 2001. Consequently, the overbanking phenomenon emerged.
To solve the overbanking problem, the Taiwanese authorities conducted a series of financial reforms. For example, the Financial Institutions Merger Law and the Finan-cial Holding Company Act were enacted in 2000 and 2001, respectively. The FinanFinan-cial Holding Company Act allows the establishment of a financial holding company (FHC) and investments in subsidiary institutions that are engaged in different types of financial services such as banking, securities, insurance, bills finance companies, venture capital companies, and asset management companies. In the ten years that followed formal imple-mentation of the Financial Holding Company Act in November 2001, fifteen FHCs were
successively established in Taiwan.1 An important question is whether the establishment
of FHCs has achieved its strategy goals and operating synergies, such as cost savings,
Wan- Chun Liu ([email protected]) is an associate professor in the Department of Logis-tics Management at Takming University of Science and Technology, Taipei, Taiwan. Chen- Min Hsu ([email protected]) is a professor in the Department of Economics at National Taiwan University, Taipei, Taiwan. This research was supported by the Taiwan Academy of Banking and Finance and the Bankers Association of the Republic of China. The authors thank two anonymous referees and the editor, Ali M. Kutan, whose comments and suggestions significantly improved the paper.
cross- selling, and capital efficiency, and the potential benefit from economies of scale. To address this question, we analyze the profit performance of the FHC by using panel data for Taiwan from the period 2001–9.
Literature Review
Numerous studies have discussed the issues of FHC performance, but most have compared the performance of FHC banks with that of independent banks. For example, Mester (1996) shows that banks that join FHCs show better performance than independent banks. Using U.S. and Japanese data, respectively, Shen (2002) and Yamori et al. (2003) find that banks affiliated with bank holding companies are more efficient and profitable than independent banks.
Using data from Taiwan, Hsu and Chang (2005) find that FHC banks generate better performance than independent banks both before and after the passage of the Financial Holding Company Act. Chen et al. (2005) employ the data envelopment analysis (DEA) approach to evaluate the efficiency and productivity growth of commercial banks in Taiwan before and after the establishment of FHCs. Their results indicate that member banks of FHCs are more efficient than nonmember banks. Liu et al. (2006) and Wang et al. (2007) conclude similarly. However, Lin and Lee (2010) discuss the performance differences of merger and acquisition activities of fourteen FHCs in Taiwan before and after their establishment in 2002, and find weak evidence for the improved performance of fourteen FHCs after they began operating.
In addition, the Financial Holding Company Act represents an important effort to address the corporate governance problem. The relevant literature suggests that board and ownership structure plays an important role in corporate governance. Although these empirical studies focus mostly on banking firms, empirical research on FHC performance is limited. For instance, Claessens et al. (2001) use bank- level data and macroeconomic data from eighty Organization for Economic Cooperation and Development countries for the period 1988–95 to examine the extent and effect of foreign presence in domestic banking markets. Their empirical results show that foreign banks have higher profits than domestic banks in developing countries, but the opposite is true for developed countries. Chantapong (2005) examines the performance of domestic and foreign banks in Thailand from 1995 to 2000 for profitability and other characteristics after the East Asia financial crisis. Results show that foreign bank profitability is higher than the average profitability of domestic banks. Yildirim and Philippatos (2007) analyze the cost and profit efficiency of banking sectors in twelve transitional economies of Central and Eastern Europe over the period 1993–2000 and find that foreign banks are more cost efficient but less profit efficient than domestically owned private banks and state- owned banks. Using data of developing and industrialized countries, Micco et al. (2007) indicate that private banks are more profitable than state- owned banks. Lensink et al. (2008) compare the efficiency of foreign and domestic banks and show that foreign ownership negatively affects bank efficiency. Lin and Zhang (2009) employ a panel of banks in China over the 1997–2004 period to evaluate the effect of bank ownership on performance. Their empirical results show that the “big four” state- owned banks are less profitable and less efficient and have a worse asset quality than other types of banks except “policy” banks. Furthermore, banks undergoing foreign acquisition or public listing record better pre- event performance. Berger et al. (2009) examine the efficiency effects of foreign ownership of banks in China over the period 1994–2003 and find that the big four state- owned banks are less
efficient, foreign banks are most efficient, and minority foreign ownership is associated with significantly improved efficiency.
Zahra and Pearce (1989) indicate that the composition of the board of directors of differ-ent structures affects a company’s operating policies, thus influencing the company’s oper-ating performance. Pi and Timme (1993) examine the relationship between cost efficiency and board independence by using a sample of U.S. banks. Their results show that when a chief executive officer is also the chair of the board, the bank’s cost efficiency and return on assets decrease. Adams et al. (2010) explain the importance of the board of directors in a company and state that the board of directors is fundamental in a company’s development.
Certain studies also find that bank size affects performance. Bauer et al. (1993), in a study of U.S. banks in 1986, show that large banks are less efficient than small banks. Berger and Mester (1997) and Miller and Noulas (1996), respectively, show that large banks are more efficient and more profitable than small banks. Similar results can be found in U.S. bank holding companies (e.g., Bosworth et al. 2003). Lo and Lu (2006, 2009) employ Seiford and Zhu’s (1999) two- stage transformation process, including prof-itability and marketability performance, by employing DEA to evaluate the performance of fourteen FHCs in Taiwan, and find that large FHCs perform better than small FHCs. Hu et al. (2009) use DEA to compare the performance of fourteen FHCs in Taiwan and to demonstrate that FHCs can improve their performance by increasing their size.
Empirical Model and Data Description
Our sample is an unbalanced panel that includes financial and corporate governance annual data of fourteen FHCs during the period 2001–9. Among the fourteen FHCs, some were established in 2002 and 2003, and because the required information is not available for all FHCs for every year, our panel data set is an unbalanced panel. The main data source is the Taiwan Economic Journal database.
The empirical model is constructed as follows:
pit = f
(
finit, ownershipit, Xi)
, (1)where pit in Equation (1) is the dependent variable (one of the two profitability
perfor-mance indicators of a bank: ROA and ROE) for financial holding company i in year t. ROA is defined as the ratio of net income after tax to total assets; it represents the earning performance of a bank based on total assets. ROE is measured as the ratio of net income after taxes to shareholder equity. It represents the earning performance of a bank based on the stake of shareholders. The fin variable represents the financial characteristics of FHCs; ownership represents the board and ownership structure indicators; and X repre-sents the other control variables.
Regarding the financial characteristics of FHCs, we select seven variables and classify them into five categories: risk diversification, management efficiency, liquidity, capital adequacy, and scale. Among them, two indicators are used to evaluate risk diversifica-tion: non–operating expenses ratio (NOE) and the Herfindahl–Hirschman index (HHI). NOE is considered to capture the degree of financial holding reinvestment activities in those that are not related to the operation of business (e.g., loss on disposal of property and equipment) and is defined as non–operating expenses divided by total operating revenues. A high NOE indicates that the degree of reinvestment activities of an FHC is too high, resulting in worse performance of an FHC. However, diversification investment
in many industries reflects better competitive advantage and tends to be more profitable. The relationship between NOE and FHC profit performance is therefore mixed. The HHI captures the degree of business concentration of FHCs and is calculated by summing the squared share of the assets of subsidiaries in the holding company. A higher value of HHI implies that an FHC’s business is more concentrated. The traditional structure- performance (SCP) hypothesis suggests a positive relationship between concentration and profits. Consistent with the SCP hypothesis, we expect a positive sign for HHI. The financial operational cost ratio (FOC) is used to evaluate the managerial efficiency indicator of FHCs. The FOC is defined as financial operational cost divided by operating revenue. A higher ratio indicates inefficient bank management and increases the prob-ability of banking distress. Thus, the coefficient of FOC is expected to be negative.
We use the liquidity ratio (LR) as a proxy for FHC liquidity. LR is defined as current assets divided by current liabilities. LR measures a company’s ability to pay short- term obligations. A higher LR is indicative of a greater capability of the company to pay its obligations. The coefficient of LR is therefore expected to positive. We select the debt ratio (DEBT) and double leverage ratio (DLR) as proxies for capital adequacy indicators. DEBT represents the percentage of total debt in total assets. It shows the proportion of a company’s assets that are financed through debt. A higher debt ratio indicates a lower borrowing capacity of an FHC. The expected sign of DEBT is negative. The DLR is the ratio of the amount of an FHC’s long- term investment to its net worth and is used to judge whether the FHC’s debt ratio from reinvestment is too high. A DLR that is too high implies that a large portion of long- term investment funding of an FHC is derived not from its own capital but from borrowing, leading to the possibility of excessive risk. To avoid excessive debt investment, an FHC’s double leverage ratio cannot exceed 125 percent. We expect a negative relationship between DLR and profits. We use the logarithm of total assets (SIZE) as the measure for FHC scale. Generally, the expected coefficient sign of SIZE on profit is positive and is supported by the “too- big- to- fail” argument.
We measure the board and ownership structure using three indicators: director
owner-ship (DO), government ownerowner-ship (GO), and foreign ownerowner-ship (FO).2 DO is defined
as the percentage of common shares held by directors and supervisors of the FHC. GO is defined as the percentage of shares owned by the government. FO is calculated as the percentage of shares owned by foreign people and institutions. Higher GO is generally considered to be relatively less efficient. The expected sign of GO is therefore negative. However, much evidence indicates that foreign ownership has a significant positive association with bank performance, especially in developing countries (see Berger et al. 2009; Chantapong 2005; Lin and Zhang 2009). The main reason is that foreign owners have the ability to monitor managers and provide technology to help managers improve operational performance. Therefore, we expect FO to be positively related to the profit performance of the FHC.
In addition, because FHCs combine at least two different financial activities subsid-iaries, such as banking, insurance (life insurance or property insurance), securities, and bills finance companies, they are expected to generate cross- selling opportunities among various financial activities, providing an effective way to create synergy. In our sample, all fourteen FHCs have security companies; two of fourteen FHCs do not engage in com-mercial banking activities; one FHC is engaged in investment banking; and another FHC is a bills finance company. Most FHCs have banking as their core business, and some have securities, insurance, or bills financing as their core business. Some FHCs are already conducting two core businesses in operations—for example, Fubon, Cathay, Yuanta, Jih
Sun, Skin Kong, and SinoPac Holding Companies (see Appendix Table A1). Thus, we also investigate whether an FHC with a so- called twin-engine or dual-core strategy can improve its overall performance. To capture the effect of dual- core strategies, we first consider three subsidiary dummy variables: Bank, Insurance, and Bills. The relative dummy variables Bank, Insurance, and Bills take the value of 1 if an FHC owns a bank, insurance, or bills subsidiary, respectively, and 0 otherwise. We then add three interaction
term variables (Bank × Insurance, Bank × Bills, and Insurance × Bills) in our regression
model to measure the relation between the dual- core strategy and FHC performance. In the empirical method, we apply the maximum likelihood estimation method for panel data modeling with random effects to estimate coefficients. Because our model has a time- invariant variable, we cannot estimate Equation (1) using a fixed effects estimator. Therefore, we assume that there is no correlation between the regressors and the individual effect and use a random effects estimator. The Hausman test can be used to select between fixed effects and random effects. The null hypothesis of the Hausman test is a random
effect, and an alternative hypothesis is a fixed effect. The c2 result of the Hausman test is
3.267. The null hypothesis of the Hausman test means that random effect is better than the fixed effect. Therefore, using the random effect yields efficient results.
Empirical Results
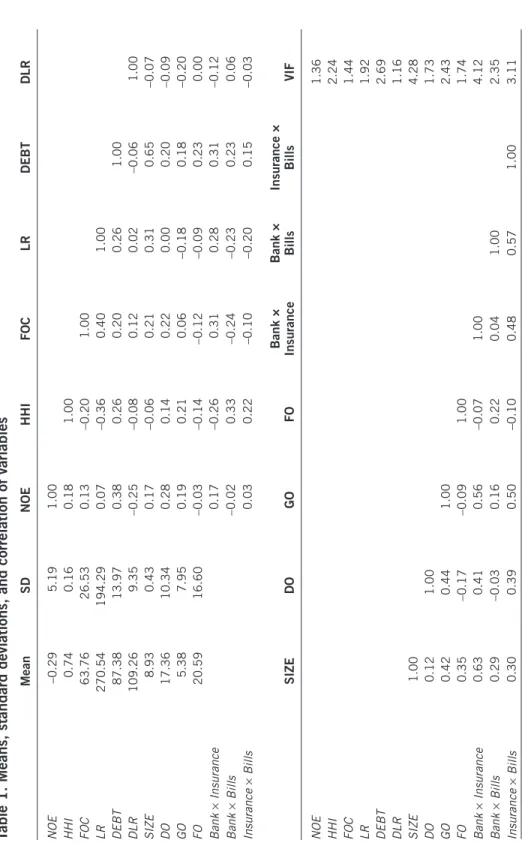
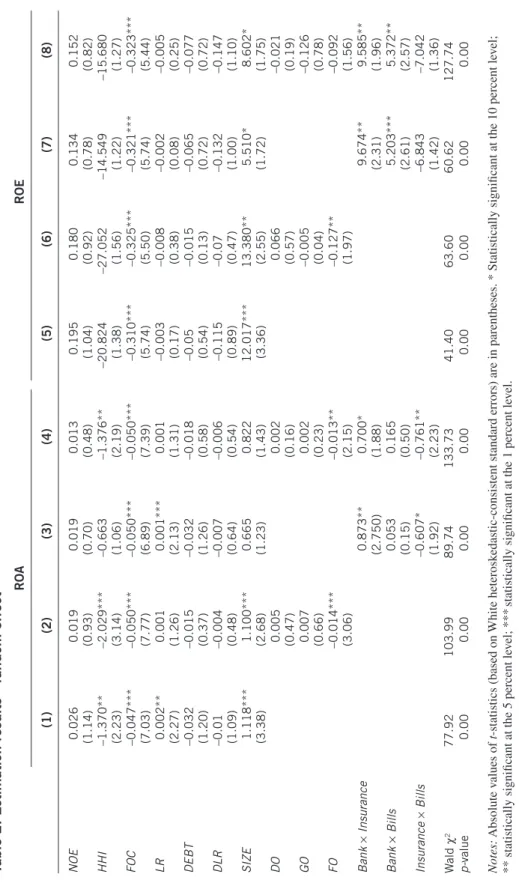
Table 1 summarizes the descriptive statistics. Table 2 reports the regression estimation results. In Table 2, columns (1)–(4) show the estimation for ROA, and columns (5)–(8) show the results for ROE. Models (1) and (5) consider only the financial characteristics of FHCs. Models (2) and (6) add the board and ownership structure indicators. The interac-tion terms of different subsidiary attribuinterac-tion dummies are added in Models (3) and (7). Models (4) and (8) are used to estimate the results of all independent variables.
We first discuss the results of non–operating expenses ratio on FHC performance measures. The estimated coefficients are nonsignificant, irrespective of whether the dependent variable is ROA or ROE. This indicates that the effect of NOE on FHC profit performance is relatively small. Regarding business concentration, only the coefficients of the HHI on ROA are significantly negative. This indicates that an FHC’s business is more concentrated and tends to be less profitable. Thus, FHCs are more profitable when engaged in financial activity that is more diverse and widespread. The SCP hypothesis is not verified.
Regarding the management efficiency indicators, the coefficients of FOC in Table 2 are negative and significant, indicating that if an FHC has a relatively strong profit per-formance, it enjoys a lower FOC. We also find that when the HHI of FHCs is small, their FOC is greater. We can see from Table 1 that the correlation between HHI and FOC is negative. Although FHCs hope that continuing the integration through mergers and acqui-sitions and developing a diverse business model will achieve cross- selling effectiveness, the cultural differences among subsidiaries make the integration more difficult, indicat-ing a significantly positive correlation between business diversification and the financial operational cost rate. To make business diversification achievable for the synergy of cost savings (i.e., the relationship between diversification of operations and the financial operational cost rate is negative), cost control is essential to FHCs.
LR appears significantly positive only in the ROA model. This indicates that an increase in the FHC liquidity ratio tends to raise FHC earning performance based on total assets. Most of the coefficients on SIZE are significantly positive, except Models (3) and (4),
Table 1. Means, standard deviations, and correlation of variables Mean SD NOE HHI FOC LR DEBT DLR NOE –0.29 5.19 1.00 HHI 0.74 0.16 0.18 1.00 FOC 63.76 26.53 0.13 –0.20 1.00 LR 270.54 194.29 0.07 –0.36 0.40 1.00 DEBT 87.38 13.97 0.38 0.26 0.20 0.26 1.00 DLR 109.26 9.35 –0.25 –0.08 0.12 0.02 –0.06 1.00 SIZE 8.93 0.43 0.17 –0.06 0.21 0.31 0.65 –0.07 DO 17.36 10.34 0.28 0.14 0.22 0.00 0.20 –0.09 GO 5.38 7.95 0.19 0.21 0.06 –0.18 0.18 –0.20 FO 20.59 16.60 –0.03 –0.14 –0.12 –0.09 0.23 0.00 Bank × Insurance 0.17 –0.26 0.31 0.28 0.31 –0.12 Bank × Bills –0.02 0.33 –0.24 –0.23 0.23 0.06 Insurance × Bills 0.03 0.22 –0.10 –0.20 0.15 –0.03 SIZE DO GO FO Bank × Insurance Bank × Bills Insurance × Bills VIF NOE 1.36 HHI 2.24 FOC 1.44 LR 1.92 DEBT 2.69 DLR 1.16 SIZE 1.00 4.28 DO 0.12 1.00 1.73 GO 0.42 0.44 1.00 2.43 FO 0.35 –0.17 –0.09 1.00 1.74 Bank × Insurance 0.63 0.41 0.56 –0.07 1.00 4.12 Bank × Bills 0.29 –0.03 0.16 0.22 0.04 1.00 2.35 Insurance × Bills 0.30 0.39 0.50 –0.10 0.48 0.57 1.00 3.11
Table 2. Estimation results—random effect ROA ROE (1) (2) (3) (4) (5) (6) (7) (8) NOE 0.026 (1.14) 0.019 (0.93) 0.019 (0.70) 0.013 (0.48) 0.195 (1.04) 0.180 (0.92) 0.134 (0.78) 0.152 (0.82) HHI –1.370** (2.23) –2.029*** (3.14) –0.663 (1.06) –1.376** (2.19) –20.824 (1.38) –27.052 (1.56) –14.549 (1.22) –15.680 (1.27) FOC –0.047*** (7.03) –0.050*** (7.77) –0.050*** (6.89) –0.050*** (7.39) –0.310*** (5.74) –0.325*** (5.50) –0.321*** (5.74) –0.323*** (5.44) LR 0.002** (2.27) 0.001 (1.26) 0.001*** (2.13) 0.001 (1.31) –0.003 (0.17) –0.008 (0.38) –0.002 (0.08) –0.005 (0.25) DEBT –0.032 (1.20) –0.015 (0.37) –0.032 (1.26) –0.018 (0.58) –0.05 (0.54) –0.015 (0.13) –0.065 (0.72) –0.077 (0.72) DLR –0.01 (1.09) –0.004 (0.48) –0.007 (0.64) –0.006 (0.54) –0.115 (0.89) –0.07 (0.47) –0.132 (1.00) –0.147 (1.10) SIZE 1.118*** (3.38) 1.100*** (2.68) 0.665 (1.23) 0.822 (1.43) 12.017*** (3.36) 13.380** (2.55) 5.510* (1.72) 8.602* (1.75) DO 0.005 (0.47) 0.002 (0.16) 0.066 (0.57) –0.021 (0.19) GO 0.007 (0.66) 0.002 (0.23) –0.005 (0.04) –0.126 (0.78) FO –0.014*** (3.06) –0.013** (2.15) –0.127** (1.97) –0.092 (1.56) Bank × Insurance 0.873** (2.750) 0.700* (1.88) 9.674** (2.31) 9.585** (1.96) Bank × Bills 0.053 (0.15) 0.165 (0.50) 5.203*** (2.61) 5.372** (2.57) Insurance × Bills –0.607* (1.92) –0.761** (2.23) –6.843 (1.42) –7.042 (1.36) W ald c 2 77.92 103.99 89.74 133.73 41.40 63.60 60.62 127.74 value 0.00 0.00 0.00 0.00 0.00 0.00 0.00 0.00 Notes: Absolute v alues of statistics (based on White heterosk
consistent standard errors) are in parentheses. * Statistically significant at the 10
percent le
vel;
**
statistically significant at the 5 percent le
vel; ***
statistically significant at the 1 percent le
indicating that larger FHCs tend to yield more profit.3 In other words, large FHCs
experi-ence economies of scale. Therefore, we suggest that the integration of FHCs promotes economies of scale and creates a greater synergetic effect. The results also show that the coefficients of the debt ratio (DEBT) are nonsignificantly negative effect on ROA.
The coefficients on director ownership (DO) or government ownership (GO) are not statistically significant, implying that an increase in the shares of directors, supervisors, or government does not affect the profitability of FHCs. However, foreign ownership (FO) has a negative significant value in Models (2), (4), and (6), indicating that a greater number of shares of foreign capital tends to yield less profit and worsen the performance of FHCs. This finding is inconsistent with our expectations, and is thus noteworthy. Specifically, if foreign investment pursues only short- term profit rather than long- term investment, government authorities should strengthen the supervision of short- term border capital flow and circumvent potential economic risks.
Finally, we estimate the effect of a dual- core strategy. The coefficients of these estima-tors for the interaction term Bank × Insurance are positive and statistically significant. This indicates that a combination of banks and insurance may be more profitable. The combination of a bills finance company and banks or insurance companies is weaker. In other words, our evidence supports the notion that synergies between commercial banking and insurance companies are stronger. This implies that FHCs with a dual- core strategy including both commercial banks and insurance companies are relatively more profitable. According to the 2010 financial holding operating performance rankings provided by Taiwan Financial Institution Management Association on September 15, 2010, an FHC with commercial banking and insurance companies, such as Fubon and Cathay Holding Companies, is more profitable.
In summary, a well- performing FHC tends to have a lower business concentration (HHI), a lower finance operational cost ratio, a higher liquidity ratio, larger assets, and lower debt ratios. However, an FHC with a rising share in foreign capital tends to have less profit. Moreover, the insurance and banking dual- core strategy has a higher profit performance than the other strategies.
Conclusion
Using an unbalanced panel data set of fourteen FHCs with annual observations from 2001 to 2009, we investigate the determinants of profit performance of financial holding companies, specifically, the effects of the board and ownership structure. The conclusions of this study are summarized as follows: First, FHCs are more profitable when they are associated with more diversified businesses, a lower finance operational cost ratio, a higher liquidity ratio, larger assets, and lower debt ratios. Second, the director or government ownership does not statistically significantly increase FHC profitability, whereas the relationship between foreign ownership and FHC profitability is significantly negative. This shows that raising the share of foreign capital worsens FHC performance. Finally, the dual- core strategy of banking and insurance has a higher profit performance than other strategies. This indicates that an FHC with so- called dual- core strategies, including both commercial banks and insurance companies, generates more profit. Therefore, we suggest that integration of resources between banks and insurance companies generates cross- selling opportunities to create synergy and enhance competitive advantages and improve FHC performance.
Notes
1. Because the Taiwan Financial Holding Group was established in 2008 and was not a listed company, its financial data are limited, and it is excluded from our sample. Thus, our data set comprises only fourteen FHCs.
2. We also conduct analyses including the largest shareholding ratio, which measures the percentage of common shares owned by the largest shareholder, and the result is not statistically significant. Therefore, we abandon this variable in this study.
3. The empirical result is consistent with results obtained by Hu et al. (2009) and Lo and Lu (2009).
References
Adams, R.B.; B.E. Hermalin; and M.S. Weisbach. 2010. “The Role of Boards of Directors in Corporate Governance: A Conceptual Framework and Survey.” Journal of Economic
Litera-ture 48, no. 1: 58–107.
Bauer, P.W.; A.N. Berger; and D.B. Humphrey. 1993. “Efficiency and Productivity Growth in U.S. Banking.” In The Measurement of Productive Efficiency: Techniques and Applications, ed. H.O. Fried, C.A.K. Lovell, and S.S. Schmidt, pp. 386–413. New York: Oxford University Press.
Berger, A.N., and L.J. Mester. 1997. “Inside the Black Box: What Explains Differences in the Efficiencies of Financial Institutions?” Journal of Banking and Finance 21, no. 7: 895–947. Berger, A.N.; I. Hasan; and M. Zhou. 2009. “Bank Ownership and Efficiency in China: What
Will Happen in the World’s Largest Nation?” Journal of Banking and Finance 33, no. 1: 113–130.
Bosworth, W.; S. Mehdian; and T. Vogel. 2003. “Executive Compensation and Efficiency: A Study of Large and Medium Sized Bank Holding Companies.” American Business Review 21, no. 1: 91–99.
Chantapong, S. 2005. “Comparative Study of Domestic and Foreign Bank Performance in Thai-land: The Regression Analysis.” Economic Change and Restructuring 38, no. 1: 63–83. Chen, Y.C.; L. Sun; and C.W. Peng. 2005. “Commercial Banks’ Performance in Taiwan.”
Inter-national Journal of Business Performance Management 7, no. 4: 444–463.
Claessens, S.; A. Demirgüç- Kunt; and H. Huizinga. 2001. “How Does Foreign Entry Affect Domestic Banking Markets?” Journal of Banking and Finance 25, no. 5: 891–911. Hsu, Y.P., and H.C. Chang. 2005. “An Empirical Study on the Operational Efficiency of
Taiwan’s Banking Industry: The Effect of the Financial Holding Company Act.” Review of
Financial Risk Management 1, no. 2: 33–56 (in Chinese).
Hu, W.- C.; M.- C. Lai; and H.- C. Huang. 2009. “Rating the Relative Efficiency of Financial Holding Companies in an Emerging Economy: A Multiple DEA Approach.” Expert Systems
with Applications 36, no. 3 (part 1): 5592–5599.
Lensink, R.; A. Meesters; and I. Naaborg. 2008. “Bank Efficiency and Foreign Ownership: Do Good Institutions Matter?” Journal of Banking and Finance 32, no. 5: 834–844.
Lin, C.-Y., and H.- T. Lee. 2010. “The Bigger the Better? Merger and Acquisition Performance of Financial Holding Corporations: Empirical Evidence from Taiwan.” Emerging Markets
Finance & Trade 46, no. 1: 96–107.
Lin, X., and Y. Zhang. 2009. “Bank Ownership Reform and Bank Performance in China.”
Jour-nal of Banking and Finance 33, no. 1: 20–29.
Liu, S.Y.; S.C. Hsieh; and Y.F. Wen. 2006. “The Analysis of Efficiency of Banks Under Finan-cial Holding Company and Independent Banks in Taiwan.” Taiwan Banking and Finance
Quarterly 7, no. 3: 127–176 (in Chinese).
Lo, S.- F., and W.- M. Lu. 2006. “Does Size Matter? Finding the Profitability and Marketability Benchmark of Financial Holding Companies.” Asia- Pacific Journal of Operational Research 23, no. 2: 229–246.
———. 2009. “An Integrated Performance Evaluation of Financial Holding Companies in Taiwan.” European Journal of Operational Research 198, no. 1: 341–350.
Mester, L.J. 1996. “A Study of Bank Efficiency Taking into Account Risk- Preferences.” Journal
Micco, A.; U. Panizza; and M. Yañez. 2007. “Bank Ownership and Performance. Does Politics Matter?” Journal of Banking and Finance 31, no. 1: 219–241.
Miller, S.M., and A.G. Noulas. 1996. “The Technical Efficiency of Large Bank Production.”
Journal of Banking and Finance 20, no. 3: 495–509.
Pi, L., and S. Timme. 1993. “Corporate Control and Bank Efficiency.” Journal of Banking and
Finance 17, no. 2: 515–530.
Seiford, L.M., and J. Zhu. 1999. “Profitability and Marketability of the Top 55 U.S. Commercial Banks.” Management Science 45, no. 9: 1270–1288.
Shen, C.H. 2002. “CAMEL in Financial Holding Company Banks and Individual Banks: 1997–1998.” Taiwan Banking and Finance Quarterly 3, no. 2: 73–94 (in Chinese). Wang, K.; Y. Peng; and M.Y. Chen. 2007. “A Study on the Efficiency Evaluation of Banks
Under Bank Holding Companies in Taiwan: An Application of DEA Approach.” Journal of
Technology Management 12, no. 2: 1–28.
Yamori, N.; K. Harimaya; and K. Kondo. 2003. “Are Banks Affiliated with Bank Holding Com-panies More Efficient Than Independent Banks? The Recent Experience Regarding Japanese Regional BHCs.” Asia- Pacific Financial Markets 10, no. 4: 359–376.
Yildirim, H.S., and G.C. Philippatos. 2007. “Efficiency of Banks: Recent Evidence from the Transition Economies of Europe, 1993–2000.” European Journal of Finance 13, no. 2: 123–143.
Zahra, S.A., and J.A. Pearce.1989. “Boards of Directors and Corporate Financial Performance: A Review and Integrated Model.” Journal of Management 15, no. 2: 291–334.
Appendix Table A1. The domestic business territory of T aiwanese FHC in 2010 Company name Date established In ve st m en t banking C om m er ci al banking Life insurance Property insurance Security Bills finance company Securities inve st m en t trust
Venture capital company
Futures Capital management Hua Nan December 19, 2001 a,b a a a a Fubon December 19, 2001 a,b a a,b a a a China Development December 28, 2001 a,b a Cathay December 31, 2001 a,b a,b a a a E. Sun January 28, 2002 a,b a a Yuanta February 4, 2002 a,b a,b a a a Mega February 4, 2002 a,b a a a a a Jih Sun February 5, 2002 a,b a,b Taishin February 18, 2002 a,b a a a Skin Kong February 19, 2002 a a,b a,b a W aterland March 26, 2002 a a,b a SinoPac May 9, 2002 a,b a,b a a Chinatrust May 17, 2002 a,b a a First January 2, 2003 a,b a a a a Notes: a = FHC o wns this di vision; b = core b usiness of an FHC.