行政院國家科學委員會專題研究計畫 期中進度報告
關係強度分析之樣本數決定法(1/2)
計畫類別: 個別型計畫 計畫編號: NSC94-2118-M-009-004- 執行期間: 94 年 08 月 01 日至 95 年 07 月 31 日 執行單位: 國立交通大學管理科學系(所) 計畫主持人: 謝國文 報告類型: 精簡報告 處理方式: 本計畫可公開查詢中 華 民 國 95 年 5 月 2 日
Exact interval estimation, power calculation and sample size determination in normal correlation analysis
Gwowen Shieh
Department of Management Science National Chiao Tung University
Hsinchu, Taiwan 30050, ROC Email: [email protected]
Abstract
This article considers the problem of analysis of correlation coefficients from a multivariate normal population. A unified theorem is derived for the regression model with normally distributed explanatory variables and the general results are employed to provide useful expressions for the distributions of simple and multiple correlation coefficients. Inversion principle and monotonicity property of the proposed formulations are used to describe alternative approaches to the exact interval estimation, power calculation and sample size determination for correlation coefficients.
1. Introduction
Correlation analysis is widely used in many areas of science and the literature is very extensive. Classical inferences on correlation coefficients are conducted mainly under the assumption that all variables have a joint multivariate normal distribution. Although the underlying normality assumption provides a convenient and useful setup, the resulting probability density functions of the (sample) simple and multiple correlation coefficients: r and R are notoriously complicated in forms. The complexity incurs continuous investigations to give various expressions, approximations and computing algorithms for the distributions of both sample correlation coefficients. See Johnson et al. (1995, Chapter 32) and Stuart and Ord (1994, Chapter 16) for comprehensive discussions and further details.
The commonly used approximation to the distribution of simple correlation coefficient is Fisher’s (1921) z transformation. Several other approximations and asymptotic expansions are described in Johnson et al. (1995, Chapter 32, Sections 5.2 and 5.3). It appears that the widely used Fisher’s z transformation is adequate for moderate sample sizes and the accuracy generally increases with large sample sizes, whereas the other more accurate approximations require more involved computation and/or iterative evaluation. As in the case of simple correlation coefficient, considerable attention has been devoted to the construction of useful approximations for the distribution of the multiple correlation coefficient (see Johnson et al. 1995, Chapter 32, Section 11). For the purpose of interval estimation, power calculation and sample size determination for squared multiple correlation coefficient, exact results are presented in Algina and Olejnik (2003), Gatsonis and Sampson (1989), Mendoza and Stafford (2001) and Steiger and Fouladi (1992). Although Algina and Olejnik (2003) did not describe their computer algorithms in detail, the exact computations of Gatsonis and Sampson (1989), Mendoza and Stafford (2001) and Steiger and Fouladi (1992) are based on the infinite series expansion of Lee (1972).
In view of the need for evaluating the probabilities of the correlation coefficients and the ultimate aim of presenting exact procedures for correlation analysis, the purpose of this article is to provide alternative solutions by exploiting the simplification of theoretical property and the accessibility of computing techniques. To this end, a unified theorem is derived for the regression model with multinormal explanatory variables. Although the proposed formulations are based on the intermediate results of multinormal regression and correlation analysis in Anderson (2003), Muirhead (1982) and Sampson (1974), the presentations not only simplify the pedagogical development, but also yield new algorithms for the exact inferences of correlation coefficients. Specifically, the inferential procedures of interval estimation and power calculation in the hypothesis testing situation for simple, multiple and partial-multiple correlations are described. Furthermore, the planning of sample sizes with estimation and power approaches are also discussed.
In the next section, the major theorem and corollary for the multivariate normal regression model are given. Section 3 applies the proposed formulation to the analysis of simple correlation coefficient. The presentation is extended to multiple correlation coefficient in Section 4. Finally, Section 5 contains some concluding remarks.
2. The Multivariate Normal Regression Model
Consider the standard multiple linear regression model with dependent variable Y and all the levels of p independent variables X(1), ..., X(p) fixed a priori:
Y = Xβ + ε, (1)
where Y = (Y1, ..., YN)T, Yi is the value of the dependent variable Y; X = (1N, XD) with 1N is the
N × 1 vector of all 1’s, XD = (X1, ..., XN)T is often called the design matrix, Xi = (xi1, ..., xip)T,
xi1, ..., xip are the known constants of the p independent variables for i = 1, ..., N; β = (β0,
N(0, σ2) random variables. It is well known that under the assumption given above, the likelihood ratio test for the general linear hypothesis H0: Lβ = θ versus H1: Lβ ≠ θ is based on
F = SSE/(N − p − 1) , SSH/l
where L is a l × (p + 1) coefficient matrix of rank l ≤ p + 1, θ is a l × 1 vector of constants,
SSH = (Lβ^ − θ)T[L(XTX)−1LT]−1(Lβ^ − θ), SSE = (Y − Xβ^)T(Y − Xβ^), and β^ = (XTX)−1XTY is the least squares and maximum likelihood estimator of β. Under the alternative hypothesis,
F is distributed as F(l, N − p − 1, Ξ), the noncentral F-distribution with l and N − p − 1
degrees of freedom and noncentrality parameter Ξ = (Lβ − θ)T
[L(XTX)−1LT]−1(Lβ − θ)/σ2.
If the null hypothesis is true, then Ξ = 0 and F is distributed as F(l, N − p − 1), a central or regular F-distribution with l and N − p − 1 degrees of freedom. The test is carried out by rejecting H0 if F > Fl, N – p – 1, α, where Fl, N – p – 1, α is the upper α percentage point of the central
F-distribution F(l, N − p − 1).
Frequently, the inferences are concerned mainly with the regression coefficients β1 = (β1, ..., βp)T and the corresponding coefficient matrix is written in the form of L = L1, where
L1 = (0c, C), 0c is the c × 1 null vector of all 0’s and C is a c × p coefficient matrix of rank c ≤
p. It follows from the overall estimator β^ given above that the prescribed estimator for β1 can
be expressed as β^1 = (XTCXC)−1X
T
CY, where XC = (IN − J/N)XD is the centered form of XD, IN
is the identity matrix of dimension N and J is the N × N square matrix of 1’s. With this formulation, it is easily seen that
Cβ^1 ~ Np(Cβ1, σ2CS −1 XC T ), where SX = X T
CXC. Note that σ^2 = SSE/(N − p − 1) is the usual unbiased estimator of σ
2 and
SSE/σ2 is distributed as χ2(N − p − 1), a chi-square distribution with N − p − 1 degrees of
freedom and is independent of β^. It therefore follows that the general linear hypothesis reduces to H0: Cβ1 = θ versus H1: Cβ1 ≠ θ and the F test is conducted by rejecting H0 if F* >
Fc, N – p – 1, α, where
F* = SSE/(N − p − 1) , (2) SSH*/c
SSH* = (Cβ^1 − θ)T(CS−1X CT)−1(Cβ^1 − θ). Consequently, F* is distributed as F(c, N − p − 1, ∆), where noncentrality parameter ∆ = (Cβ1 − θ)T
(CS−1X CT)−1(Cβ1 − θ)/σ
2
. Hence, given all model specifications and sample size N, the statistical power achieved for testing hypothesis H0: Cβ1 = θ with specified significance level α against the alternative H1: Cβ1 ≠ θ is the probability
P{F(c, N − p − 1, ∆) > Fc, N – p – 1, α}. (3)
In the special instance of testing one single coefficient parameter, say H0: β1 = 0, it is more flexible to conduct the test with a t statistic since it can be used for one-sided alternatives involving H0: β1 ≤ 0 or H0: β1 ≥ 0, while the F statistic cannot. Specifically, the t statistic is
t* = β^1
(σ^2
s11)1/2
(4)
where s11 is the (1, 1)th entry of S−1X and t* has a noncentral t distribution t(N − p − 1, δ) with
N − p − 1 degrees of freedom and noncentrality parameter δ = β1/(σ2s11)1/2. The corresponding power function is of the form:
P{t(N − p − 1, δ) > tN – p – 1, α}. (5)
for one-sided test H0: β1 ≤ 0 with significance level α, where tN – p – 1, α is the upper α percent
quantile of the central t-distribution t(N − p − 1). See Rencher (2000, Chapters 7-8) for further details.
Traditionally, the multiple regression model defined above is referred to as a fixed (conditional) model. The results would be specific to the particular values of the explanatory variables that are observed or preset by the researcher. To extend the concept and applicability of the aforementioned results to the correlation models, the vector of explanatory variables {Xi, i = 1, ..., N} in (1) is now assumed to follow a joint multivariate normal distribution with
a mean vector µX and a positive definite covariance matrix ΣX. It follows immediately from
the matrix normal distribution of XD that SX has a Wishart distribution Wp(N − 1, ΣX). As
shown in Sampson (1974, Lemmas 3 and 4), (CS−1X CT)−1 ~ Wc(N − p + c − 1, (CΣ
−1 X C T )−1) and subsequently, ∆ ~ Λ·χ2 (N − p + c − 1), where Λ = (Cβ1 − θ)T(CΣ−1XCT)−1(Cβ1 − θ)/σ 2 . Therefore, the distribution of F* in the multivariate normal regression model is completely specified in the following theorem.
Theorem 1. Consider the multiple regression model (1) and Xi are independent and identically
distributed as Np(µX, ΣX), i = 1, ..., N. The F* statistic defined in (2) has the following
two-stage distribution
F*| ∆ ~ F(c, N − p − 1, ∆) and ∆ ~ Λ·χ2(N − p + c − 1). (6) Note that the formulation (6) also follows from the intermediate results for deriving the density function of R2 in Anderson (2003, Theorem 4.4.5) and Muirhead (1982, Theorem 5.2.4). However, the expression in Theorem 1 provides a conceptually more transparent representation than those in Theorem 9 and Corollary 2 of Sampson (1974) where the distribution of F* is expressed as a mixture of central F distributions with random degrees of freedom for the numerator. It is clear under the null hypothesis H0: Cβ1 = θ that Λ = 0 and ∆ degenerates at 0. Hence, the null distribution of F* remains as F(c, N − p − 1) under both fixed and random settings. However, the power function is more complex than (3) in form due to the extra variability of ∆:
P{F* > Fc, N – p – 1, α} = ⌡⌠
0 ∞
P{F(c, N − p − 1, Λ·K) > Fc, N – p – 1, α}·f(K)dK, (7)
where f(K) is the pdf of K and K ~ χ2(N − p + c − 1). Following similar arguments, it can be shown that the noncentrality δ of the distribution for t* statistic defined in (4) has a scaled chi-square distribution: δ ~ λ·{χ2
(N − p)}1/2, where λ = β1/(σ2σ11)1/2 and σ11 is the (1, 1)th entry of Σ−1X . Note that σ11
/s11 ~ χ2(N − p). These results are summarized as:
Corollary 1. Consider the multiple regression model (1) and Xi are independent and
identically distributed as Np(µX, ΣX), i = 1, ..., N. The t* statistic defined in (4) has the
following two-stage distribution
t*| δ ~ t(N − p − 1, δ) and δ ~ λ·{χ2(N − p)}1/2. (8) Thus, the t* statistic for H0: β1 ≤ 0 has null distribution t(N − p − 1) and critical value
tN – p – 1, α as in the fixed model. Its power can be computed from
P{t* > tN – p – 1, α} = ⌡⌠
0 ∞
P{t(N − p − 1, λ·κ1/2) > tN – p – 1, α}·f(κ)dκ, (9)
where f(κ) is the pdf of κ and κ ~ χ2
(N − p). To exemplify the fundamental differences between the fixed and random model formulations, a direct comparison of the previously defined power functions (5) and (9) shows that the former can be viewed as a realization of the latter based on the observed values of SX. Consequently, the result would be specific to the
particular values of the explanatory variables that are observed in SX. In another replication of
the same study, different settings for the explanatory variables will be obtained. Hence, the conditional power function is not applicable and more importantly, the fixed modeling approach is not appropriate. The preceding results will be applied later to implement varieties of interval estimation and power calculation in the context of correlation models.
3. Simple correlation coefficient
The relation between multivariate normal regression model and correlation analysis is well known (see Anderson, 2003; Muirhead, 1982; Rencher, 2000). Assume that r is the Pearson product-moment correlation coefficient of (Yi, Xi), i = 1, ..., N, where (Yi, Xi) has a
joint bivariate normal distribution N2(µ, Σ) with
µ = ⎣⎢⎡µµYX⎦⎥⎤ and Σ = ⎣ ⎢ ⎡ ⎦ ⎥ ⎤ σ2 Y σYX σYX σ 2 X .
The corresponding population correlation coefficient is defined as ρ = σYX/σYσX. It follows
from standard results that conditional multivariate normal correlation models are equivalent to the usual normal error regression models with the following definitions of notation:
β0 = µY − ρµX(σY/σX), β1 = ρ(σY/σX), and σ2 = σ
2
Y(1 − ρ
2 ).
In the special case of p = 1, it is familiar that the reduced t* statistic can be expressed directly in term of r
t1 = r N − 2 1 − r2 .
Additionally, the test of ρ ≤ 0 amounts to the test of β1 ≤ 0 since β1 = ρ(σY/σX). More
importantly, it follows from (8) in Corollary 1 that the distribution of t1 can be represented as
t1| δ1 ~ t(N − 2, δ1) and δ1 ~ λ1·{χ2(N − 1)}1/2,
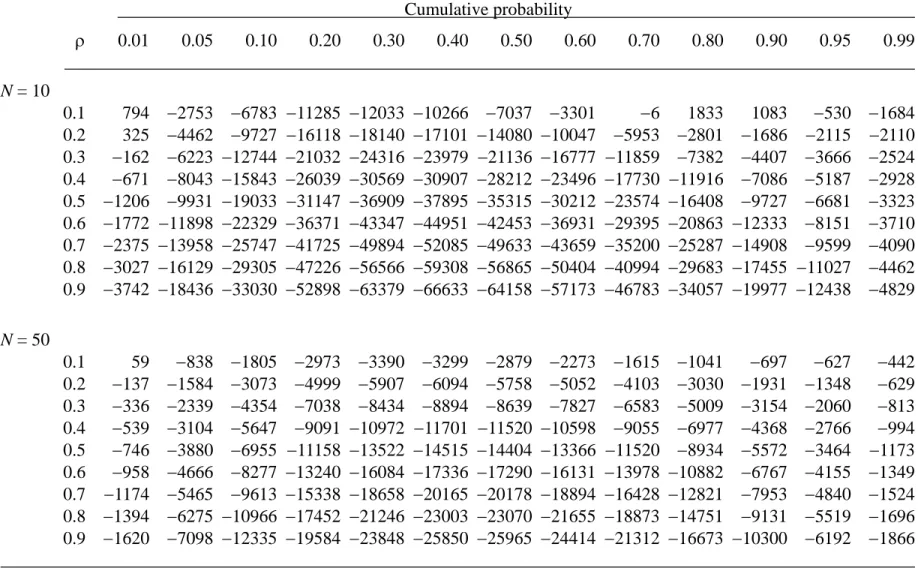
where λ1 = ρ/(1 − ρ2)1/2. To demonstrate the discrepancy between the proposed exact formulation and approximate method and the advantage of the suggested simplifying algorithm, numerical comparisons are conducted to evaluate the widely used Fisher’s (1921) z approximation to the distribution function of simple correlation r. The exact values are computed with the proposed two-stage formulation using programs written with SAS/IML (2003). The results are presented in Table 1 for sample size N = 10 and N = 50. As expected, the inverse tanh transformation of Fisher (1921) is not sufficiently close to the true
distribution of r. However, the performance improves for tail areas and larger sample sizes. Accordingly, the test of H0: ρ ≤ 0 can be conducted by rejecting H0 if t1 > tN – 2, α. The
associated power function is a direct adaptation of (9):
P{t1 > tN – 2, α} = ⌡⌠
0 ∞
P{t(N − 2, λ1·κ1/2) > tN – 2, α}·f(κ)dκ,
where f(κ) is the pdf of κ and κ ~ χ2
(N − 1). The numerical computation of exact power requires the evaluation of a noncentral t cdf and the one-dimensional integration with respect to a chi-square pdf . Since all related functions are readily embedded in modern statistical packages such as the SAS system, no substantial computing efforts are required. For the purpose of sample size determination, the minimum sample sizes N required for testing the hypothesis H0: ρ ≤ 0 with specified parameter value of ρ, significance level and nominal power, can be found through a simple iterative search. Note that unique and proper solution of sample size is assured by the monotonicity properties described in Ghosh (1973). The procedures require only obvious modifications for both lower-tailed and two-sided tests.
Interval estimators of ρ can be constructed by the “statistical method” of Mood, Graybill and Boes (1974, Section 4.2) or the “pivoting the cdf ” method in Casella and Berger (2002, Section 9.2.3). For the upper-tailed test just mentioned, the corresponding lower 100(1 − α)% confidence interval of ρ is of the form [−1, ρU) in which ρU (≤ 1) satisfies
⌡ ⌠ 0 ∞ P{t(N − 2, λ1U·κ1/2) > t1O}·f(κ)dκ = 1 − α, where λ1U = ρU/(1 − ρ 2 U)1/2, t1O = rO(N − 2)1/2/(1 − r 2
O)1/2, and rO is the observed value of the
simple correlation coefficient. The computations can be easily performed by a standard interval-halving program to meet the desired degree of accuracy. In connection with the interval procedure, it is also critical to ensure adequate estimation accuracy with appropriate sample size. For given values of population correlation coefficient ρ, coverage probability 1 −
α, and the bound b (> 0), the smallest sample size N required for the sample correlation coefficient to fall into the interval [−1, ρ + b) with probability 1 − α, is determined by
⌡ ⌠ 0 ∞ P{t(N − 2, λ1·κ1/2) < t1U}·f(κ)dκ ≥ 1 − α, where λ1 = ρ/(1 − ρ2 )1/2, t1U = rU(N − 2)1/2/(1 − r 2 U) 1/2
, and rU = ρ + b < 1. For the purpose of
illustration, the minimum sample sizes needed to control the prescribed interval [−1, ρ + b) with coverage probability at least 0.95 are presented in Table 2 for values of ρ ranging from 0 to 0.95 with an increment of 0.05 and b = 0.05, 0.10, 0.15 and 0.20. Similarly, the cases of upper and two-sided 100(1 − α)% interval estimation and related sample size calculation can be conducted.
4. Multiple Correlation Coefficients
This section describes the methods for multiple correlation analysis in the light of the general result given in Theorem 1 for multivariate normal regression models. Without loss of generality, let (Yi, X
T
i)T, i = 1, ..., N, represent the variables in a multivariate correlation model
and have a joint (p + 1)-dimensional multivariate normal distribution Np + 1(µ, Σ), where Xi =
(Xi1, ..., Xip)T, µ = ⎣⎢⎡µµYX⎦⎥⎤ and Σ = ⎣⎢ ⎡ ⎦ ⎥ ⎤ σ2 Y ΣYX ΣT YX ΣX .
One major use of multivariate correlation models is to make inferences on the association between variables Yi and Xi. A useful measure is the population squared multiple correlation
coefficient defined as R−2 = ΣYXΣ −1 XΣ T YX/σ 2
Y and the population multiple correlation coefficient
R− is the positive square root of R−2. The usual sample squared multiple correlation coefficient is denoted by R2 = SYXS −1 X S T YX/s 2 Y, where SYX = YT(IN − J/N)XD and s 2 Y = YT(IN − J/N)Y. As in
the previous case of simple correlation analysis, the following definitions of notation connect the correlation model of multinormal variables with the multivariate normal regression model: β0 = µY − ΣYXΣ −1 X µX, β1 = Σ −1 X Σ T YX, and σ 2 = σ2 Y − ΣYXΣ −1 X Σ T
YX. Furthermore, assume the
coefficient matrix C = Ip and θ = 0p in the linear hypothesis of H0: Cβ1 = θ, then several simplification and implication follow from Theorem 1. In particular, Λ turns into Λ1 =
βT
1ΣXβ1/σ2 = R−2/(1 − R−2), the population squared multiple correlation coefficient defined
above becomes a one-to-one function of the noncentrality Λ1. It leads to the well known result
that the overall test of regression coefficients H0: β1 = 0p is equivalent to the test H0: R
−2 = 0.
Hence, the inference of R−2 can be accomplished with the simplified F* statistic:
F1 = R
2 /p
(1 − R2)/(N − p − 1)
and the test H0: R−2 = 0 is rejected if F1 > Fp, N – p – 1, α. It is evident from (6) and (7) that
F1| ∆1 ~ F(p, N − p − 1, ∆1) and ∆1 ~ Λ1·χ2(N − 1), and the power function of F1 can be written as
P{F1 > Fp, N – p – 1, α} = ⌡⌠
0 ∞
P{F(p, N − p − 1, Λ1·K1) > Fp, N – p – 1, α}·f(K1)dK1,
where Λ1 = R−2/(1 − R−2), f(K1) is the pdf of K1 and K1 ~ χ2(N − 1).
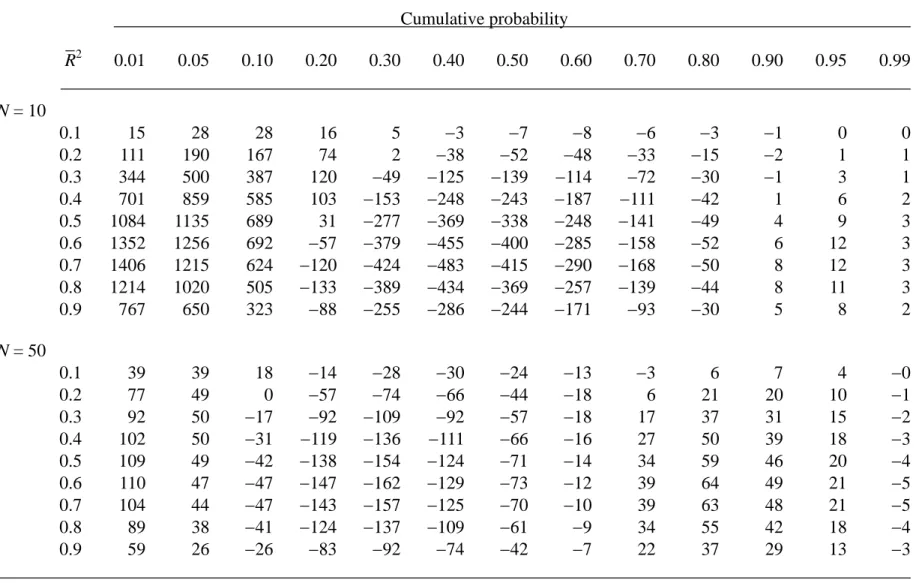
For comparative purpose, the suggested simplifying formulation is employed to investigate the accuracy of Lee’s (1971, Section 5.1) F approximation to the distribution function of R2 for different values of p and N. Table 3 contains the errors corresponding to Lee’s F transformation for p = 3 with N = 10 and 50. The numerical results suggest that Lee’s
F transformation for the distribution of R2 is considerably more accurate than the aforementioned Fisher’s z approximation to the distribution of r. To some extent the performance still varies with the sample size N and the number of parameters p. When p = 3
and N = 10, there are some cases in Table 3 that give comparatively large errors than other situations. This phenomenon shall continue to exist in other approximations with relatively small p and small N.
The power and sample size calculations can be performed in a similar fashion as in the instance of simple correlation coefficient by the direct substitution of noncentral t distribution with the noncentral F distribution. It is important to note that the family of noncentral F distributions possesses the same monotonicity properties as those of the family of noncentral t distribution (see Ghosh, 1973).
By pivoting the cdf, a 100(1 − α)% one-sided confidence intervals of R−2
in the form of
[0, R−2U) can be computed by solving the following equation for R
−2 U: ⌡ ⌠ 0 ∞ P{F(p, N − p − 1, Λ1U·K1) > F1O}·f(K1)dK1 = 1 − α where Λ1U = R −2 U/(1 − R− 2 U), F1O = {(N − p − 1)/p}{R 2 O/(1 − R 2 O)}, and R 2
O is the observed value
of squared multiple correlation coefficient. However, proper positive values of R−2U are found
only if F1O > Fp, N – p – 1, 1 − α. Additionally, it is of interest to consider the planning of sample
sizes for interval estimation with the prescribed length and desired accuracy. With the
specified quantities of population squared multiple correlation coefficient R−2, target probability 1 − α, and the bound b (> 0), the minimum sample size N required for the interval
[0, R−2 + b) with coverage probability at least 1 − α can be computed from
⌡ ⌠ 0 ∞ P{F(p, N − p − 1, Λ1·K1) < F1U}·f(K1)dK1 ≥ 1 − α, where Λ1 = R−2/(1 − R−2), F1U = {(N − p − 1)/p}{R− 2 U/(1 − R− 2 U)}, R −2 U = R −2 + b < 1. For
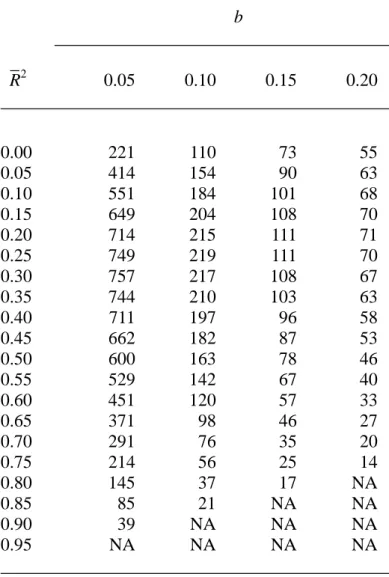
+ b) with coverage probability at least 0.95 and p = 5 are presented in Table 4 for R−2 ranges from 0 to 0.95 with an increment of 0.05 and b = 0.05, 0.10, 0.15 and 0.20. Furthermore, the extensions for the upper and two-sided 100(1 − α)% interval estimation and related sample size determination are straightforward.
5. Conclusions
This article presents a simplified treatment of multivariate normal regression models that are tied to correlation models with multinormal variables. A full range of exact methods for correlation analysis are then considered. The proposed results are notable in the conceptual clarity of formulations for the well known but complicated distributions of simple and multiple correlations. Consequently, the suggested procedures provide alternative approaches to perform normal correlation analysis in conjunction with basic computation techniques that require only standard numerical methods of one-dimensional integration and interval-halving algorithm. The integration is theoretically exact provided that the auxiliary functions can be evaluated exactly. The essential part involves the auxiliary functions of noncentral t and F and central χ2
References
Algina, J., & Olejnik, S. (2003). Sample size tables for correlation analysis with applications in partial correlation and multiple regression analysis. Multivariate Behavioral Research,
38, 309-323.
Anderson, T. W. (2003). An introduction to multivariate statistical analysis (3rd ed.). New York: Wiley.
Casella, G., & Berger, R. L. (2002). Statistical inference (2nd ed.). Pacific Grove, CA: Duxbury.
Fisher, R. A. (1921). On the probable error of a coefficient of correlation deduced from a small sample. Metron, 1, 3-32.
Gatsonis, C., & Sampson, A. R. (1989). Multiple correlation: Exact power and sample size calculations. Psychological Bulletin, 106, 516-524.
Ghosh, B. K. (1973). Some monotonicity theorems for χ2
, F and t distributions with applications. Journal of the Royal Statistical Society, Series B, 35, 480-492.
Johnson, N. L., Kotz, S., & Balakrishnan, N. (1995). Continuous univariate distributions (2nd ed., Vol. 2). New York: Wiley.
Lee, Y. S. (1971). Some results on the sampling distribution of the multiple correlation coefficient. Journal of the Royal Statistical Society, Series B, 33, 117-129.
Lee, Y. S. (1972). Tables of upper percentage points of the multiple correlation coefficient.
Biometrika, 59, 175-189.
Mendoza, J. L., & Stafford, K. L. (2001). Confidence interval, power calculation, and sample size estimation for the squared multiple correlation coefficient under the fixed and random regression models: A computer program and useful standard tables. Educational and
Psychological Measurement, 61, 650-667.
Mood, A. M., Graybill, F. A., & Boes, D. C. (1974). Introduction to the theory of statistics (3rd ed.). New York: McGraw-Hill.
Muirhead, R. J. (1982). Aspects of multivariate statistical theory. New York: Wiley. Rencher, A. C. (2000). Linear models in statistics. New York: Wiley.
Sampson, A. R. (1974). A tale of two regressions. Journal of the American Statistical
Association, 69, 682-689.
SAS Institute (2003). SAS/IML user’s guide, Version 8. Carey, NC: author.
Steiger, J. H., & Fouladi, R. T. (1992). R2: A computer program for interval estimation, power calculations, sample size estimation, and hypothesis testing in multiple regression.
Behavioral Research Methods, Instruments, and Computers, 24, 581-582.
Stuart, A., & Ord, J. K. (1994). Kendall’s advanced theory of statistics (6th ed., Vol. 1). New York: Halsted Press.
Table 1. The error = 106 × (approximate value − exact value) of Fisher’s z approximation to the distribution function of r. Cumulative probability ρ 0.01 0.05 0.10 0.20 0.30 0.40 0.50 0.60 0.70 0.80 0.90 0.95 0.99 N = 10 0.1 794 −2753 −6783 −11285 −12033 −10266 −7037 −3301 −6 1833 1083 −530 −1684 0.2 325 −4462 −9727 −16118 −18140 −17101 −14080 −10047 −5953 −2801 −1686 −2115 −2110 0.3 −162 −6223 −12744 −21032 −24316 −23979 −21136 −16777 −11859 −7382 −4407 −3666 −2524 0.4 −671 −8043 −15843 −26039 −30569 −30907 −28212 −23496 −17730 −11916 −7086 −5187 −2928 0.5 −1206 −9931 −19033 −31147 −36909 −37895 −35315 −30212 −23574 −16408 −9727 −6681 −3323 0.6 −1772 −11898 −22329 −36371 −43347 −44951 −42453 −36931 −29395 −20863 −12333 −8151 −3710 0.7 −2375 −13958 −25747 −41725 −49894 −52085 −49633 −43659 −35200 −25287 −14908 −9599 −4090 0.8 −3027 −16129 −29305 −47226 −56566 −59308 −56865 −50404 −40994 −29683 −17455 −11027 −4462 0.9 −3742 −18436 −33030 −52898 −63379 −66633 −64158 −57173 −46783 −34057 −19977 −12438 −4829 N = 50 0.1 59 −838 −1805 −2973 −3390 −3299 −2879 −2273 −1615 −1041 −697 −627 −442 0.2 −137 −1584 −3073 −4999 −5907 −6094 −5758 −5052 −4103 −3030 −1931 −1348 −629 0.3 −336 −2339 −4354 −7038 −8434 −8894 −8639 −7827 −6583 −5009 −3154 −2060 −813 0.4 −539 −3104 −5647 −9091 −10972 −11701 −11520 −10598 −9055 −6977 −4368 −2766 −994 0.5 −746 −3880 −6955 −11158 −13522 −14515 −14404 −13366 −11520 −8934 −5572 −3464 −1173 0.6 −958 −4666 −8277 −13240 −16084 −17336 −17290 −16131 −13978 −10882 −6767 −4155 −1349 0.7 −1174 −5465 −9613 −15338 −18658 −20165 −20178 −18894 −16428 −12821 −7953 −4840 −1524 0.8 −1394 −6275 −10966 −17452 −21246 −23003 −23070 −21655 −18873 −14751 −9131 −5519 −1696 0.9 −1620 −7098 −12335 −19584 −23848 −25850 −25965 −24414 −21312 −16673 −10300 −6192 −1866
Table 2. The minimum sample sizes required for the prescribed interval
[−1, ρ + b) of simple correlation coefficient with coverage probability at least 0.95 b ρ 0.05 0.10 0.15 0.20 0.00 1084 272 122 69 0.05 1074 269 120 68 0.10 1054 262 117 66 0.15 1023 254 112 63 0.20 982 243 107 60 0.25 932 229 100 56 0.30 874 214 93 52 0.35 808 197 85 47 0.40 736 178 77 42 0.45 658 158 68 37 0.50 578 138 58 32 0.55 495 117 49 26 0.60 411 96 40 21 0.65 330 76 31 16 0.70 252 57 23 12 0.75 180 40 15 8 0.80 117 25 9 NA 0.85 65 13 NA NA 0.90 26 NA NA NA 0.95 NA NA NA NA
Table 3. The error = 106 × (approximate value − exact value) of Lee’s F approximation to the distribution function of R2 when p = 3. Cumulative probability R−2 0.01 0.05 0.10 0.20 0.30 0.40 0.50 0.60 0.70 0.80 0.90 0.95 0.99 N = 10 0.1 15 28 28 16 5 −3 −7 −8 −6 −3 −1 0 0 0.2 111 190 167 74 2 −38 −52 −48 −33 −15 −2 1 1 0.3 344 500 387 120 −49 −125 −139 −114 −72 −30 −1 3 1 0.4 701 859 585 103 −153 −248 −243 −187 −111 −42 1 6 2 0.5 1084 1135 689 31 −277 −369 −338 −248 −141 −49 4 9 3 0.6 1352 1256 692 −57 −379 −455 −400 −285 −158 −52 6 12 3 0.7 1406 1215 624 −120 −424 −483 −415 −290 −168 −50 8 12 3 0.8 1214 1020 505 −133 −389 −434 −369 −257 −139 −44 8 11 3 0.9 767 650 323 −88 −255 −286 −244 −171 −93 −30 5 8 2 N = 50 0.1 39 39 18 −14 −28 −30 −24 −13 −3 6 7 4 −0 0.2 77 49 0 −57 −74 −66 −44 −18 6 21 20 10 −1 0.3 92 50 −17 −92 −109 −92 −57 −18 17 37 31 15 −2 0.4 102 50 −31 −119 −136 −111 −66 −16 27 50 39 18 −3 0.5 109 49 −42 −138 −154 −124 −71 −14 34 59 46 20 −4 0.6 110 47 −47 −147 −162 −129 −73 −12 39 64 49 21 −5 0.7 104 44 −47 −143 −157 −125 −70 −10 39 63 48 21 −5 0.8 89 38 −41 −124 −137 −109 −61 −9 34 55 42 18 −4 0.9 59 26 −26 −83 −92 −74 −42 −7 22 37 29 13 −3
Table 4. The minimum sample sizes required for the prescribed interval
[0, R−2 + b) of squared multiple correlation coefficient with coverage probability at least 0.95 and p = 5 b R−2 0.05 0.10 0.15 0.20 0.00 221 110 73 55 0.05 414 154 90 63 0.10 551 184 101 68 0.15 649 204 108 70 0.20 714 215 111 71 0.25 749 219 111 70 0.30 757 217 108 67 0.35 744 210 103 63 0.40 711 197 96 58 0.45 662 182 87 53 0.50 600 163 78 46 0.55 529 142 67 40 0.60 451 120 57 33 0.65 371 98 46 27 0.70 291 76 35 20 0.75 214 56 25 14 0.80 145 37 17 NA 0.85 85 21 NA NA 0.90 39 NA NA NA 0.95 NA NA NA NA