資料探勘為基礎之物流中心訂單管理系統發展
摘要: 本計畫除了應用資料探勘技術建構物流中心訂單管理模式,此模式可以協助 物流中心瞭解產品訂購之時機、訂購產品之訂單與顧客的屬性及產品訂購序列特 徵,期望藉由掌握訂單需求與減少緊急插單,以降低訂單別揀貨頻次與訂單需求 不確定性之影響,進而達成提升訂單批次揀貨效能及主動瞭解顧客需求之目的。 在物流中心的作業中,揀貨是最耗費時間與人力的作業,過去的相關研究指出, 妥善規劃儲位指派方法可以減少揀貨路徑與時間,因此,本計畫並以資料探勘方 法-關聯分析為基礎,發展三種儲位指派的啟發式方法,三種方法的邏輯是將經 常被一起訂購的商品盡可能指派至同一倉儲走道中。本報告說明本計畫所發展之 三種儲位指派的啟發式方法。第一種方法為資料探勘基礎之儲位指派方法(data mining-based storage assignment approach, DMSA),屬於適應性(adaptive)的方法, 該方法是僅針對揀貨區內需要補貨的商品進行儲位指派,而第二及第三種方法為 改良式分級基礎啟發方法(modified class-based heuristic, MCBH)及關聯種子基礎 啟發方法(association seed based heuristic, ASBH),此二種方法旨在重新規劃揀貨 區內之所有商品儲位。本計畫也基於關聯分析提出二種衡量商品相關性的指標用以表示商品被同時購買的關係強度,一為關聯指數(association index, AIX),另一
為加權支持度計數(weighted support count, WSC)。本計畫最後以一食品雜貨之物 流中心的資料,模擬與分析導入三種啟發式方法所帶來的效益。
關鍵詞:倉儲作業、儲位指派、揀貨、資料探勘、關聯法則
Abstract:
In this study, data mining techniques are applied to establish an order management model for distribution centers (DCs), which can aid DCs to realize the timing of product purchasing, the properties of customers and orders of purchased products, and the sequential characteristics of purchased products. The developed model attempts to acquire the order demand and decrease rush orders, which can decrease the frequency of single-order picking and the effect caused by order demand uncertainty, and then increase the frequency of batch picking and understand the customers’ needs actively. Among distribution center operations, order picking has been reported to be the most labor-intensive activity. Sophisticated storage assignment policies adopted to reduce the travel distance of order picking have been explored in the literature. In addition, this study proposes an adaptive approach, the data mining-based storage assignment approach (DMSA), and two overall re-allocating approaches, the modified class-based heuristic (MCBH) and association seed based heuristic (ASBH). This report describes the three proposed storage assignment approaches. DMSA aims to find the optimal storage assignment for newly delivered
products requiring putting away. MCBH and ASBH are developed to improve order picking by re-allocating all products. Three approaches allocate the pair of products that most frequently appear in the same customer orders to the same aisle. In addition, two association measures, association index (AIX) and weighted support count (WSC), based on association rule mining are developed to present the relationship of products in these three approaches. The three proposed approaches are implemented with a real dataset from a grocery distribution center.
Keywords: Warehousing; Storage Assignment; Order Picking; Data Mining; Association Rule
Contents
1. Introduction ... 1
2. Research Objectives ... 3
3. Literature Review ... 4
4. The Heuristic Storage Assignment Approaches Based on Association Rule Mining ... 8
4.1 Association rule mining and weighted support count ... 8
4.2 Data mining-based storage assignment approach (DMSA)... 9
4.2.1 Stage 1: Perform association rule mining ... 10
4.2.2 Stage 2: Develop association index (AIX) ... 11
4.2.3 Stage 3: Formulate and solve the storage assignment model ... 11
4.3 Modified class-based heuristic (MCBH) ... 12
4.4 Association seed based heuristic (ASBH) ... 14
5. Experimental Design and Analysis ... 18
5.1 Dataset ... 18
5.2 Experimental settings ... 18
5.3 Results and analysis of DMSA ... 19
5.4 Results and analysis of MCBH and ASBH ... 22
6. Conclusion ... 26
Tables
Table 1 Notation of DMSA 10
Table 2 Notation of MCBH and ASBH 13
Table 3 The experiment settings 21
Table 4 The result of the 36 experiments 21
Table 5 The ANOVA table of the experiments 22
Table 6 The travel distance and computation time of allocation by MCBH
with December orders 23
Table 7 Comparisons of travel distance between CBAA and MCBH 23 Table 8 The ANOVA table of the experiment with MCBH 23 Table 9 Comparisons of travel distance between CBAA and ASBH 24
Figures
Figure 1 The framework of proposed DMSA approach ... 10 Figure 2 Flowchart of MCBH ... 15 Figure 3 Flow chart of ASBH ... 16 Figure 4 Illustration of the layout and S-shape picking strategy in the
1. Introduction
Due to the rapidly changing preferences of customers, customer orders increasingly exhibit characteristics of higher product variety, smaller order size, and reliably shorter response time (Li, 2007). Such changes to order patterns challenge the efficiency of warehousing order fulfillment processes in today’s highly competitive market. Major warehousing activities include receiving, putting away, storing, order picking, sorting, and shipping. Among these activities, order picking is the most labor-intensive operation in warehouses with manual systems (Koster et al., 2007) and normally accounts for 55% of warehouse operating expenses (Tompkins et al., 1996). In addition, the service level at a warehouse is also directly relevant to the operation of order picking. Due to the labor-intensive and highly changeable nature of modern warehouse operations, order picking may become a bottleneck for satisfying customer orders in a timely manner. Hence, improving picking efficiency may achieve a higher service level by creating a shorter picking distance, a lower labor cost by employing fewer pickers, or both.
In previous studies, four methods were used to reduce the pickers’ travel time or distance: 1) determining the order picking route appropriately; 2) zoning the warehouse; 3) assigning products to suitable storage locations; and 4) assigning orders to batches (Roodbergen and Koster, 2001). Although different approaches can be applied to achieve the objective, storage assignment plays an essential and important role in warehousing activity, and it also tremendously affects the performance of order picking. A storage assignment (or product allocation) policy consists of a set of rules used to assign products to storage locations (Koster et al., 2007). Pickers can skip some aisles in a picking route to reduce travel time and distance if storage assignment is appropriate. In spite of some rule-of-thumb policies used, some previous researchers have focused on allocating products to different zones according to the turnover rates of products such that products with a high turnover rate or picking frequency are placed nearer to the outbound exit of the picking area to reduce the travel distance. Relatively few researchers (van Oudheusden et al., 1988; Frazelle and Sharp, 1989; van Oudheusden and Zhu, 1992)have proposed correlated storage assignment approaches in which products that are frequently ordered together should be assigned locations that are close to each, causing the travel distance and number of stops of picking tours to be significantly reduced. However, both the frequency and the properties of the order relationships have an influence on storage assignment. For
example, the pair of products should be allocated far apart from each other if the relationship between them is substitutive.
With the rapid advance in information technology, order data, product data and customer data can be automatically and constantly saved in enterprise information systems, such as warehouse management systems (WMS), electronic order systems (EOS), product development systems (PDS) and enterprise resource planning (ERP) systems. These abundant data can bring great value to the enterprise and help it improve operational efficiency, provided that appropriate techniques are used to extract knowledge from them for decision support (Shu and Wang, 2007; Staleyand Warfield, 2007; Xu et al., 2007; Gao et al., 2008; Wu et al., 2009; Beheshti and Beheshti, 2010). Data mining techniques are developed to extract useful information from the bulk of data, and among them, association rule mining can be used to identify the relationship of products, i.e., to discover which products commonly appear in customer orders simultaneously. The information of product association can be utilized to generate storage assignment rules for improving warehousing efficiency.
2. Research Objectives
This study attempts to propose an adaptive approach, the Data Mining-based Storage Assignment approach (DMSA), and two overall re-allocating approaches, the modified class-based heuristic (MCBH) and association seed based heuristic (ASBH). DMSA aims to find the optimal storage assignment for newly delivered products requiring putting away. MCBH and ASBH are developed to improve order picking by re-allocating all products. In addition, two association measures, association index (AIX) and weighted support count (WSC), based on association rule mining are developed to present the relationship of products in these three approaches. Three approaches allocate the pair of products that most frequently appear in the same customer orders to the same aisle. The number of times a picker enters aisles and the number of stops in a tour of order picking are reduced, so the picking efficiency greatly improved. In addition, the resulting storage assignments can adapt to the change in patterns of customer orders by applying the proposed approaches.
3. Literature Review
The essential functions of a warehouse are receiving, storing, and retrieving products. A storage assignment (or product allocation) policy consists of a set of rules used to assign products to storage locations in a warehouse (Koster et al., 2007). The way to assign products to storage locations enormously affects the utilization of space and the efficiency of order picking. Because the labor costs and service levels of warehouses are limited by the performance of order picking, more studies have focused on improving order picking performance through sophisticated storage assignment rather than on the utilization of the storage facility.
The literature related to storage assignment policies can be classified into three categories: rule-of-thumb policy, class-based policy, and family grouping policy (Koster et al., 2007). This taxonomy is conceived based on a detailed use of information. The rule-of-thumb policy is a straightforward approach that only utilizes information about availability at current storage facilities. The most prevalent rule-of-thumb policies include random location assignment, closest open location, farthest open location, and longest open location (Gu et al., 2007). Random assignment policy allocates products to available locations with respect to probability. Assigning the nearest available location from the outbound exit to the product is the so-called closest open location policy, whereas assigning the farthest one is the farthest open location policy. The longest open location policy selects an available location with the longest unoccupied time for the product under assignment. In this category of policies, storage assignment proceeds without using any product information. The major benefits of these policies consist of higher space utilization, congestion prevention, and better allocation convenience. However, the lack of consideration for the subsequent activities of warehousing and product information ultimately downgrades the efficiency of the whole warehousing cycle. With the development of a Warehouse Management System (WMS), the product properties, such as turnover rate and order frequency, can be constantly recorded such that the class-based policy can be applied to storage assignment. The class-based storage policy stems from inventory control and divides various product classes according to product characteristics such as the turnover rate. The basic idea is that assigning a product with a higher turnover rate to locations nearest the outbound exit can enhance the efficiency of order picking. Thus, a product class is assigned to a dedicated zone based on some properties of product class, such as turnover rate or order frequency, and in each zone, products are randomly allocated to shelves. The class-based assignment policy is intended to reduce picking distance and maximize space
utilization at the same time Heskett (1963, 1964) proposed an index named the cube-per-order index (COI) and carried out a storage assignment procedure based on COI in a numerical experiment. COI is the ratio of the product’s unit storage space requirement to its order frequency. The products with higher COI are placed nearer to the outbound exit of the warehouse by using the assignment procedure. Kallina and Lynn (1976) used COI as a measurement to classify products in their class-based policy. Most previous studies used the turnover rate as the basis to classify the products. Through simulation of an automated storage/retrieval system (AS/RS), Hausman et al. (1976) compared the closest open location and the turnover-based and class-based assignment approaches in terms of the travel time and turnover distribution of products. Graves et al. (1977) extended the work in Hausman’s study by additionally considering the dual command of depositing and picking in AS/RS. On the other hand, a heuristic storage assignment method based on the stochastic model is developed by Jarvis and Mcdowell (1991). This heuristic method minimizes the expected travel distance through the allocation of products to aisles according to picking frequency. van de Berg (1996) also used dynamic programming to solve a class-based allocation problem for the single command situation. Subsequently, Larson et al. (1997) took into account the storage space on different floors and proposed a class-based heuristic approach for storage assignment. The effects of various factors in the class-based assignment were explored in Manzini et al. (2007) by running a set of design experiments. Their results indicated that the number of products in each class and the number of products in the picking list do not have a significant impact on picking distance. Muppani and Adil (2008a) applied simulated annealing to solve a complex binary integer model, which simultaneously assigns products to a class and a storage location. Muppani and Adil (2008b) also formulated the class-based allocation problem as a nonlinear integer programming model and developed a branch-and-bound algorithm to solve the problem. However, the turnover rate or order frequency of products is not the only characteristic that can be gathered from WMS and EOS to improve the product allocation. Additional valuable information can also be obtained for decisions after the details of customers’ orders are further analyzed. One observation may reveal that the products in different classes may have certain relationships. For example, some products are commonly ordered together by customers, and thus they have a higher association. Such relationships between products may not be explicitly presented to decision-makers, but they can be discovered by further analyzing the order database. In addition, the manner of random allocation within a class amplifies the difficulty of order picking in a manual system.
Finally, the family grouping policy considers the product relationships, which are described as the frequency of products ordered together. The basic idea is that
products frequently ordered together should be stored closer to each other for improving the efficiency of order picking (van Oudheusden and Zhu, 1992). Frazelle and Sharp (1989) proposed a correlated assignment policy by using the statistical correlation that is the ratio of the number of orders in which two products appear together to the number of all orders. They proposed that storage locations should be assigned pairwise to products in descending order with statistical correlation, and then the layout of racks should be designed according to the turnover rate of the rack. van Oudheusden et al. (1988) further developed a pairwise interchange procedure based on the distance and closeness between products to allocate spare parts in the warehouse of a steel mill. In their work, closeness is defined as the number of times that two parts are retrieved together. By interchanging parts iteratively, the parts with a higher closeness are allocated nearer to each other. Next, van Oudheusden and Zhu (1992) considered the recurrent orders in AS/RS and proposed a storage assignment approach with respect to contact frequency, which counts the number of times that two products are ordered together. They formulated the SLAP as a set-partitioning problem by considering the contact frequency, which can be resolved by a heuristic method. Lee (1992) formulated the SLAP as a generalized assignment problem by minimizing the total picking time. In Lee’s method, the items’ propensity was used to classify similar products into groups and assign the storage locations by using the COI of each group. The items’ propensity is the relative frequency with which two items are requested together in customer orders. According to order patterns of products, Rosenwein (1994) defined the distance between products and formulated the clustering problem as a p-median binary integer programming (BIP). Brynzér and Johansson (1996) employed the product structures to classify the parts into variant groups. The variant groups were stored next to each other according to concurrent demand, which is similar to the statistical correlation (Frazelle and Sharp 1989). Liu (1999) took into account the quantity of items ordered and measured the similarity coefficient with the probability that the pair of items appears in the same order. Liu formulated SLAP as a BIP with the correlation of products and correlation of customers. A bill of material (BOM)-oriented, class-based storage assignment method was designed by Hsieh and Tsai (2001). In Hsieh and Tsai’s method, the materials are allocated according to the attributes recorded in BOMs. The concept of a family grouping policy was applied in a synchronized-zone order-picking system by Jane and Laih (2005). They defined a similarity measurement regarding order requests and developed a corresponding heuristic to solve p-median cluster problems. The statistical correlation proposed by Frazelle and Sharp (1989) was adopted by Manzini (2006). To generate product families, three algorithms were proposed in Manzini’s study. Xiao and Zheng (2010) also used the BOM information to deal with SLAP,
which was formulated as complex BIP to minimize travel distance. In their multi-stage heuristic, the similarity of parts was measured by the frequency with which a pair of parts is presented together in all BOMs. In the abovementioned studies, the frequency with which the pair of products appears together was used to capture the relationships between products in the similarity measurements, which are used to group the products. However, the property of relationships between products (i.e., complementary or substitutive) is not taken into account when family grouping policy is applied. Different properties of relationships should correspond to different assignment logics. In the complementary relationship, products should be allocated closer for the convenience of order picking, and vice versa. To catch different properties of relationships, association rule mining is applied in this study. Association rule mining cannot only reveal useful information from huge databases, but can also extract the implicit properties of relationships between products, such as complementary, substitutive and independent relationships. Thus, this study attempts to propose three heuristic storage assignment approaches based on association rule mining. The first is an adaptive approach, DMSA, which is used to find the optimal storage assignment for newly delivered products requiring putting away. The others are overall re-allocating approaches, MCBH and ASBH, which improve order picking by re-allocating all products. The detailed procedure of the proposed approaches will be discussed in the next chapter.
4. The Heuristic Storage Assignment Approaches Based on
Association Rule Mining
The logic behind these three heuristics is to allocate the products that are frequently ordered together to the same aisle as much as possible by maximizing the aggregation of association measure, AIX(in DMSA) or WSC(in MCBH and ASBH), between products allocated to the same aisle. In Section 4.1, association rule mining and WSC are briefly introduced. Section 4.2 illustrates the procedure of DMSA. The detailed procedures of MCBH and ASBH are interpreted in Sections 4.3 and 4.4, respectively.
4.1 Association rule mining and weighted support count
The approach of association rule mining can be briefly described as follows. Let {1, 2 , , }
K p denote a set of literals, namely items. There are p items in the set K. Moreover, let D represent a set of transactions, where each transaction TS is a set
of items such that TS . A unique identifier, namely TID, is associated with each K
transaction TS. Let Y and Z be the itemsets. A transaction TS is said to contain Y if
Y TS. The result of association rule mining takes the form of YZ, which means
that customers buying a set of items Y will also buy a set of items Z, where , ,
Y K ZK and Y . Support, defined as (Z P YZ) , evaluates the
popularity of a rule. There are (P Y Z) transactions in a data set that contain both items of Y and Z. Confidence, defined as (P Z Y), measures the certainty of a rule.
( )
P Z Y represents the probability that customers who buy items of Y will also buy
items of Z. Lift, defined as (P Z Y) / ( )P Z or (P YZ) / ( ) ( )P Y P Z , illustrates the
type of relationship between the products. Lift compares the observational probability,
( )
P YZ , with the theoretical probability, ( ) ( )P Y P Z . If the lift value is greater than
1.0, which means the actual probability of Y and Z appearing in the same order is greater than the theoretical probability, the relationship of products is complementary; if the lift value is less than 1.0, the relationship is substitutive; if the lift value is equal to 1.0, the relationship is independent. In this study, association rules are developed from the order data by using the Apriori algorithm (Agrawal 1993; Srikant and
Agrawal 1997, Han and Kamber, 2012), which is an efficient algorithm for mining association rules. Because the proposed WSC measure represents the association between any pair of products, the rule length is set to be 2 in this study.
The WSC measure involves the concepts of support and lift value. Support and lift value are used to represent the intensity and nature of relationships between products, respectively. However, the huge number of product pairs and the large set of orders may lead to relatively small support values. Support value is not suitable to apply to WSC. Therefore, support count, which means the count of any pair of products that appear in the same order, is adopted in the proposed heuristics to avoid the possible round-off error. The nature of relationships between products can be revealed by lift value. Different types of relationships should follow different assignment logics. A complementary relationship between two products indicates a positive fitness to allocate them in the same aisle. On the contrary, a substitutive relationship indicates a negative fitness. To take these logics into account, the support counts need to be transformed. WSC is positive if the lift value is greater than 1; it is negative if the lift value is less than 1; it is 0 if the lift value is equal to 1. Based on the above discussion, WSC is then expressed as
Z Z Z Z Z Z Z Z Z 1, if 1 0, if 1 1, if 1 Y Y Y Y Y Y Y Y Y LW Lift WSC LW supc LW Lift LW Lift (1)
WSC will be used in the three proposed storage assignment heuristics, so it should be calculated in advance.
4.2 Data mining-based storage assignment approach (DMSA)
Data Mining-based Storage Assignment (DMSA) is designed to determine the optimal storage assignment for the newly delivered products needed to be put away when there is empty shelf space in a distribution center. In practice, allocating newly delivered products to the unoccupied shelves of the picking area is a more realistic and cost-effective approach compared to allocating entire products in the DC. The other benefit of partial reallocation is that storage assignment can be adjusted in a timely manner to adapt to the change of order patterns revealed by association rule mining. The proposed DMSA approach consists of three stages that are illustrated in Figure 1. First, association rule mining is used to calculate the weighted support count, which represents the relationship between products. Second, the proposed AIX is developed to evaluate the fitness between the newly delivered products and the available storage locations based on the convenience of order picking. AIX considers
not only the turnover rate of a single product and the distance between location and exit, but also order relationships between products. Third, a BIP is formulated and solved to determine the optimal storage assignment for order picking. Each stage is detailed in the following three subsections.
Figure 1 The framework of proposed DMSA approach
4.2.1 Stage 1: Perform association rule mining
Before introducing the DMSA approach, notation used in DMSA is defined in Table 1. The proposed DMSA approach employs association rule mining to discover the relationships between products. In the first stage, the order data are analyzed by using the Apriority algorithm (Agrawal, 1993; Srikant and Agrawal, 1997; Han and Kamber, 2001). As mentioned in Section 4.1, the weighted support counts are counted in advanced and will be further integrated with the turnover of products to form the AIX in the second stage.
Table 1 Notation of DMSA
Parameters:
I The location set which contains m locations I {1, 2, , } m K The product set which contains l locations K {1, 2, , } l
Li The set of products already allocated within the aisle of location i
Tk The turnover rate of product k
Di The distance between location i and the outbound exit
pq wsupc
The weighted support count between product p and q; it is positive when lift value is greater than 1; negative when lift value is less than 1; and 0 when lift value equal to 1
Decision variable: Xik 0 , , 1
if product k is allocated in location i otherwise
Perform Association Rule Mining
Develop AIX
Formulate and Solve the Storage Assignment Model
' ' i k ik kk k L i T AIX wsupc D
4.2.2 Stage 2: Develop association index (AIX)
The AIX is developed to measure the fitness between the available storage locations and newly delivered products being put away. The fitness is measured by three factors: the association between product k being allocated to location i and products (i.e., 'k ) already allocated to the aisle of location i, the turnover rate of
product k, and the distance between location i and the outbound exit. AIXik is used to
represent the fitness value if product k is allocated to location i, and it takes the form of
(1)
The first term is the summation of all weighted support counts of product k and the products already allocated to the aisle of location i. The weighted support count, which can handle the property of relationship, is generated by association rule mining. The concept behind the first term is based on the family grouping policy discussed in Chapter 2. If product k is more often ordered together with those products already allocated to the same aisle, the first term of AIX is higher, and AIX increases. The second term is the ratio of turnover of product k (Tk) to the distance between location i
and the outbound exit (Di). The concept behind the second term corresponds to the
class-based policy discussed in Chapter 2. The second term is higher, and AIX increases while allocating products with higher turnover rates to the locations nearer to the outbound exit. The previous studies mentioned above only took turnover or the order relationship between products (i.e., support value) into consideration, or both, but the property of product relationships (i.e., lift value) was ignored. In this study, the turnover rate, the frequency, and the properties of order relationships are considered to allocate the products by adopting AIX.
To evaluate the fitness of every product allocated in all available storage locations, the AIXik between the products being put away and the available locations
should be calculated in advance. In the next subsection, the mathematical model of storage assignment is then formulated to assign the unoccupied locations to the best suitable products.
4.2.3 Stage 3: Formulate and solve the storage assignment model
With all the association indices between the products being put away and the available locations generated in Stage 2, the SLAP is formulated as a generalized assignment problem. Lee (1992) used the generalized assignment model to solve
SLAP. Different from the objective function and the similarity measurement applied in Lee (1992), the proposed AIX is embedded into the objective function (2) in the model described to maximize the summation of AIXs between the products needing to be put away and available locations. The model can be formulated as
ik ik i k Max
X AIX (2) 1 ik i X k
(3) 1 ik k X i
(4)
0,1 ik X (5)In this model, Constraint set (3) ensures that each product is assigned to a storage location. Constraint set (4) limits a single storage location at most to be assigned with a product. Constraint set (5) guarantees the binary solution for storage assignment.
4.3 Modified class-based heuristic (MCBH)
Before introducing MCBH, the notation related to the two overall re-allocating heuristics is defined in Table 2.The first heuristic, MCBH, combines traditional class-based policy and family grouping policy to solve the SLAP. In the traditional class-based policy, products are sorted into classes by considering turnover rate, and locations are grouped into several zones according to the distance between each location and the outbound exit. The number of product classes and the number of location zones are decided correspondingly. Previous studies usually recommended two or three classes and the parallel layout of zones. The location zone near the outbound exit is first assigned to the product class with a higher turnover rate. After allocating all product classes to location zones, product items are allocated randomly within each location zone. In MCBH, the turnover rate of products, intensity and types of relationship between products are considered simultaneously. Therefore, two modifications are made accordingly. The first modification is that a certain proportion of locations in each aisle are reserved at the beginning. The reserved proportion, R, and the number of class zones, | |C , are predetermined. In addition to dividing all the
storage locations into several class zones, the aisle locations in a class zone are further separated into reserved and unreserved locations based on a predetermined proportion,
R. The second modification is that products are allocated zone by zone iteratively,
instead of allocating at the same time. The procedure starts from the class zone nearest the outbound exit. The iteration proceeds one class zone at a time and can be
broken down further into two stages. In the first stage, the unallocated products in set
K are assigned to unreserved locations in the class zone based on their turnover rate.
This stage is similar to traditional class-based approaches. After executing the first stage, the unallocated product set K needs to be updated.
Table 2 Notation of MCBH and ASBH
Indices:
C The set of class zones; c1, 2 l I The set of aisles; i1, 2 n J The set of locations; j1, 2 o
K The set of unallocated products; k1, 2 p
Parameters:
Z
Y
WSC The weighted support count between product Y and product Z
Z
Y LW
The transformed weight of lift value which is positive if lift value between product Y and Z is greater than 1; negative if less than 1; 0 if equal to 1
Z
Y
supc The support count between product Y and product Z
Z
Y
Lift The lift value between product Y and product Z.
R The proportion of the reserved locations in an aisle c
UJ The set of unreserved locations in zone c c
RJ The set of reserved locations in zone c c
AU The set of products are allocated in the unreserved locations of zone c c
AR The set of products are allocated in the reserved locations of zone c jk
AWS The aggregation of weighted support counts between products already
allocated in the aisle of reserved location j and the unallocated product k j
Z The set of products are already allocated in the aisle of location j i
A The set of products are allocated in aisle i. i
L The set of available locations in aisle i Decision variables: jk X , 0 , 1
if product k is allocated in location j otherwise
In the second stage, the reserved locations are allocated to the rest of the products in set K that have a higher association, in terms of WSC, with the products already placed in the same aisle. A 0-1 integer programming model is applied to determine the product allocation to maximize the association between products allocated in the same aisle. The allocation of products in the second stage is similar to the idea of family grouping policy. Next, the unallocated product set K and class zones set C are updated. Then, the assignment procedure repeats until all class zones or all products have been allocated.
in the aisle of a reserved location. AWS adds the WSCs between unallocated jk products k ( k K)and products already allocated in the aisle of location j. Let Zj represents the set of products already allocated in the aisle of location j. All the
jk
AWS s cross all combinations of reserved locations in the class zone c, and
unallocated products should be calculated in advance and input to the 0-1 integer programming model. AWS takes the following form: jk
' ' , j jk kk C k Z AWS WSC j RJ k K
(6)The 0-1 integer programming model of location assignment for maximizing the association of products in the same aisle is formulated as follows:
Max c jk jk j RJ k K X AWS
(7) Subject to jk 1 c k K X j RJ
(8)
0,1 jk X (9)Objective function (7) maximizes the association between products allocated in the reserved locations and products already allocated in the same aisle. Constraint set (8) limits a reserved storage location to a particular product. Constraint set (9) guarantees the binary solution. However, when the number of products that must be put away is less than the number of reserved locations, Constraint (8) is replaced by Constraint (10), which ensures that each location allocates, at most, one unallocated product. 1 c jk j RJ X k K
(10)The MCBH procedure is schematically illustrated in Figure 2.
4.4 Association seed based heuristic (ASBH)
ASBH is a heuristic approach, which performs assignment aisle by aisle and tries to maximize the aggregated association between products allocated in the same aisle. ASBH approximates the situation in which all locations are assigned based on the ordering relationship between products in MCBH. The assignment procedure starts to allocate products from the aisle nearest to the outbound exit in I. In the beginning of
allocating an aisle, two unallocated products in K have the highest WSC between each other and so are chosen as the seed for the set of products allocated in the aisle i,Ai.
\{ }, \{ c} CC c KK AR \{ }c KK A Figure 2 Flowchart of MCBH
i
Ais added into set Ai iteratively until the number of products in set Ai equals the number of available locations in aisle i.
Start
Perform Apriori algorithm to generate association rules, and compute WSCs.
Adjust the set of available locations in each aisle, Li.
Select the aisle i which is the nearest to the outbound exit from the set I, and initially set Ai
to an empty set.
Select two products, x and y which
Add x and y to the set Ai. Then, exclude x and y
from set K.
Select the product k which
Add k to the set Ai. Then, exclude k from set K.
Allocate the products in the set Aiin the
locations of aisle i randomly. Exclude the aisle
i from the set I.
Stop NO
YES
{ , } arg max{x y wsupcxy; ,x yK}
{ , } i i AA x y KK\{ , }x y { } arg max{ zk; i, } k k wsupc zA kK { } i i AA k KK\{ }k |Ai| | Li| or K ? \{ } II i or ? I K
Output the allocation of all products. NO YES | | |J K| ? YES NO i A
Figure 3 Flow chart of ASBH
aisles are assigned or all the products are allocated. The procedure of ASBH is schematically illustrated in Figure 3.
5. Experimental Design and Analysis
In this chapter, the proposed three approaches are implemented with a real dataset from a grocery distribution center. The dataset contains order records of 12 months extracted from the information system of the distribution center. The characteristics of the dataset and data preprocessing are detailed in Section 5.1, and the experimental settings are described in Section 5.2. Due to the difference between adaptive and overall re-allocating approaches, the designs of experiment are divided into two parts. The results and analysis of DMSA are reported in Section 5.3. The results and analysis of MCBH and ASBH are reported in Section 5.4.
5.1 Dataset
The dataset is extracted from the order database of a distribution center, which belongs to the logistics group of a company. The distribution center supplies the grocery stores’ daily orders. The proposed approaches are suitable for improving efficiency in this kind of storage facility because the orders from grocery stores consolidate the customers’ repeated purchasing behaviors. Because the order pattern is recurrent in this database, products in the orders usually have more stable association relationships. To avoid traffic congestion near the stores, the time for replenishment of grocery stores is usually at night or early morning. Therefore, the distribution center is most often congested with orders in the evening. All order pickings need to be accomplished in a very short time frame. In addition, the customer orders are often small in size and high in variability, such that the order picking in the picking area of the manual system becomes much more labor intensive. In this kind of storage facility, the time saved for order picking is more valuable than the time for allocating products.
The dataset includes 338,113 daily orders from all served grocery stores in one year. There are 1,308 products recorded in the order transaction list, but only 787 products are stocked in the picking area. To evaluate the performance of the proposed approaches, the dataset is divided into two parts. The first 312,665 transaction records from January to November are used to generate support counts, and the remaining 25,448 records from December are considered incoming orders.
5.2 Experimental settings
The distribution center has a rectangular shape with 800 storage locations. There are 21 aisles and 20 shelves. Each shelf is two-sided and has 20 locations within one layer on each side. Figure4 presents the layout of the distribution center. The 787 products need to be allocated within the picking area.
The length of an aisle is 32 meters. The width of a single-sided shelf is 1.5 meters, and the width of a two-sided shelf is 3 meters.
Each product is only stored in one storage location.
There is an entrance and an outbound exit in the distribution center.
A picking tour follows an S-shape strategy (Hall, 1993). The picker will not enter an aisle, if there is no product item in the aisle that needs to be picked.
Orders are picked by using the first-come-first-served policy. Order batching is not applied at this distribution center.
A single command is adopted.
Figure 4 Illustration of the layout and S-shape picking strategy in the distribution center
5.3 Results and analysis of DMSA
The analysis is divided into two parts. First, an example of 30 newly delivered products with the highest turnover rate is used to evaluate the performance of the proposed DMSA approach. Second, a set of experiments is designed to explore the situation when both the products with high and low turnover rates are considered to be reallocated.
Because the products with a high turnover rate are replenished more frequently, the products in the first experiment are chosen according to turnover rate. The first 30 products with the highest turnover rates contribute more than one-third of the total
order frequencies over the past 11 months. Thus, they are chosen to be the candidates for newly delivered products. In past studies, the random storage assignment policy was usually used as the benchmark for comparison purposes (Hausman et al., 1976; Larson et al., 1996; Manzini 2006). The results are also benchmarked by the random storage assignment policy by comparing the total travel distance of incoming orders.
By using the random assignment, the total travel distance of orders for December is 7,229,087 meters. Comparatively, the total travel distance by using DMSA is 6,924,575 meters. From these results, the picking distance is shortened by 304,512 meters, a 4.21% reduction. At first glance, the improvement does not seem to be significant. However, DMSA is an adaptive approach that only reallocates a portion of products, which are 30 out of 787 products in the first experiment. The performance of DMSA cannot be directly compared with other approaches that allocate all products.
After evaluating the preliminary performance of DMSA, an experimental design is employed to investigate the performance of DMSA in a more general setting. In reality, both the products with high and low turnover rates have the chance to be restocked and reallocated. Two factors, the sample size and the combination of samples, would vary over time and may have an influence on the performance of DMSA. As a result, a two-factor ANOVA was conducted to explore how the two factors impact the performance of DMSA. The number of newly delivered products needing to be put away is the first factor, Factor A. In general, the average number of products needing to be put away is around 40 items, and the maximum and minimum numbers are 60 and 20, respectively. The second factor is the proportion of products with a higher turnover rate for all put away products, Factor B. Based on the company’s practice, the products with the first 273 highest turnover rates (approximately the top 30% of the 787 products) are defined as high-turnover products, and the rest are treated as low-turnover products. Three levels of proportions are chosen, 30%, 60%, or 90%. Therefore, nine experimental setups are used to obtain the travel distances. The factor settings are illustrated in Table 3. The products in each experimental setting are randomly selected from the high- and low-turnover items, according to the proportion of products with a higher turnover rate. Each setting is run four times. For example, the settings of Factor A as 20 and Factor B as 30% means that the sample of 20 products consists of 6 high-turnover rate products and 14 low-turnover rate products.
Table 4 summarizes the results of the 36 experiments in nine settings. The range of improvement varies from 0.4% to 2.8%. To justify how the two factors affect the reduction of travel distance, a two-factor ANOVA is used to further analyze these results.
Table 3 The experiment settings
Factor Level 1 Level 2 Level 3
Factor A 20 40 60
Factor B 30% 60% 90%
Table 4 The result of the 36 experiments
Setting* The average moving distance in four repeat trails (meters) Average improvement comparing with random assignment (7229087 meters)
20-30 7199807 0.4050% 20-60 7195551 0.4639% 20-90 7183279 0.6337% 40-30 7191903 0.5144% 40-60 7146287 1.7893% 40-90 7108831 1.6635% 60-30 7151375 1.0750% 60-60 7099087 2.1137% 60-90 7022495 2.8578%
* The number in front of each dash presents the level of Factor A and the number after the dash presents the level of Factor B.
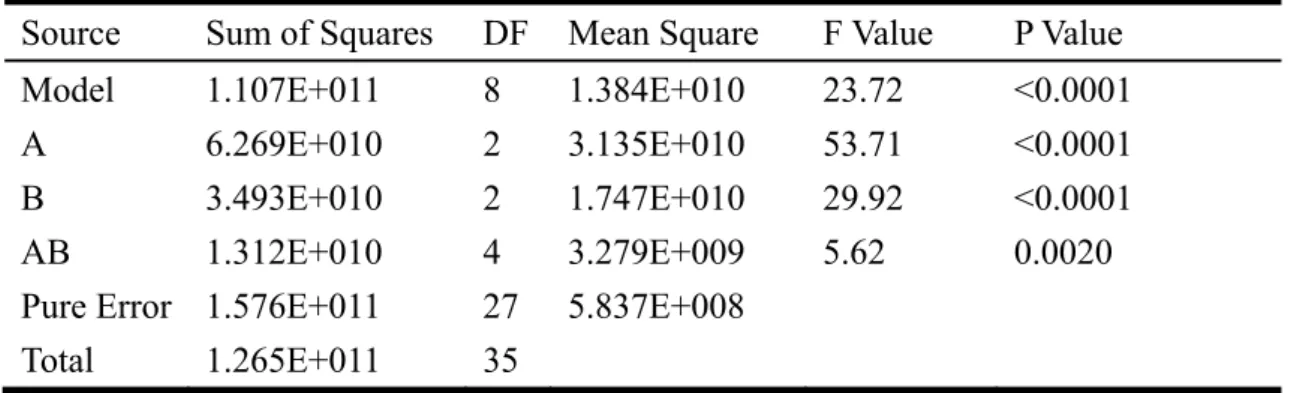
In the two-factor ANOVA, the assumptions of normality, consistency and randomization are tested, and they are acceptable. Table 5 presents the results of ANOVA. Apparently, the main effect of Factor A, the main effect of Factor B, and the interaction effect between Factors A and B all have significant effects on the improvement of travel distances (α = 0.01). The result means that the travel distance decreases as the number of products needing reallocation (Factor A) and the proportion of high-turnover products in the restocking list (Factor B) increase. In terms of the main effect, the increased number of products needing reallocation leads to more available locations such that a better storage assignment can be conducted with a more flexible arrangement. On the other hand, the high-turnover products are ordered and picked more often than the low-turnover ones. Consequently, as more high-turnover products are involved in re-assignment processes, the total travel distance is reduced. In terms of the interaction effect, the improvement of distance reduction is better while both Factors A and B are set to the higher levels. In such a setting, more products of a high-turnover rate reallocated to more available locations can achieve greater distance reduction.
The experimental results also demonstrate how the efficiency of order picking can be improved by using DMSA to re-assign newly delivered products to the storage locations without incurring any additional pickers or picking facilities. The proposed DMSA approach can greatly reduce the likelihood of entering an aisle for picking one product as well as the number of stops for picking, which results in shorter travel distances. In addition, the CPU time to solve the assignment model is very short (commonly less than 2 seconds).
Table 5 The ANOVA table of the experiments
Source Sum of Squares DF Mean Square F Value P Value
Model 1.107E+011 8 1.384E+010 23.72 <0.0001
A 6.269E+010 2 3.135E+010 53.71 <0.0001
B 3.493E+010 2 1.747E+010 29.92 <0.0001
AB 1.312E+010 4 3.279E+009 5.62 0.0020
Pure Error 1.576E+011 27 5.837E+008 Total 1.265E+011 35
5.4 Results and analysis of MCBH and ASBH
Based on the experimental settings described in Section 5.2, a set of experiments is conducted to demonstrate the viability of the proposed overall re-allocating heuristics. The traditional class based allocation approach (CBAA) is chosen as the benchmark to compare with the performance of MCBH and ASBH. Because these three approaches partially involve random assignment, each experimental setting is run for four trials to ensure robustness. After obtaining the storage assignment, the order data of December are used to represent the incoming orders for calculating the travel distance of order picking under different storage assignments.
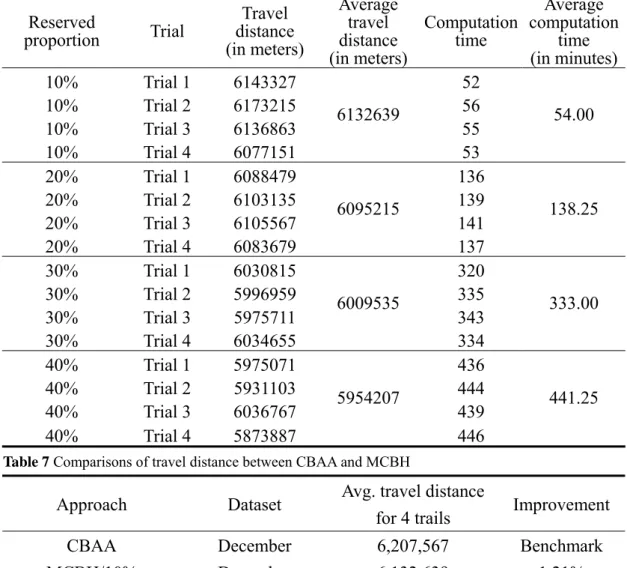
In implementing CBAA and MCBH, products and locations are divided into two product classes and two zones for simplicity. To explore the effect of the relationship between products, four different levels of reserved proportion, 10%, 20%, 30%, and 40%, are studied in this study. Products are allocated according to association in reserved locations. Table 6 shows the travel distance and computation time of order picking for one month under the allocation generated by MCBH with 10%, 20%, 30%, and 40% reserved proportions. Table 7 summarizes the average travel distance generated from allocation by CBAA and MCBH. In comparison to CBAA, the travel distance generated by MCBH decreased from 1% to 4% and was dependent on the level of reserved proportion. MCBH, which combines the class-based allocation and family grouping approaches, outperforms the traditional class-based approach in terms of travel distance. The results indicate that allocating products that are frequently ordered together in the same aisle can enhance the efficiency of order picking.
Table 6 The travel distance and computation time of allocation by MCBH with December orders Reserved proportion Trial Travel distance (in meters) Average travel distance (in meters) Computation time Average computation time (in minutes) 10% Trial 1 6143327 6132639 52 54.00 10% Trial 2 6173215 56 10% Trial 3 6136863 55 10% Trial 4 6077151 53 20% Trial 1 6088479 6095215 136 138.25 20% Trial 2 6103135 139 20% Trial 3 6105567 141 20% Trial 4 6083679 137 30% Trial 1 6030815 6009535 320 333.00 30% Trial 2 5996959 335 30% Trial 3 5975711 343 30% Trial 4 6034655 334 40% Trial 1 5975071 5954207 436 441.25 40% Trial 2 5931103 444 40% Trial 3 6036767 439 40% Trial 4 5873887 446
Table 7 Comparisons of travel distance between CBAA and MCBH
Approach Dataset Avg. travel distance
for 4 trails Improvement
CBAA December 6,207,567 Benchmark
MCBH/10% December 6,132,639 1.21%
MCBH/20% December 6,095,215 1.81%
MCBH/30% December 6,009,535 3.19%
MCBH/40% December 5,954,207 4.08%
From Table 7, it seems that travel distance decreases as the reserved proportion increases. Furthermore, from the One-Factor ANOVA shown in Table 8, the main effect of the reserved proportion is a significant effect on the improvement of travel distances at the significance level α = 0.01.
Table 8 The ANOVA table of the experiment with MCBH
Source Sum of squares DF Mean square F value P value
Model 7.868E+010 3 2.623E+010 14.42 <0.0003
R.P. 7.868E+010 3 2.623E+010 14.42 <0.0003
Pure
error 2.183E+011 12 1.819E+009
Total 1.005E+011 15
locations allow for more pairs of products with a higher association to be allocated in the same aisle. Operators can pick more products in the entrance of an aisle such that the travel distance is shortened. From the experimental results, raising the reserved proportion can achieve better picking performance. The proposed heuristics are run on a laptop with 2.20 GHz CPU and 3.49 GB DRAM. Table 6 shows that the computational requirement also increases enormously as the reserved proportion increases because more reserved locations result in more computational effort spent on calculating AWS . By using MCBH, increasing reserved locations leads to a jk better result but needs more computational requirements. ASBH is designed to approximate the situation of allocating all products based on their association between one another. The CPU time of ASBH is about 5 minutes, and it is much shorter than that of MCBH. Table 9 summarizes the average travel distance of CBAA and ASBH.
Table 9 Comparisons of travel distance between CBAA and ASBH
Approach Dataset Avg. travel distance
for 4 trails Improvement
CBAA December 6207567 Benchmark ASBH December 5399599 13.02% Compared to CBAA, the travel distance generated by ASBH is decreased by approximately 13%, which is better than the distance generated by MCBH. ASBHattempts to store products frequently ordered together in the same aisle as much as possible so that the operator can pick more items in an entrance of an aisle. The results demonstrate sizable distance savings achieved solely by considering product relationships when allocating products. Intuitively, the decrease in travel time would be less than 10% according to the results from Table 7. However, the reduction appears to be larger than expected. The additional reduction may have been caused by eliminating the unreserved area. Without the unreserved area, all locations in each aisle are available, which means that ASBH has more flexibility to assign products. On the other hand, the basic idea of CBAA has been embedded in ASBH. When a pair of products has a high WSC between each other, both of those products each have a high order frequency individually. ASBH first selects and allocates the products with a higher association between each other to the locations near the outbound exit. From above-mentioned point of view, ASBH that keeps both the advantages of family grouping policy and CCBA is superior to MCBH in both effectiveness and efficiency. However, ASBH might not function well if the association between products is sparse. In such a situation, the maximum association mechanism of each aisle would be replaced by random selection. The effect of picking several products frequently ordered together in an aisle might be insignificant.
The experimental results demonstrate how the efficiency of order picking can be improved by using MCBH and ASBH to re-assign storage locations without requiring additional pickers or picking facilities.
6. Conclusion
To face the challenges of varying customer demands and a highly competitive marketplace, distribution centers need to become more effective and more efficient. Both service level and cost should be considered and balanced to enhance the performance of distribution centers. Under the progress of information technology, order transaction data can be utilized not only to record daily transactions but also to assign product locations for improving picking efficiency. This study proposes an adaptive approach, the Data Mining-based Storage Assignment approach (DMSA), and two overall re-allocating approaches, the modified class-based heuristic (MCBH) and association seed based heuristic (ASBH). DMSA aims to find the optimal storage assignment for newly delivered products requiring putting away. MCBH and ASBH are developed to improve order picking by re-allocating all products. In addition, two new association measurements, association index(AIX) and weighted support count (WSC), based on association rule mining are developed to present the relationship of products in these three approaches. Three approaches allocate the products with high frequency appearing in the same customer order in the same aisle.
The proposed three approaches have the following advantages. First, AIX and WSC both consider the prevalence and property of relationship between products by using association rule mining. Second, the likelihood of entering an aisle for picking items and the number of stops are both reduced, which results in shorter travel distance. Third, AIX and WSC are partially generated from order data such that the storage layout may be changed with the variation of order patterns automatically. The allocation of products is dynamically adjusted with respect to the ordering patterns so as to take seasonality into consideration. Fourth, reassigning storage locations can enhance order picking performance without incurring any additional overhead or capital investment.
References
Agrawal, R., Imielinski, T.,and Swami, A., 1993. Mining Association Rules between Sets of Items in Large Databases. Proceedings of the 1993 ACM SIGMOD
Conference Washington DC, 207216.
Beheshti, H. and Beheshti, C., 2010. Improving productivity and firm performanceWithenterprise resource planning. Enterprise Information Systems, 4(4),445472.
Brynzér, H. and Johansson, M. I., 1996. Storage location assignment: Using the product structure to reduce order picking times. International Journal of Production
Economics, 46-47, 595603.
Frazelle, E.A. and Sharp, G.P., 1989. Correlated assignment strategy can improve order-picking operation. Industrial Engineering,21 (4), 3337.
Gao, X., Li, Z., and Li, L.,2008. A process model for concurrent design inmanufacturingenterprise information systems. Enterprise Information Systems 2(1), 3346
Graves, S.C., Hausman, W.H.,and Schwarz, L.B., 1977. Storage-retrieval interleaving in automatic warehousing systems. Management Science, 23 (9), 935945.
Gu, J., Goetschalckx, M., and McGinnis, L.F., 2007. Research on warehouse operation: A comprehensive review. European Journal of Operational Research, 177 (1), 121.
Hall, R.W., 1993. Distance approximation for routing manual pickers in a warehouse.
IIE Transactions, 25(4), 7687.
Han, J. andKamber, M., 2001. Data mining: Concepts and techniques. San Francisco: Morgan Kaufmann.
Hausman, W.H., Schwarz, L.B.,and Graves, S.C., 1976. Optimal storage assignment in automatic warehousing systems. Management Science, 22(6), 629638.
Heskett, J.L., 1963. Cube-per-order index - A key to warehouse stock location.
Transport and Distribution Management, 3, 2731.
Heskett, J.L., 1964. Putting the cube-per-order index to work in warehouse layout.
Transport and Distribution Management, 4, 2330.
Hsieh, S. and Tsai, K.C., 2001. A BOM oriented class-based storage assignment in an automated storage/retrieval system. The International Journal of Advanced
Jane, C.C. andLaih, Y.W., 2005. A clustering algorithm for item assignment in a synchronized zone order picking system. European Journal of Operational Research, 166(2), 489496.
Jarvis, J.M. and McDowell, E.D., 1991. Optimal product layout in an order picking warehouse. IIE Transactions, 23(1), 93102.
Kallina, C.,and Lynn, J., 1976. Application of the cube-per-order index rule for stock location in a distribution warehouse. Interfaces, 7(1), 3745.
Koster, R.D., Le-Duc, T., and Roodbergen, K.J., 2007. Design and control of warehouse order picking: A literature review. European Journal of Operational
Research, 182(2), 481501.
Larson, T.N., March, H.,and Kusiak, A., 1997. A heuristic approach to warehouse layout class-based storage. IIE Transactions, 29(4), 337348.
Lee, M.K., 1992. A storage assignment policy in a man-on-board automated storage/retrieval system. International Journal of Production Research, 30(10), 22812292.
Li, L., 2007.Supply Chain Management: Concepts, Techniques and Practices. World Scientific, New Jersey.
Liu, C.M., 1999. Clustering techniques for stock location and order-picking in a distribution center. Computer and Operations Research, 26(10-11), 9891002.
Manzini,R., 2006. Correlated storage assignment in an order picking system.
International Journal of Industrial Engineering, 13(4), 384394.
Manzini, R., Gamberi, M., Persona, A.,and Regattieri, A., 2007. Design of a class based picker to product order picking system. The International Journal of Advanced
Manufacturing Technology, 32(7-8), 811821.
Muppani, V.R. andAdil, G.K., 2008a. Efficient formation of storage classes for warehouse storage location assignment: A simulated annealing approach. The
International Journal of Management Science, 36(4), 609618.
Muppani, V.R. andAdil, G.K., 2008b. A branch and bound algorithm for class based storage location assignment. European Journal of Operational Research, 189(2), 492507.
Roodbergen, K.J. andKoster, R.D., 2001. Routing methods for warehouses with multiple cross aisles.International Journal of Production Research, 39(9), 1865-1883. Rosenwein,M.B., 1994. An application of cluster analysis to the problem of locating items within a warehouse. IIE Transactions, 26(1), 101103.
Shu, Q. and Wang, C., 2007. A conceptual framework for product lifecycle modellingEnterprise Information Systems, 1(3), 353363.
Srikant,R.and Agrawal, R., 1997. Mining generalized association rules. Future
Staley, S. and Warfield, J., 2007. Enterprise integration of product developmentdata:systems science in action. Enterprise Information Systems, 1(3),269285.
Tompkins, J.A., White, J.A., Bozer, Y.A., Frazelle, E.H., Tanchoco, J.M.A.,and Trevino, J., 1996.Facilities Planning 2nd., Wiley & Sons Inc.
van den Berg, J.P., 1996. Class-based storage allocation in a single-command warehouse with space requirement constraints. International Journal of Industrial
Engineering, 3(1), 2128
van Oudheusden, D.L.,Tzen, Y.J.J., and Ko, H.T., 1988. Improving storage and order picking in a person-on-board AS/R system. Engineering Costs and Production
Economics, 13(4), 273283.
van Oudheusden, D.L. and Zhu, W., 1992. Storage layout of AS/RS racks based on recurrent orders. European Journal of Operational Research, 58(1), 48–56.
Wu, S., Xu, L., and He, W., 2009. Industry-oriented enterprise resource planning.Enterprise Information Systems, 3(4), 409424.
Xiao, J. and Zheng, L., 2010. A correlated storage location assignment problem in a single-block-multi-aisles warehouse considering BOM information. International
Journal of Production Research, 48 (5), 13211338.
Xu, L., Li,Z., Li S., and Tang, F., 2007. A decision support system for productdesign inconcurrent engineering. Decision Support Systems,42(4), 20292042.