Pergamon
Copyright © 1996 Elsevier Science Ltd Printed in the USA. All rights reserved 0016-7037/96 $15.00 + .00PII S0016-7037(96) 00205-0
The calibration of D [ S r / C a ] versus sea surface temperature relationship
for Porites corals
CHUAN-CHou SHEN, I'2 TYPHOON LEE, ~,3 CttI-YuN CHEN, ~.3 CI-IUNG-HO WANG, I CHANG-FENG DA[, 4 and LUNG-AN LI 5 ~Institute Earth Sciences, Academia Sinica, P.O. Box 1-55, Nankang, Taipei, Taiwan, ROC
2Department Chemistry, National Tsing-Hua University, Hsin-Chu, Taiwan, ROC 3Department Geology, National Taiwan University, Taipei, Taiwan, ROC 4Institute Oceanography, National Taiwan University, Taipei, Taiwan, ROC
~Institute Statistics, Academia Sinica, Nankang, Taipei, Taiwan, ROC (Received July 24, 1995; accepted in revised form June 20, 1996)
A b s t r a c t - - T a k i n g advantage of the availability of a continuous sea surface temperature ( S S T ) record at Kenting, southern Taiwan, we have carried out a calibration of D [ S r / C a ] - S S T ( D : distribution coefficient) relationships for Porites Iobata and P. lutea. Between 22°C - 28°C, tile best fitting linear relationships for the two species agree within their respective errors with a maximum deviation less than 0.3°C. Our calibration overlaps with the only published calibration for Porites (deVilliers et al., 1994) but is somewhat less temperature sensitive. The m a x i m u m temperature differences for the two calibrations between 21°C and 27°C are _+ 1.2°C. The D - S S T relationship calculated using the data of Beck et al. (1992, 1994) and their unpublished seawater data lies between these two calibrations. Our calibration removes some discrepancies previously described in the studies of McCulloch et al. (1994a) on the Great Barrier R e e f and of Min et al. (1995) on New Caledonia. W e found little growth rate effect on the calibration for P. lutea between 18 m m / y r and 23 ram/yr. W e have also monitored the seawater [ S r / C a ] for the entire 1993. The observed variation of 0.033 m m o l / m o l can cause a temperature artifact of 0.7°C and is thus a dominant error in using this new paleo-therlnometer. To carry out this experiment, we have developed a microsurgical technique that can be used to sample corals at better than 0.15 mm resolution. The analytical precision should ultimately allow SST reconstruction of better than 0.2°C. Furthermore, the insensitivity of the calibration against growth rate variation and species differences suggests a promising future for this new thermometer, in contrast to the pessimism of deVilliers et al. (1995). However, inter-laboratory differences and the question of seawater [ S r / C a ] variation need to be addressed first. We recommend a single SST calibration for the S t / C a thermometer on coral Porites: Sr/CaN = 10.286-0.0514 × SST (N: normalized to Hawaii seawater [ S r / C a ] = 8.510 m m o l / m o l ) or D [ S r / C a ] = 1 . 2 0 7 7 - 0.006011 x SST.
1. INTRODUCTION
The best way to check the validity of climatic models is to test them against the varied conditions of our earth system in the past. Therefore, the reconstruction of paleo-climatic parameters from proxy records preserved in nature is rapidly becoming an important scientific pursuit. Potentially, high- precision [ S r / C a ] concentration measurements on corals of_ fer a superior method for estimating past sea surface temper- atures ( S S T ) with good accuracy ( < 0 . 2 ° C ) and excellent time resolution ( w e e k l y ) . The purpose of this paper is to present the result of our effort to calibrate this new paleo- thermometer.
Although the correlation between S r / C a and SST was known since the 1970's (Weber, 1973; Smith et al., 1979), Beck et al. (1992) was the first to exploit the far more precise isotopic dilution mass spectrometry ( I D M S ) techniques. Since then, it has been applied to a number of important problems in the study of paleoclimate. These include the temperature of tropical oceans during late deglaciation time (Beck et al., 1992), last glacial maximum (Guilderson et al., 1994), last interglacial maximum (McCulloch et al., 1994b), and the strong El Nifio of 1982-83 (McCulloch et al., 1994a).
In spite of its great potential, there are still a number of 3849
outstanding issues that must be resolved before the S r / C a method can be considered well established. Many of these have been addressed by deVilliers et al. (1994, hereafter abbreviated as d V S N ) . These authors noted that the magni- tude of variation for seawater S r / C a ( 8 . 5 - 8 . 7 retool/tool) corresponds to a temperature artifact of 2.5°C. So, either the local offset between seawater S t / C a has to be corrected or, equivalently, the distribution coefficient D should be used instead of the concentration ratio. They further showed that D [ S r / C a ] for coral relative to seawater is lower than that determined for inorganic precipitation of aragonite at equi- librium by Kinsman and Holland (1969). This lack of equi- librium implies that the S S T - D calibration may be sensitive to rate-dependent and biogenic processes. Indeed they found different temperature calibrations for corals of different gen- era and for samples formed at different growth rates from the same coral. Another factor requiring clarification is whether the temperature at the SST recording station can represent that of the sampling site. Yet another factor is how to extend the temperature range of the D - S S T calibration. In fact, deVilliers et al. (1995) reported large discrepancies between corals of the same species that grew only 20 meters apart and expressed pessimism about the future of this method. Indeed, presently there exist several surprises and discrepancies when the S r / C a method is applied. For in-
stance, the temperature o f the last interglacial m a x i m u m was found to be 4°C lower than present using corals f r o m N e w Guinea ( M c C u l l o c h et al., 1994b) while it was thought to be a period slightly w a r m e r than the present. Moreover, the SST o f tropical Pacific (Vanuatu, Beck et al., 1992) 10 kyr ago was 4°C l o w e r than that at tropic Atlantic (Barbados, Guilderson et al., 1994) at the same time. The difference is m u c h larger than expected. Careful investigation o f possible pitfalls o f the n e w m e t h o d may help to settle s o m e o f these key questions.
This paper is a report o f our effort to calibrate the D - S S T relationship for the two widely sampled species, P. lobata and P. lutea. W e took advantage o f the availability o f contin- uous SST recording at the water intake o f a nuclear p o w e r plant located at Kenting, southern Taiwan, since 1987. Our calibration is then c o m p a r e d with the only other such calibra- tion in the literature ( d V S N ) . W e further investigated the growth rate effect and the variation in seawater [ S r / C a ] . A preliminary report o f our result was presented by Lee et al. ( 1 9 9 5 ) .
2. SAMPLE TREATMENT AND MEASUREMENT METHODS
Coral species of P. lobata and P. lutea were gathered on January 1, 1993 and 1994, respectively, at the water intake of the Third Nuclear Power Plant, Nanwan Bay, Kenting National Park, southern Taiwan, at depths of 2 m and 4 m, respectively (Fig. 1 ). There is
no temperature difference between these two depths as measured by means of highly accurate (0.05°C) thermometers. Sea surface water samples were collected monthly from Jan., 1993 to Dec., 1993 from the same site. Corals were sectioned along the vertical direction of growth into 1.0 cm thick slices using a diamond-band saw. They were immersed in 10% sodium hyperchlorite for at least one day to get rid of organic matrix materials, then washed with deionized water in an ultrasonic cleaner and finally dried at 50°C in an oven. Growth rates were about 15-16 mm/yr for P. lobata and 17-23 mm/yr for P. lutea as estimated from density bands on X-ray photo- graphs.
On each slice, subsamples of P. lobata, each weighing about 5 - 6 mg, were drilled with a drill bit of I mm in diameter at a fixed interval of 1.5 mm along the axis of maximum growth and crushed into fine powder in an agate mortar (circular holes in Fig. 2). An improved sampling technique was applied to P. lutea. Using a mi- crometer-controlled 3-D stage and a high speed (7,500-25,000 rpm) fine (thickness 0.15 mm) circular diamond saw, we first cut two parallel lines 1.5 mm apart along the maximum growth direction. Further cutting then produced small sample cubes (1.5 × 1.5 × 2 mm 3) (Fig. 2). All cutting was performed with methanol as a cool- ant. The technique can obviously be used for higher resolution sam- pling as small as 0.15 mm intervals, if necessary. The cubes were crushed and homogenized in a mortar. Most of the samples were used for carbon and oxygen isotopic analysis. A small aliquot of the coral sample powder, about 50 #g in weight, was weighed using a micro-balance and dissolved in a drop of 1 N HC1. Optimal amount of 42Ca-44Ca-84Sr triple spike solution was added so that the 42Ca from spike was twenty-five times that from sample. We then directly loaded about 1/20 of the mixture solution on a single Ta filament. The MAT-262 at IES was used to measure first calcium then stron- tium isotopic ratios. In order to remove instrumental mass fraction-
1 0 0 I ; ~ I
120"41 'E
°N~k
o Hengchunk~l/o Hungchai
21°58'
g~[I
Water Intake
i
N
+
Kenting
120"45'
monsoon I
1 0 ¢ m I E 121"i
e~ 1= P. I o b a t a • • P. lutea 5 km I !F~G. 1. Nanwan Bay in Kenting National Park, southern Taiwan. Coral and seawater samples were collected at the water intake pond of the Third Nuclear Power Plant, where continuous SST measurements have been taken since 1987. The distance between the thermal-couple sensor used to measure SST and the coral sampling site is about 200 m.
FIG. 2. Enlarged photograph and X-ray photograph (inset) of
Porites coral slab subsampled using a 1.0 mm drill (circular holes)
and with a 0.15 mm thick diamond saw (thin cuts). The micro- surgical stage plus the ultra-small diamond saw developed offer a well controlled micro-sampling capability. Since 0.15 mm is equiva- lent to about three day worth of coral growth, better than weekly resolution is achievable. This method seems to have some advan- tages over the drill method.
appropriately averaging over time periods w h e n the sample growth actually took place. This has not b e e n the case for m o s t o f the published work. Beck et al. (1992) used 6~80 to infer the temperature, d V S N ' s m e a s u r e m e n t at Galapagos is based on SST 100 k m away. Only at Hawaii ( K o K o Head, O a h u ) was weekly bucket measurements m a d e near the sam- pling site.
To o v e r c o m e this difficulty, we first calibrated both the continuous SST sensor reading and a CTD against our abso- lute mercury thermometer. W e then monitored the tempera- ture difference b e t w e e n the sensor location and the sampling site 200 m away as recorded by the CTD over a 48 h period. During that time the SST variation was less than I°C. Figure 4 shows the result. Instantaneous differences varied b e t w e e n - 0 . 4 ° C and 0.7°C and w e r e probably attributable to the change o f water depth at coral site with tide and direct heat- ing o f the shallow sea b o t t o m by the solar insolation. H o w - ever, the difference averaged over 24 h was only 0.15°C. W e thus believe that temperature difference averaged over time longer than a w e e k was probably at most 0.1°C. The use o f the continuous SST record should be accurate to this level.
ation in thermal ionization mass spectrometry, single spike isotopic result of Sr was normalized to ~Sr/88Sr = 0.1194 while the double spike Ca results were corrected to 4ZCa/44Ca = 0.29969.
Typically 1-2 mg coral subsamples were measured for oxygen isotopic analysis on a MAT252 mass spectrometer with an external precision of 0.10%~ (2or) and 6~80 values are expressed relative to the PDB standard.
Monthly samples of seawater of 1993 were also subject to Sr, Ca, and 6 ~80 analyses. First, 50 c.c. samples were filtered by membrane filters (MFS 0.45 #m). Subsequently, a 0,05 g aliquot was mixed with suitable amount of triple spike and eluded through a cation- exchange resin column (Biorad AG-50W × 8, 100-200 mesh) to remove other sea salts. This was followed by the collection of Sr and Ca together in one fraction. They were measured in mass spec- trometers the same way as coral samples.
Daily mean temperatures were obtained by averaging three read- ings: the maximum and minimum readings from the continuous thermal couple trace on the chart recorder plus one reading taken manually at 8:00 a.m. everyday. Temperature difference between the sampling site and the continuous recording thermal couple sensor location, where long-term SSTs record was obtained, was checked by simultaneous measurements with high precision calibrated mercury thermometers (_+0.05°C) whose calibration is traceable to the abso- lute national temperature standard.
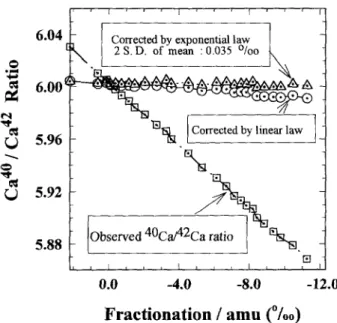
3. TEST OF THE ISOTOPE DILUTION METHODS A long duration data acquisition run for Ca on MAT262 was performed to ensure that unusually large mass fractionation effects can be efficiently corrected using our double spike method (Fig. 3 ). The raw 4°Ca/42Ca ratios were severely fractionated by as much as 26%c. The corrected ratios spanned a range only 0.6%0 and the mean value converged to a 2 × S. D. ~ _+0.035%0 by using exponential law (Russell et al., 1978). It is also obvious from Fig. 3 that the linear law did not completely remove the fractionation effect.
For St/Ca ratio, a long-term reproducibility of +_0.44%e (2c~, n = 7 ) was achieved as demonstrated by repeated an',dyses of the same coral sample powder. The external error of repeated measurements of the same seawater sample was -+0.55%c (2or, n = 3).
4. RESULTS AND DISCUSSION
4.1. T e m p e r a t u r e D i f f e r e n c e s b e t w e e n t h e S a m p l i n g Site a n d t h e S S T R e c o r d i n g S e n s o r L o c a t i o n Ideally, when calibrating the S r / C a - S S T relationship, one should use continuous SST record at the coral site after
4.2. T e m p o r a l S r / C a V a r i a b i l i t y o f S e a S u r f a c e Water
The conventional practice to separate liquid and particu- late phases in aquatic chemistry is by filtration with 0.45 /~m m e m b r a n e ( G o l d b e r g et al., 1952). But this has been challenged by recent works ( D a i e t al., 1995; Baskaran and
¢'q
[ I
l~lI~ Corrected by linear law
%
Iio
5 . 8 8 bserved 40Ca/42
0.0 -4.0 -8.0 -12.0
F r a e t i o n a t i o n / ainu (O/.o)
FIG. 3. 4°Ca/4aca ratio vs. mass fractionation factor per ainu of mass differences (negative favoring heavy isotopes). An extremely fractionated thermal ionization mass spectrometer run of a sample spiked at a ratio of 4aca~p~ko :42Ca~or~ = 25:1. It demonstrates that our 42-44 double spike procedure can correct for the fractionation effect up to 26%o in 42/40 so that it converges to a 2 × S.D. of the mean = _+0.035%0. The 95% confidence level for our run to run reproducibility in Sr/Ca using the triple spike method was 0.44%c based on seven separately spiked aliquots of the same sample powder.
6 . 0 4 [ Corrected by exponential law 1 I N, / 2S.D. ofmean :0.035 °/oo ~ x
6 . 0 0 ~ ~
0.9
----0-- Temp Difference -- e . - . Tide Height2.2
0.7 1 ~ ~ , , e . S ~ I 2"0.,"
i,
.
,.
1.8
i
"
i
'
~
i
1.6
0.3
,.
...
t ?~
'
I;
1.4
= 0.1
~" -0.1
~.
1.0
"
,
-0.3
0.8
-0.5
I
I
[
I
I
0.6
12:00
18:00
0:00
6:00
12:00
18:00
0:00
6:00
12:00
12:00 9/6 - 12:00 9/8, 1994
FIG. 4. Diurnal fluctuation of temperature differences between the sampling site and the thermal couple recorder location for long time SSTs measurements. Temperature differences of up to 0.7°C were found over short timescale (hour). However, the 24 hour average difference was less than 0.15°C, between the two locations. Tidal heights are also plotted.
Santschi, 1993; Martin et al., 1995). It is not clear how should one filter the water sample such that it best represents the seawater fi'om which coral extracts the Sr and Ca. dVSN found no significant difference between filtered (0.45 #m) and unfiltered seawater samples of open ocean in the central North Pacific Ocean. However, this is not necessarily appli- cable to the coastal water in the semi-enclosed Nanwan Bay. As an exploratory test, we divided our November seawater sample into three portions, one unfiltered, the other two fil- tered using 5 #m and 0.45 #m filters, respectively. As shown in Table la, the Sr/Ca ratio of unfiltered one is only 0.0057 retool/tool higher than the one filtered by 0.45 #m mem- brane. This result is similar to dVSN's. But the one filtered by 5 #m membrane showed a Sr/Ca 0.030 mmol/mol higher than those filtered by 0.45 #m membrane. Similar offsets were also found in three other samples. This phenomenon suggests that particulates between 0.45-5 #m possess higher Sr/Ca ratios. Using the measured Ca concentrations for the three fractions of the 11/6 sample, we can infer the Sr/Ca of the three components that contributed to the seawater Ca and Sr at Kenting in Table lb. It is also conceivable that the
blank in 5 #m filters may contribute to the high Sr/Ca for that fraction. To conform to the usual convention, we still decided to pass all of our seawater samples through 0.45 #m filters before measurements. Whether this is the correct procedure should be a subject for further study.
The average Sr/Ca ratio of seawater samples for 1993 at our sampling site is 8.551 mmol/mol (Fig. 5a, Table 2) well within the worldwide range of 8.5116-8.5855 mmol/mol as compiled by dVSN. We will use this value to represent the seawater value in the distribution coefficient calculation below. However, the total range of seawater St/Ca was 8.539-8.572 mmol/mol. This range of 0.033 mmol/mol cor- responds to a temperature artifact of 0.7°C. The existence and magnitude of such temporal variations should be the subject of careful further investigation. This will be neces- sary before the high precision and time resolution of this new powerful thermometer can be fully exploited. Further- more, how different the seawater [Sr/Ca] was during glacial and the last interglacial remains an important yet open ques- tion. Sea surface Sr/Ca ratio of November, 8.572 mmol/ mol, is higher than the ratios of other months, 8.539-8.560
Table I a. St/Ca of seawater samples filtered by different membranes, a Table lb. Three components for coastal seawater at Nanwan Bay, Kenting. a
Date 8/31/93 9/28/93 12/10/93 11/6/93 [Ca] ,amol/g [Ca] # m o l / g Percent % Sr/Ca mmol/mol
No filtration 8.5780 10.332 < 0.45 g m 9.626 93 8.572
5 g m 8.5635 8.5749 8.6110 8.6030 10.030 0.45 ~ 5 g m 0.406 4 9,317
0.45 btm 8.5413 8.5513 8.5421 8.5723 9.626 > 5 ~tm 0.302 3 7.776
a. 2cr reproducibility = +--0.0047 mmol/mol as determined by three separately spiked samples for the same seawater.
a. Calculated from 11/6 data in Table la.
mmol/mol. This may possibly be the consequence of the intrusion of deep water masses brought up by the Kuroshio and the current from the South China Sea. Their high salinity and high nutrient (Shaw, 1989) can increase Sr/Ca which correlates with nutrient according to dVSN. Alternatively, it may be a local runoff effect. A water sample collected from a local stream nearby has a high Sr/Ca of 8.833 mmol/mol. This is expected as the entire area was covered by raised coral reefs which release Sr preferentially when they are altered by interacting with fresh water.
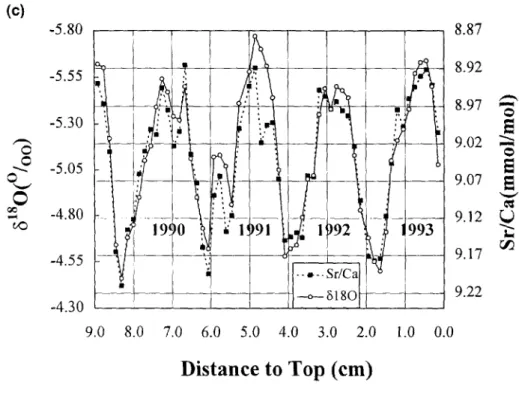
Similar problems are well known in oxygen isotope ther- mometry. At Nanwan Bay, because of the heavy seasonal rain in the summer and early autumn (Fig. 5b), there is an offset in ~5~80 of 0.18%~, between the July to January values and the February to June values. The annual 6~sOpDn range of 0.24%0 (2 × S.D.) also corresponds to a temperature shift of more than I°C temperature difference. A comparison between Sr/Ca ratio and 6t~Opt~B of P. lutea suggests that there may be a 6~sO anomaly of ~0.4%~, ( - + 1 . 5 ° C ) in the summer of 1991, possibly because of the more intense precipitation of that season (Fig. 5c).
4.3. The Sr/Ca-SST Relationship for Porites Corals
The Sr/Ca-SST relationship was established using the data for January 1989 to January 1991. We converted the sampling positions to time periods by assuming that the winter and summer temperature extremes correspond to the extreme Sr/Ca ratios. In between the five extremes constant growth rates were assumed. For P. lobata, we found that the growth rates for these four periods are all about 15-16 ram/ yr (Fig. 6a). For P. lutea, the growth rates throughout 1989 were about 18 mm/yr while from January to August of 1990 it grew at a rate of almost 20 mm/yr and then accelerated to 23 mm/yr between August 1990 and January 1991 (Fig. 6b). Linear least square regression minimizing the deviation in Sr/Ca gave the following relationships between skeletal Sr/Ca and SST (Fig. 6c):
Sr/Ca (retool/tool) = 10.307 - 0.0505 × SST(°C)
R 2 = 0.91 forP. lutea; (1)
Sr/Ca (mmol/mol) = 10.356 - 0.0528 × SST(°C) R 2 = 0.96 for P. lobata. (2) The 95% confidence envelope of Eqn. 1, calculated using the regression method of Draper and Smith (1980), indicates that SST can be inferred from Sr/Ca measurements using this calibration to about ±0,2°C. This is close to what analyt-
ical uncertainty of 0.44%~, in Sr/Ca alone can account for (~O.l°C).
4.4. lntragenus Variation
The sensitivity of Sr/Ca ratio uptake changed by SST is 0.0505 mmol/mol/°C for P. lutea and 0.0528 mmol/mol/ °C for P. lobata. The two Sr/Ca-SST relationships are not significantly different at 95% confidence interval. Compared to P. [obata, the P. lutea relation gives the same temperature in winter but slightly warmer temperature in summer by only 0.2-0.3°C (Fig. 6c). Since the growth rates probably were not constant between extremes, we are currently investigat- ing the effect of using different assumptions on the growth rate model (e.g., cosine function, Taylor et al., 1993) on the calibration relations. Furthermore, since coral Sr/Ca ratios are out of equilibrium, presumably driven by biological ki- netic effects, it will be prudent to check whether even distinct coral heads of the same species can display different kinetic effects as claimed by de Villiers et al. (1995). This check is in progress.
4.5. The Growth Rate Effect on Skeletal S r / C a
The difference of Sr/Ca uptake between the faster and slower growth rate for Pavona cIavus, a columnar coral, is significant (dVSN). The slower the growth rate is, the closer the D value approaches the equilibrium value of inorganic aragonite. They found this growth rate effect by comparing samples grown along a fast axis at 11 - 12 mm/yr and those grown along a slow axis at 4 - 7 mmlyr.
The different growth rates of P. lutea in the different periods that we studied provide an opportunity to check for growth rate effects. Separate Sr/Ca-SST relationships are constructed for summer to winter of 1989 and 1990, respec- tively (Fig. 6d). The growth rates of these two periods were 18 mm/yr and 23 mm/yr, respectively, a difference of 28%. The difference between these two relationships is less than 0.1 °C and they are indistinguishable at 95% confidence inter- val. This result, when combined with the P. lobata result, suggests that a single Sr/Ca-SST relationship can be used for Porites sp. whose growth rates vary between 15 and 23 ram/yr.
4.6. Comparison between D[ S r / C a ]-SST Calibrations
The various Sr/Ca vs. SST relationships are not directly comparable because seawater Sr/Ca differences would offset them (Fig. 7a). Since different water masses may have their
(a)
8.650 8.625 8.600G
8.575
r,,) 8.550 r ~ 8.525 8.500(b)
., - I [ -- ~-. Sr/Ca r 0.20 ~ j kx,~ 0.00 i " ,I,-I, -0.10 • ." ", -0.20 . . . ." f
-0.30
~ analyses ] -0.40I for seawater samples
. . . 0.50 12 1 2 3 4 5 6 7 8 9 10 I1
Month(1993)
0
cx~ , ~ , 20 -~ 10 * M I 1988 1989 1990 1991 1992Year
FIo. 5. (a) Annual variation of Sr/Ca and 618OpDB in the sea surface water (0.45 ~m filtered) determined by monthly sampling throughout 1993. The variation of 6 J sOpD~ depends on rainfall. Summer (wet season) 6~8OpDB in the sea surface water is ~0.18%c lighter than that in winter. The ratio of Sr/Ca varies less systematically and was possibly influenced more by the oceanic current. The mean of annual Sr/Ca ratio was 8.5514 mmol/mol. The 2 × S.D. is _+0.0204 mmol/mol which corresponds to _+0.4°C in SST. (b) The monthly precipitation data from 1988- 1992. Note that the rainfall in Kenting concentrates in the summer months. Also note that the summer of 1991 saw the most intense precipitation thus fresh water input. (c) Comparison between Sr/Ca ratio and 6~sOpD~ of P. lutea, there was an apparent 6~sO anomaly with a decrease of 0.4%~ in the summer of 1991 possibly caused by the large freshwater input.
o w n inherent S r / C a ratios ( d V S N ) , we first note that the m e a n S r / C a ratio o f sea surface water in N a n w a n Bay, 8.551 m m o l / t o o l , is h i g h e r than that in the H a w a i i a n Islands, 8.510 m m o l / m o l by a difference of 0.041 m m o l / m o l , correspond- ing to about 0.7°C in temperature difference. The effect can
be corrected by subtracting off the sea water differences, and
Sr/CaN = 10.266 - 0.0505 × S S T for P. lutea, ( 3 ) Sr/CaN -- 10.315 - 0.0528 x SST for P. lobata, ( 4 )
(c)
o O O©
t,o - 5 . 8 0 - 5 . 5 5 - 5 . 3 0 - 5 . 0 5 - 4 . 8 0 - 4 . 5 5 - 4 . 3 0 9 . 0 - - - } 8 . 8 7 8 . 9 2 8.97 9 . 0 2 9 , 0 7 9 . 1 2 9 . 1 7 9 . 2 2 8 . 0 7 . 0 6 . 0 5 . 0 4 . 0 3 . 0 2 . 0 1.0 0 . 0Distance to Top (cm)
F~G. 5. (Continued)d
"c
where Sr/CaN is the corrected coral S r / C a ratio n o r m a l i z e d to the S t / C a ratio of sea surface water in the H a w a i i a n Islands ( d V S N ) by taking off the discrepancy of S r / C a ratio b e t w e e n different sea surface waters and defined as
Sr/Ca~. ~ Sr/Cacora, -- ] S r / C a ... - 8.510]. ( 5 ) In Eqn. 5, Sr/Ca~e~w~r is the S r / C a ratio of sea surface water of the sampling site and the unit is retool/tool. T h e m e a n S r / C a value for two seawater samples from the coral sam- piing site in New C a l e d o n i a of Beck et al. ( 1 9 9 2 ) was 8.4641 m m o l / m o l ( B e c k , 1995, pers. c o m m u n . ) . So, we can normal-
Table 2. Sea water Sr/Ca and 8180~oB of Nanwan sampling site. a
Date Month 81SO(%o) Sr/Ca (mmol/mol)
1/3/93 1 -0.04 8.5549 2/5/93 2 0.11 8.5581 3/6/93 3 0.08 8.5606 3/31/93 4 0.12 8.5432 5/1/93 5 0.14 8.5416 6/5/93 6 0.15 8.5571 7/3/93 7 -0.07 8.5385 7/31/93 8 -0.05 8.5550 8/31/93 9 0.00 8.5413 9/28/93 10 -0.03 8.5513 11/6/93 11 0.00 8.5723 12/10/93 12 -0.09 8.5421 Max. 0.15 8.5723 Min. -0,09 8.5385 Mean 0.03 8.5514 2xS.D. 0.17 0.0204
a. All water samples were filtered using 0.45~tm membranes.
ize their S r / C a to the Hawaii seawater also. The resulting three S r / C a - S S T lines overlap m u c h better after this normal- ization (Fig. 7 a ) . Therefore, w h e n the S t / C a ratios of local seawater and o f coral skeleton are known, SST can be calcu- lated ( a s s u m i n g a H a w a i i a n sea surface water S r / C a value of 8.510 m m o l / m o l ) from
S S T = 34.77 + 19.80
× (Sr/Ca~e, - Sr/Cacoral) for P. lutea, ( 6 ) S S T = 34.19 + 18.94
× ( S r / C a ~ , - Sr/Caco,al) for P. lobata. ( 7 ) A n alternative approach to account for the seawater effect is to use the distribution coefficient (Fig. 7 b ) , defined as
D [ S r / C a ] =- [ S r / C a ] c o J [ S r / C a ] .... ( 8 ) The c o r r e s p o n d i n g equations for D [ S r / C a ] are
P. lutea: D = 1.2054 - 0.005901 X SST ( 9 ) P. l o b a ~ : D = 1 . 2 l l l - 0.006179 x SST D = 1.2381 - 0.007378 × SST D = 1.2875 - 0.009268 x SST (this w o r k ) , ( 1 0 ) ( B e c k ) , ( 11 ) ( d V S N ) . ( 1 2 ) W h e n Eqns. 10 and 12 are compared, we f o u n d that the two P, lobata lines intersect at a b o u t 24°C w h i c h is close to the m e a n annual SST (Fig. 7 b ) . Therefore, there is little difference w h e n either equations is used for the m e a n a n n u a l SST. However, the slopes of the two equations are quite
(a)
r ~ r ~ 29 27 26 25 24 23 22 2l I I / I t i ---,-- SST ~ Kenting: P. lobata _ ... Sr/Ca P~t~ _.'=' IL
1 )8 1990 g D a t e 8.84 8.89 8.94 ~" 0 8.99 9.04 9.09 9.14 9.19 9.24(b)
29 8.83 Kenting: P. lutea .. 8.88281~
... St/Ca ~ , o ,~, 27 ~ i ~ ~ , . 8.988"93; ~" 26 ' -- ~ , ¢ 9.03 [...., 25 '::/f/ '~ 9.08 I= ~ra~ 24 ~ /__1~89._7~,,£.. ' " t 1990 ~ ~ ' ~ I 9.13 23 9.18 22 9.23 21~ ~ ~ :
e
~ ~ ~ ~ ~
D a t e(c)
9.5 . . . . i . . . . i . . . . i . . . . i . . . . J . . . . i . . . . i . . . . i . . . . , . . . . 9.4 "- P. lutea ~ ... A ... P. l o b a t a 8.9 95% Confidence Interval " ~ . ~ \ ~ > . . 8.8 . . . ,, ', ,, ' . . . , ~ 2 0 21 2 2 23 2 4 25 2 6 2 7 2 8 2 9 3 0 S e a S u r f a c e T e m p e r a t u r e ( ° C ) o 9.3E
o 9.2 9.1 ~ 9.0 r . ~(d)
9.5 9.4 9.3 9.2 9.0 8.9 8.8 20 . . . . i . . . . i . . . . i . . . . q . . . . i . . . . i . . . . i . . . . i . . . . r . . . .: ... • ... Growth Rate = 23 mm/yr
. (from 1990 summer to 1990 winter)
~ - - - Q - ~ Growth Rate = 18 mm/yr
~ o m 1989 summer to 1989 winter)
21 22 23 24 25 26 27 28 29 30
Sea Surface Temperature (°C)
F1c. 6. (a) Comparison between SST and skeletal Sr/Ca variations in P. lobata from 1988-1991. We convert the sampling positions to time periods by assuming that the temperature extremes correspond to the extreme Sr/Ca ratios. (b) Similar plot for P. lutea. (c) Plot of Sr/Ca vs. SST for P. lutea and P. Iobata. The two calibrations agree within respective 95% error envelopes. For the same Sr/Ca ratio, the inferred temperatures are identical in winter and differ by at most 0.2 ~ 0.3°C in summer. (d) The growth rate effect on skeletal Sr/Ca-SST relationship for P. lutea. The growth rates were 18 mm/yr from July to Dec., 1989 and 23 mm/yr from July, 1990 to Jan., 1991. Nevertheless, the slopes of two Sr/Ca-SST relationships are indistinguishable within their respective 95% confidence intervals.
different. This will lead to a difference of about + 1.2°C in summer at 27°C and about 1.2°C in winter near 21°C. B e c k ' s line (Eqn. 11) agrees with that of d V S N ' s at high temperature while it agrees with ours at low temperature (Fig. 7b).
Since our D - S S T lines have slopes only 67% that of d V S N one may wonder whether the smaller amplitudes of our mea- sured S r / C a variation for the same SST are caused by im- proper sampling which might have averaged over uneven coral growth horizons. This artifact is unlikely to be the cause of the interlaboratory discrepancy because our 6~80 sensitivity to SST is 0.19%d°C for P. l o b a t a . This compares favorably with the 0.18-0.21%c/°C values reported by McConnaughey (1989) and Gagan et al. (1994). If during our sampling we had inadvertently averaged the coral growth then one would have expected the same decrease in 6t80 thus a SST sensitivity close to 0.12%d°C. This also does
not appear to be a temperature effect as that observed for U / C a vs. SST by Min et al. (1995) for Tahiti ( 2 8 - 2 9 ° C ) and New Caledonia ( 2 0 - 2 7 ° C ) since the temperature ranges for Kenting, New Caledonia, and Hawaii used in the three studies were: 2 2 - 2 8 ° C , 2 0 - 2 7 ° C , and 2 3 - 2 8 ° C , respec- tively.
4 . 7 . A p p l i c a t i o n to P r e v i o u s W o r k o n G r e a t B a r r i e r R e e f a n d N e w C a l e d o n i a C o r a l s
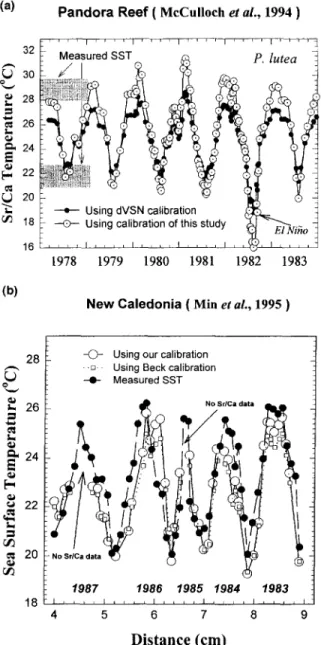
McCulloch et al. (1994a) studied the S r / C a coral record for the Great Barrier R e e f of Australia and found a clear signal of the 1 9 8 2 - 1 9 8 3 E1 Nifio. In Fig. 8a we plot their SST inferred using S r / C a and d V S N ' s calibration. For 1978 and 1979, we also recalculated the S S T using our calibration. This leads to an upward revision of the summer temperature maximum from 27°C to about 29°C. The revised SST seems
(a)
9.4 9.3 9.2 [= 9.1N
9.0 8.9 . , . i . . . . f . . . . i . . . . i . . . . i . . . . i . . . . ~ . . . . i . . . . i , , , • [ C o r a I : P l o b a t a ] ~ " • T h i s s t u d y S e a w a t e r n o r m a l i z a t i o n . ~ N , X ~ ~8.8 - 2-2
20 21 22 23 24 25 26 27 28 29 30 S e a S u r f a c e T e m p e r a t u r e ( ° C ) (b)D
1.14 1.12 1.10 1.08 1.06 1.04 1.02 20 21 22I ,.i
. . . . i , , , i . . . . i . . . . i . . . .= .... r
. . . . i ¸ , ~ , , , . . . . P. l u t e a in this study D = 1 . 2 0 5 4 - 0 0 0 5 " 9 0 1 * S S T - - P. l o b a t a in thisstudy
D = 1 2 1 1 1 - 0 0 0 6 1 7 9 * S S T . . . P. l o b a t ain
dVSN D = 1 . 2 8 7 5 - 0 . 0 0 9 2 6 8 * S S T P. I o b a t ain
Beck • • D = 1.2381 - 0 0 0 7 3 7 8 * S S T 23 24 25 26 27 28 29 30 S e a S u r f a c e T e m p e r a t u r e (oC)FIG. 7. (a) Comparison between Sr/Ca-SST relationships estab- lished by Beck et al. (1994), dVSN, and ours. There are serious inconsistencies between these relationships, partly caused by the difference in the Sr/Ca ratios of the sea surface waters at different sites. Normalizing the seawater Sr/Ca to that of Hawaii would shift our calibration line and Beck's line towards the dVSN line thus reducing the differences. Note the SST used by Beck et al. (1992, 1994) was inferred from oxygen isotope data indirectly. (b) The corresponding D [Sr/Ca]-SST relationships.
to agree better with the mean s u m m e r m a x i m u m temperature o f 28.8°C estimated from direct m e a s u r e m e n t s made at nearby stations over 1 9 7 5 - 1 9 7 8 (Gagan et al., 1994). The shift is o w i n g to mostly the difference b e t w e e n our calibra- tions and dVSN, not intragenus differences. Similarly, we also note that the SST inferred using the indirect 6 ~ O - S r / Ca calibration o f Beck et al. (1992, 1994) by Min et al. ( 1 9 9 5 ) were lower than the actual measured SST (Fig. 8b). Although the inferred SST is coincident with the actual mea- sured SST in winter, there is a discrepancy about 1 - 2 ° C in summer. Using the S t / C a ratio o f 8.464 m m o l / m o l for their seawater (Beck, 1995, pets. c o m m u n . ) , we can reconstruct the SST by our n e w calibration (Eqn. 7 or Eqn. 10). The discrepancy in s u m m e r using B e c k ' s thermometry is reduced
to half the original size. These two applications o f our cali- bration s e e m to support its validity.
5. CONCLUSIONS
W e have confirmed that potentially paleo-SST can be in- ferred f r o m coral [ S r / C a ] with an accuracy better than --0.2oC.
(a)
32 ~.) 30 % , 28 26 L e~ 24E
22 20 "c 18 16 (b) P a n d o r a R e e f ( M c C u l l o e h et al., 1994 ) 1978 1979 1980 1 9 8 1 1982 1983 N e w C a l e d o n i a ( M i n et aL, 1995 ) 28 ~J %, t,,. 26 24E
22 ;¢1 20 -(3- - - E 3 . • - 0 - 2 N o S r l C aUsing our calibration
Using Beck calibration
Measured SST NO S r l C a data 1985 1984 1987 1986 1983 1 8 , , ~ , I , ~ ~ , I . . . . I . . . . I , , , , I 5 6 7 8 9
Distance (cm)
FIG. 8. (a) Application of the new calibration to the Great Barrier Reef. Sr/Ca temperature (open circles) was obtained on P. lutea but estimated using dVSN's calibration for P. lobata by McCulloch et al. (1994a). We have recalculated the temperatures using our calibration for P. lutea (open circles). The recalculated temperature agrees better with the range directly measured at a nearby station (shaded bars). (b) Similar plot for New Caledonia corals (Min et al., 1995). They used Beck's Sr/Ca-SST thermometer (1994) to reconstruct the local sea surface temperatures from 1983-1987 (open square). The inferred SST is coincident with the actual mea- sured SST near Amedee Lighthouse, Noumea, New Caledonia ( solid circle) in winter; however, there is a discrepancy about 1 ~ 2°C in summer. If our new calibration is applied (open circle) then the discrepancy would be reduced by half.
W e have devised a micro-surgical m e t h o d to sample coral with a resolution better than 0.15 mm, corresponding to less than one week in growth time.
U s i n g a continuous temperature record, we have calibrated the D [ S r / C a ] - S S T relations for both P. lobata and P. lutea. These two relations are identical within errors thus sug- gesting that there is no intragenus effect b e t w e e n the two species. Pooling their data together and fitting a linear rela- tion, we r e c o m m e n d a single SST calibration for the S r / C a t h e r m o m e t e r on coral Porites:
St/CaN = 10.286 - 0.0514 × SST (N: normalized to Hawaii seawater S r / C a
= 8.510 m m o l / m o l ) ( 1 3 ) D = 1.2077 - 0.006011 × SST. ( 1 4 ) The calibrations established using P. lobata and P. lutea g r o w i n g at rates b e t w e e n 15 and 23 m m / y r are identical within respective errors and there exists little growth rate effect for the calibrations.
C o m p a r i n g the d V S N ' s calibration on P. lobata with ours, we found a difference o f up to 1.2°C b e t w e e n 2 1 - 2 7 ° C . Therefore, this inter-laboratory difference needs to be re- solved. Another calibration, obtained s o m e w h a t indirectly by Beck et al. ( 1992, 1994, and pers. c o m m u n . ) , lies b e t w e e n the two direct calibrations.
Seawater sampled at monthly intervals over 1993 show a range o f [ S r / C a ] o f 0.033 m m o l / m o l equivalent to a temper- ature uncertainty o f _+0.7°C. Thus the variability o f seawater [ S r / C a ] may limit the accuracy o f the new t h e r m o m e t r y thus needs to be investigated.
Acknowledgments--Dr. Chang Hwa ( " C h i n a " ) Chen of this insti-
tute kindly transferred his micro-sampling technology for igneous mineral grains to our coral sampling. Ms. Shu-Feng Wu and Pei- Shan Tsai of this institute graciously helped with the oxygen and carbon isotopic analyses. Mr. Hsin-Wei Chen of this institute gener- ously aided our field work. Mr. Jer-Feng Chang of the Third Nuclear Power Plant kindly provided SST data. We are also grateful to Mr. Deng-Song Chen of the Institute of Oceanography, National Taiwan University, for his assistance with underwater corals sampling. Con- structive and comprehensive reviews by T. M. McConnaughey and J. W. Beck significantly improved the paper. Comments on the possible averaging effect of our micro-sampling methods by Profes- sor R. Fairbanks of the Lamont-Doherty Earth Observatory of Co- lumbia University were useful. This research was supported in part by a grant (NSC84-2111-M-001-027 GP) from the National Science Council of the Republic of China. This is contribution IESEP96- 014 of the Institute of Earth Sciences, Academia Sinica, Taipei.
Editorial handling: R. A. Schmitt REFERENCES
Baskaran M. and Santschi P. H. (1993) The role of particles and colloids in the transport of radionuclides in coastal environments of Texas. Mar. Chem. 43, 95-114.
Beck J. W. et al. (1992) Sea-surface temperature from coral skeletal Strontium/Calcium ratios. Science 257, 644-647.
Beck J. W. et al. (1994) Errata to Beck et al. (1992). Science 264, 891.
Dai M. H., Martin J. M., and Cauwet G. (1995) The significant role of colloids in the transport and transformation of organic carbon and associated trace metals (Cd, Cu, and Ni) in the Rhone delta (France). Mar. Chem. 51, 159-175.
de Villiers S., Shen G. T., and Nelson B. K. (1994) (abbreviated as dVSN) Sr/Ca thermometry in corals: Method calibration and evaluation of (Sr/Ca) ... t~r and interspecies variability. Geochim.
Cosmochim. Acta 58, 197-208.
de Villiers S., Nelson B. K., and Chivas A. R. (1995) Biological controls on coral Sr/Ca and 6~O recontructions of sea surface temperatures. Science 269, 1247-1249.
Draper N. R. and Smith H. (1980) Applied Regression Analysis. 2nd ed., Wiley.
Gagan M. K., Chivas A. R., and Isdale P. J. (1994) High-resolution climate records from corals using ocean temperature and mass- spawning chronometers. Earth Planet. Sci. Lett. 121, 549-558. Goldberg E. D., Backer M., and Fox D. L. (1952) Microfiltration
in oceanographic research. J. Mar. Res. 11, 194-204.
Guilderson T. P., Fairbanks R. G., and Rubenstone J. L. (1994) Tropical temperature variations since 20,000 years ago: Modulat- ing interhemispheric climate change. Science 263, 663-665. Kinsman D. J. and Holland H. D. (1969) The coprecipitation of
cations with CaCO3-IV. the co-precipitation of Sr 2+ with aragonite between 16°C and 96°C. Geochim. Cosmochim. Acta 33, 1-17. Lee T., Shen C. C., Chen C. Y., Wang C. H., and Dai C. F. (1995)
SST-D [Sr/Ca] calibration for two Porites coral species with on- site continuous temperature recording and seawater [ Sr/Ca] moni- toring. EOS(Trans. Amer. Geophys. Un.) 76, 179-180. Martin J. M., Dai M. H., and Cauwet G. (1995) Significance of
colloids in the biogeochemical cycling of organic carbon and trace metals in a coastal environment example of the Venice Lagoon (Italy). LimnoL Oceanogr. 40, 199-131.
McConnaughey T. A. (1989) ~3C and ~80 isotopic disequilibria in biological carbonates. I. Patterns. Geochim. Cosmochim. Acre 53, 151-162.
McCulloch M. T., Gagan M. K., Mortimer G. E.. Chivas A. R., and Isdale P. J. (1994a) A high-resolution Sr/Ca and 6 JsO coral record from the Great Barrier Reef, Australia, and the 1982-1983 E1 Nifio. Geochim. Cosmochim. Acta 58, 2747-2754.
McCulloch M. T., East T., Mortimer G. E., Li X. H., and Chivas A. R. (1994b) High resolution windows into Holocene-Pleisto- cene climate: Sr/Ca coral records of sea surface temperature from the Huon Peninsula, New Guinea. EOS(Trans. Amer. Geophys.
Un.) 75, 333.
Min G. R., Edwards R. L., Taylor F. W., Recy J., Gallup C. D., and Beck J. W. (1995) Annual cycles of U/Ca in coral skeletons and U/Ca thermometry. Geochim. Cosmochim. Acta 59, 2025-2042. Russell W. A., Papanastassiou D. A., and Tombrello T. A. (1978) Ca isotope fractionation on the Earth and other solar system materials.
Geoehim. Cosmochim. Acta 42, 1075-1090.
Shaw P. T. (1989) The intrusion of water masses into sea southwest of Taiwan. J. Geophys. Res. 94, 123-128.
Smith S. V., Buddemeier R. W., Redalje R. C., and Houck J. E. (1979) Strontium-Calcium thermometry in coral skeletons. Sci-
ence 204, 404-407.
Taylor R. B., Branes D. J., and Lough J. M. (1993) Simple models of density band formation in massive corals. J. Exp. Mar. Biol.
Ecol. 167, 109-125.
Weber J. N. ( 1973 ) Incorporation of strontium into reef coral skeletal carbonate. Geochim. Cosmochim. Acta 37, 2173-2190.