國
立 交 通 大 學
機
械 工 程 學 系
碩士論文
狹窄水平雙套管中 R-410A 冷媒流量震盪與可變功率之週期
性流動沸騰研究
Time Periodic Flow Boiling of Refrigerant R-410A due to
Refrigerant Flow Rate or Heat Flux Oscillations in a Horizontal
Narrow Annular Duct
研 究 生 : 許書豪
指
導 老 師 : 林 清 發 教授
狹窄水平雙套管中 R-410A 冷媒流量震盪與可變功率之週期性
流動沸騰研究
Time Periodic Flow Boiling of Refrigerant R-410A due to
Refrigerant Flow Rate or Heat Flux Oscillations in a Horizontal
Narrow Annular Duct
研 究 生: 許書豪
Student: Shu -Hao Hsu
指
導 老 師 : 林清發
Advisor: Tsing-Fa Lin
國
立 交 通 大 學
機械工程學系
碩士論文
A Thesis
Submitted to Department of Mechanical Engineering College of Engineering
National Chiao Tung University In Partial Fulfillment of the Requirements
For the Degree of Master of Science In Mechanical Engineering
June 2010
Hsinchu, Taiwan, Republic of China
誌謝
兩年的研究生生活在今年年中終於劃下句點。這些年來遇到許多人相識的、 不相識的;碰到許多事順意的、不如意的。如今在畢業口試後留在深深的記憶中。 能有此機會完成論文真如陳之藩在謝天中所言得之於人者太多出之於己者太少, 在這樣一個感恩的篇幅中,首先感謝指導教授林清發博士,在受於教林教授兩年 的時光中,深刻感受到一位諄諄學者的風範,在每次實驗細節討論與論文指導潤 筆中,所獲得的不僅是實驗結果物理意義深邃的闡釋,更是治學一絲不苟的呈現, 這些都令我受益匪淺。 幕然回首兩年前的此時,對於離家到新竹交大求學的我而言,心中真是充滿 了既期待又害怕的複雜心情。來到交大這充滿學術研究氣息的生活,讓我覺得在 此讀書做研究是一種享受。然而,一想到即將要離開這可愛的校園,不禁令人懷 念起在此的點點滴滴。要感謝實驗室許多臥虎藏龍的博士班:張文瑞、陳建安、 汪書磊學長們的幫忙及指導。同學游象麟、熊宏嘉、陳俊州的互相砥礪幫忙,當 然也少不了一群為實驗室注入活力、帶來歡樂的學弟們:房業勳及楊軒政的幫忙。 得之於人者太多,在此一同向所有幫助過我的人致謝。 最後,僅以本文獻給我所關心的人和所有關心我的人。 許書豪 2010, 6 於新竹交大狹窄水平雙套管中 R-410A 冷媒流量震盪與可變功率之週期性流動沸騰研究 研究生: 許書豪 指導教授: 林清發 國立交通大學機械工程學系
摘要
本研究以實驗方式探討R-410A新冷媒在水平狹窄雙套管中流動沸騰熱傳(含 次冷及飽和流動沸騰)及相關氣泡特徵之影響。流道之間隙為 2.0 mm。我們探討 了冷媒質通量或熱功率振盪、周期、飽和溫度、以及熱通量對熱傳係數及氣泡特 徵的影響。氣泡特徵包含氣泡脫離直徑和頻率以及成核密度可由流場觀測得之。 在實驗中,冷媒平均質通量從 300 到 500 kg/m2 在第一部份探討流量震盪的影響。流量在振盪過程中,在相對應的瞬時壁 溫、熱傳遞係數、氣泡脫離直徑、脫離頻率和成核址密度也會有振盪的現象發生, 但是當流量振盪的振幅和週期經過時間平均化之後的飽和態流動的暫態流動沸騰 熱傳特徵沒有明顯的影響,類似穩態的流動沸騰。然後我們定義單相沸騰、漸歇 性沸騰、完全沸騰。除此之外,在高振盪振幅、長週期的情況下對其壁溫會造成 更強烈的振盪情況發生。冷媒的飽和溫度和質通量對壁溫的振盪並無比較大的影 響。壁溫氣泡脫離直徑、脫離頻率和成核址密度震盪頻率和流量相同。在流量震 盪的時候,隨流量減少時振幅所造成成核址密度振盪遠大於氣泡脫離直徑和脫離 頻率所以使的壁溫降低、熱傳變好。 s,振幅為 10,20 和 30%,熱震盪 振幅為 10,30 和 50%,周期都分別為 20、60、120s,平均冷媒飽和溫度為 5, 10 和 15℃。 在第二部份探討熱功率震盪的影響。熱量在震盪過程中,壁溫、熱傳遞係數、 氣泡脫離直徑、脫離頻率和成核址密度也會有振盪的現象發生,但是會有相當明 顯的壁溫落後其熱量變化的時間,也就是熱量最高時,壁溫會在過一小段時間才 到達最高。另外當熱量振盪的振幅和週期經過時間平均化之後的飽和態流動的暫 態流動沸騰熱傳特徵沒有明顯的影響,類似穩態的流動沸騰。在高振盪振幅、長 週期的情況下對其壁溫氣泡脫離直徑、脫離頻率和成核址密度會造成更強烈的振 盪情況發生。Time Periodic Flow Boiling of Refrigerant R-410A due to Refrigerant Flow Rate or Heat Flux Oscillations in a Horizontal Narrow Annular Duct
Student: Shu -Hao Hsu Advisor: Prof. Tsing-Fa Lin Department of Mechanical Engineering
National Chiao Tung University
ABSTRACT
An experiment is carried out here to investigate the heat transfer and associated bubble characteristics in time periodic flow boiling of refrigerant R-410A in a horizontal narrow annular duct subject to a time periodic mass flux or heat flux oscillation. Both the imposed mass flux and heat flux oscillations are in the form of triangular waves. Effects of the refrigerant mass flux oscillation, heat flux oscillation, and refrigerant saturated temperature on the temporal flow boiling heat transfer and bubble characteristics are examined. The bubble characteristics at the middle axial location of the duct are obtained from the flow visualization of the boiling flow, including the time variations of the bubble departure diameter and frequency and active nucleation site density. The present experiment is conducted for the mean refrigerant mass flux G varied from 300 to 500 kg/m2s,the amplitude of the mass flux oscillation ∆G is fixed at 10, 20 and 30% and the amplitude of the heat flux oscillation ∆q is fixed at 10, 30 and 50% of their respective mean levelsGand , and the period of the G or q oscillation is fixed at 20, 60 and 120 seconds. The mean refrigerant saturation temperature Tsat is set at 5, 10 and 15 ℃. The
gap of the duct is fixed at 2.0 mm. The measured boiling heat transfer data are expressed in terms of the boiling curves and boiling heat transfer coefficients along with the time variations of the heated wall temperature.
In the first part of the present study the measured heat transfer data for the R-410A flow boiling for a constant coolant mass flux are first compared with the time-average data for the flow subject to a time periodic mass flux oscillation. This comparison shows that the mass flux oscillation exerts negligible influences on the time-average boiling heat transfer coefficients. Then, we present the data to elucidate the effects of the experimental
covering the single-phase, intermittent and persistent boiling flow regimes. The results indicate that the Tw oscillation is stronger for a higher amplitude and a longer period of the mass flux oscillation. However, the mean saturated temperature of the refrigerant exhibits much weaker effects on the Tw oscillation and the mean refrigerant mass flux exerts nonmonotonic effects on the amplitude of the Tw oscillation. Moreover, the heated wall temperature, bubble departure diameter and frequency, and active nucleation site density are found to oscillate periodically in time and at the same frequency as the mass flux oscillation. Furthermore, the oscillations of dp, f and nac are somewhat like triangular waves. In the first half of the cycle in which the mass flux decreases linear increases in dp and nac and linear decrease in f are found. The effect of ΔG/G on nac oscillation is much stronger than on dp and f oscillation causing the heated wall temperature to decrease and heat transfer coefficient to increase at reducing G in the flow boiling opposed to that in the single-phase flow. But they are only slightly affected by the period of the mass flux oscillation. Besides, a small time lag in the Tw
In the second part of the present study the measured heat transfer data for the R-410A flow boiling for a constant heat flux are also first compared with the time-average data for a time periodic heat flux oscillation. This comparison shows that the time-average heat transfer coefficients are not affected by the time periodic heat flux oscillation to a significant degree. Then, we present the data to elucidate the effects of the experimental parameters on the amplitude of T
oscillation is also noted.
w oscillation over a wide range of the mean imposed heat flux covering the single-phase, intermittent and persistent boiling flow regimes.The results indicate that the Tw oscillation gets stronger for a higher amplitude and a longer period of the imposed heat flux oscillation and for a higher mean imposed heat flux. Moreover, a significant time lag in the heated surface temperature oscillation is also noted, which apparently results from the thermal inertia of the copper inner pipe. The effects of the heat flux oscillation at extremely short and long periods have been explored. Due to the existence of the thermal inertia of the heated copper duct, the resulting heated surface temperature does not oscillate with time at an extremely short period of the imposed heat flux oscillation. When the mean imposed heat flux is close to the heat flux corresponding to that for the onset of stable flow boiling, intermittent flow boiling appears. A flow regime map and an empirical correlation are given to delineate the boundaries separating different boiling flow regimes in the annular duct subject to imposed heat flux oscillation. Furthermore, the bubble departure diameter and frequency, and active nucleation site
density also oscillate periodically in time and at the same frequency as the heat flux oscillation. The results also show that the oscillations in dp, f and nac get larger for a long period and a larger amplitude of the impose heat flux oscillation and for a higher mean imposed heat flux. Furthermore, the bubbles become smaller and more dispersed after the time lag when the imposed heat flux decreases with time. The opposite processes take place at increasing heat flux.
CONTENTS
ABSTRACT (CHINESE) i
ABSTRACT (ENGLISH) ii
CONTENTS v
LIST OF TABLES vi
LIST OF FIGURES viii
NOMENCLATURE xiv
CHAPTER 1 INTRODUCTION 1
1.1 Motivation 1
1.2 Literature Review 2
1.2.1 Stable Flow Boiling Heat Transfer 2
1.2.2 Time Periodic Flow Boiling Heat Transfer 4
1.2.3 Flow Patterns and Bubble Characteristics 6
1.2.4 Correlation Equations for Flow Boiling Heat
Transfer 7
1.3 Objective of the Present Study 8
CHAPTER 2 EXPERIMENTAL APPARATUS AND PROCEDURES 13
2.1 Refrigerant Flow Loop 13
2.2 Test Section 14
2.3 Water Loop for Preheater 15
2.4 Water-Glycol Loop 15 2.5 DC Power Supply 16 2.6 Photographic System 16 2.7 Data Acquisition 17 2.8 Experimental Procedures 17 2.9 Experimental Parameters 18
CHAPTER 3 DATA REDUCTION 27
3.1 Flow Boiling Heat Transfer Coefficient 27
3.2 Flow Boiling Bubble Characteristics 29
3.3 Uncertainty Analysis 30
CHAPTER 4 TIME PERIODIC SATURATED FLOW BOILING OF R-410A IN NARROW ANNULAR DUCT DUE TO MASS
FLUX OSCILLATION 33
4.1 Single-phase Heat Transfer 33
4.2 Stable and Time-average Saturated Flow Boiling Curves and
Heat Transfer Coefficients 34
4.3 Time periodic flow boiling heat transfer characteristics 35
4.4 Intermittent Boiling 38
4.5 Time Periodic Bubble Characteristics in Saturated Flow Boiling 39
CHAPTER 5 TIME PERIODIC SATURATED FLOW BOILING OF R-410A IN A NARROW ANNULAR DUCT DUE TO
HEAT FLUX OSCILLATION 101
5.1 Time-average Saturated Flow Boiling Curves and Heat Transfer
Coefficients 102
5.2 Time Periodic Flow Boiling Heat Transfer Characteristics 102
5.3 Intermittent Boiling 103
5.4 Effect of Heat Flux Oscillation at Extremely Short and Long Periods 104
5.5 Effect of Heat Flux Oscillation Amplitude 105
5.6 Time Periodic Bubble Characteristics in Saturated Flow Boiling 105
CHAPTER 6 Comparison of Flow Boiling in R-410A and R-134a 161
6.1 Comparison of Saturated Flow Boiling in R-410A and R-134a 161
6.2 Comparison of Time Periodic Flow Boiling in R-410A and
R-134a Due to Mass Flux Oscillation 161
6.3 Comparison of Time Periodic Flow Boiling in R-410A and
CHAPTER 7 CONCLUDING REMARKS 177
REFERENCES 179
LIST OF TABLES
Table 1.1 Table 1.1 Comparison of some properties of three HFCs refrigerants for
air-conditioning and refrigeration applications 9
Table 1.2 Heat transfer correlations for two-phase flow boiling in small channels 10 Table 2.1 List of conditions of the experimental parameters for R-410A (flow rate
oscillation) 19
Table 2.2 List of conditions of the experimental parameters for R-410A (heat flux
oscillation) 19
Table 2.3 Thermophysical properties of refrigerant R-410A 20
Table 3.1 Summary of the uncertainty analysis 31
LIST OF FIGURES
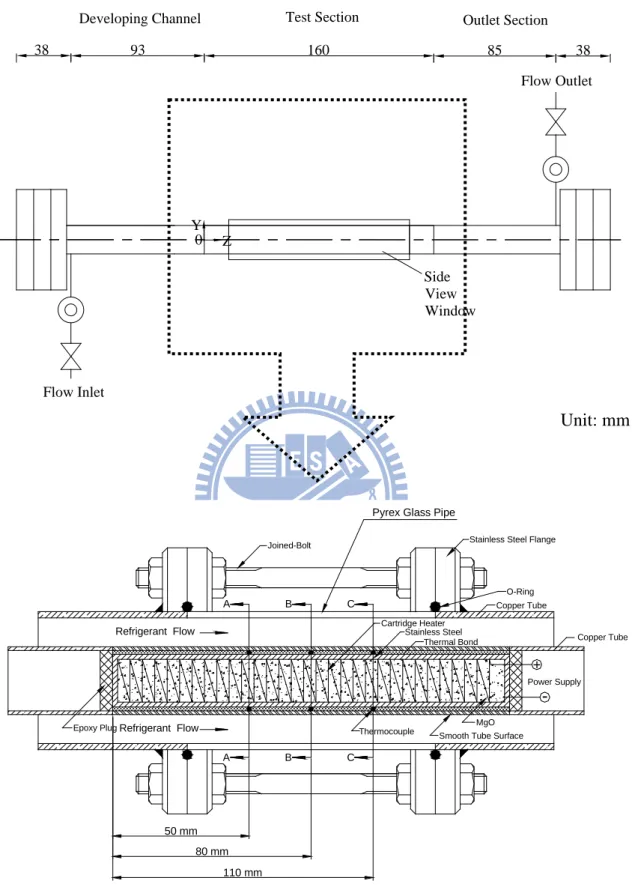
Fig. 2.1 Schematic of experimental system for the annular duct 21
Fig. 2.2 Schematic of mass flux control loop 22
Fig. 2.3 The detailed arrangement of the test section for the annular duct 23
Fig. 2.4 The cross-sectional view of the annular duct showing the heater and
locations of the thermocouples 24
Fig. 2.5 Schematic of heat flux control loop 25
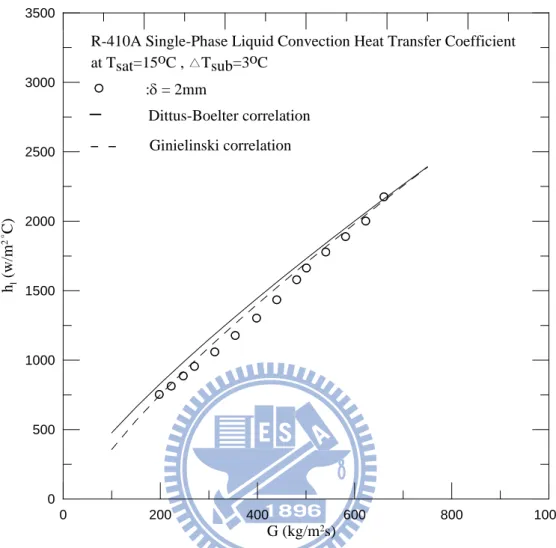
Fig. 4.1 Comparison of the preset single-phase liquid convection heat transfer data
with the correlations of Gnielinski and Dittus-Boelter. 43
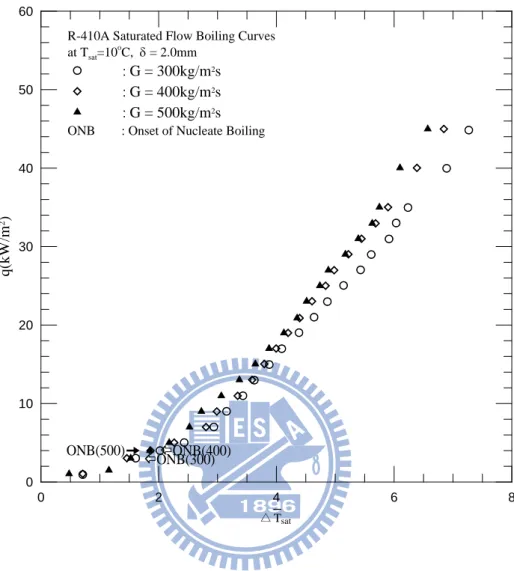
Fig. 4.2 Stable saturated flow boiling curves for R-410A for various refrigerant mass fluxes at Tsat=10
ο
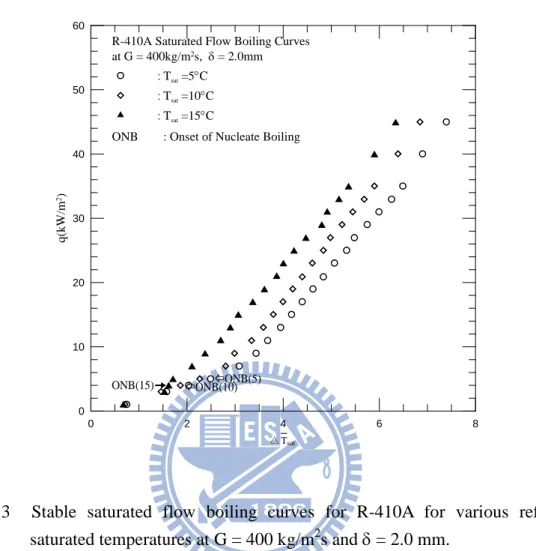
Fig. 4.3 Stable saturated flow boiling curves for R-410A for various refrigerant saturated temperatures at G = 400 kg/m
C and δ = 2.0mm. 44
2
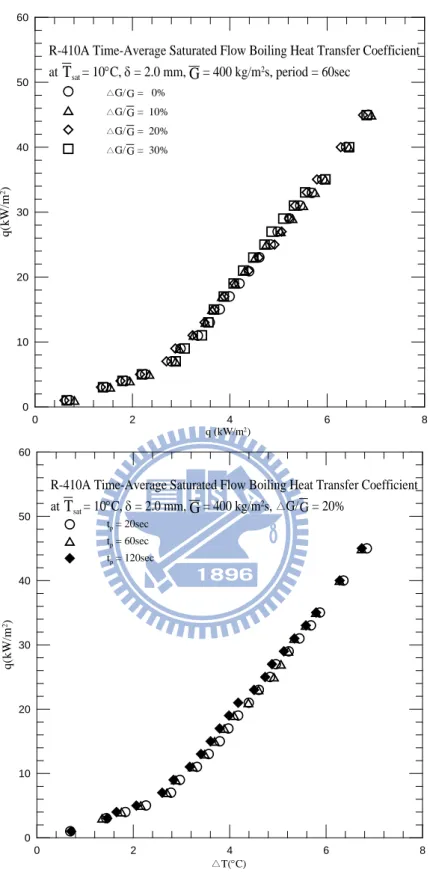
Fig. 4.4 Time-average flow boiling curves for R-410A for (a) various amplitudes of refrigerant mass flux oscillation at
s and δ = 2.0 mm. 45 sat T = o 10 C, δ = 2.0 mm,G= 2 400kg/m and tp o sat T =10 C
= 60 sec. and (b) various periods of refrigerant mass flux
oscillation at , δ = 2.0 mm,G=400kg/m2andΔG/G=20%. 46
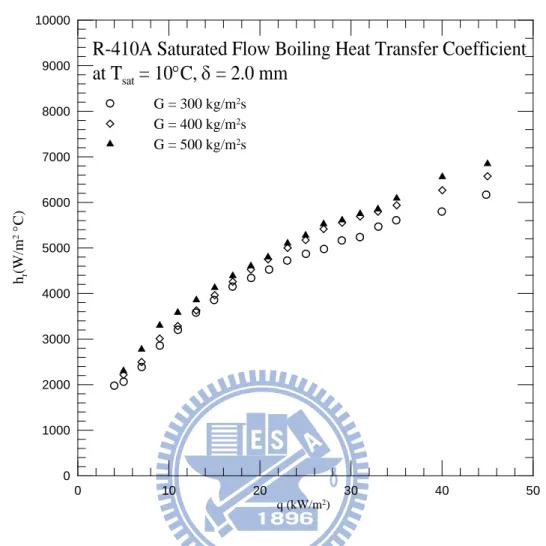
Fig. 4.5 Stable saturated flow boiling heat transfer coefficient for R-410A for
various refrigerant mass fluxes at T =10 C . sat o 47
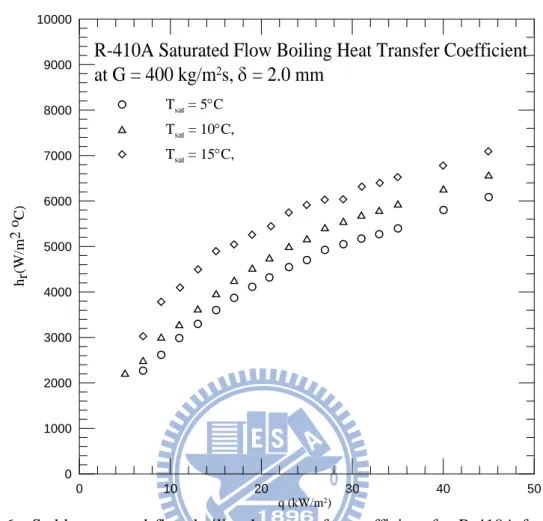
Fig. 4.6 Stable saturated flow boiling heat transfer coefficient for R-410A for various refrigerant saturated temperatures at G = 400 kg/m2
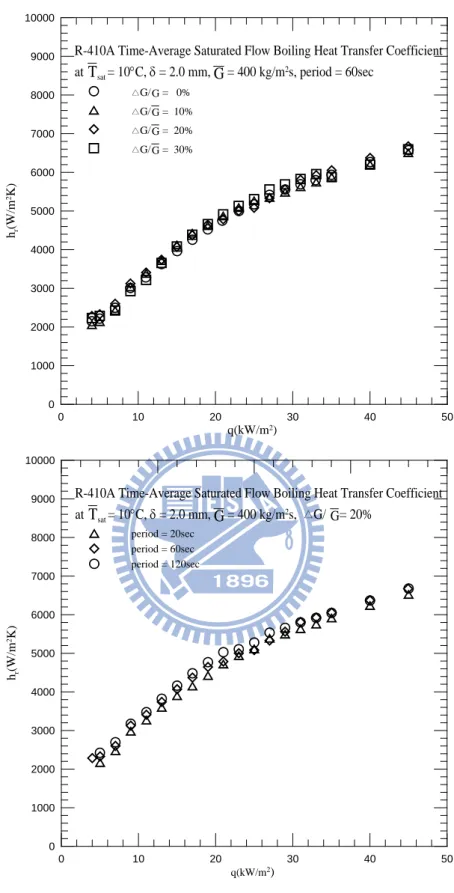
Fig. 4.7 Time-average heat transfer coefficients for R-410A for (a) various s and δ = 2.0 mm. 48 ΔG/G at o sat T =10 C , G = 400 kg/m2s, δ = 2.0 mm and tp = 60 sec. and (b) various tp at T =10 Csat o ,G = 400 kg/m2
ΔG/G=20%
s, δ = 2.0 mm and
49 Fig. 4.8 Time variations of the measured heated surface temperature for the stable
saturated flow boiling of R-410A for various imposed heat fluxes at (a) G = 300 kg/m2s and (b) G= 400 kg/m2
Fig. 4.9 Time variations of oscillating refrigerant mass flux and measured wall
temperature in time periodic saturated flow boiling of R-410A for various imposed heat fluxes at T =10 C , sat o δ = 2.0mm, tp = 60 sec and G= 400
kg/m2s with ΔG/G=10%. 51
Fig. 4.10 Time variations of oscillating refrigerant mass flux and measured wall temperature in time periodic saturated flow boiling of R-410A for various
imposed heat fluxes at T =10 C , sat o δ = 2.0mm, tp
G
= 60 sec
and =400kg/m2s with ΔG/G=20%. 52
Fig. 4.11 Time variations of oscillating refrigerant mass flux and measured wall temperature in time periodic saturated flow boiling of R-410A for various
imposed heat fluxes at T =10 C , sat o δ = 2.0mm, tp = 60 sec and G= 400
kg/m2s with ΔG/G=30%. 53
Fig. 4.12 Time variations of oscillating refrigerant mass flux and measured wall temperature in time periodic saturated flow boiling of R-410A for various imposed heat flux at T =10 C , δ = 2.0mm, tsat o p = 20 sec and G= 400
kg/m2s withΔG/G=20%. 54
Fig. 4.13 Time variations of oscillating refrigerant mass flux and measured wall temperature in time periodic saturated flow boiling of R-410A for various imposed heat flux at T =10 C , δ = 2.0mm, tsat o p = 120 sec and G= 400
kg/m2s with ΔG/G=20%. 55
Fig. 4.14 Time variations of oscillating refrigerant mass flux and measured wall temperature in time periodic saturated flow boiling of R-410A for various imposed heat flux at T =10 C , δ = 2.0mm, tsat o p = 60 sec and G= 300
kg/m2s with ΔG/G=20%. 56
Fig. 4.15 Time variations of oscillating refrigerant mass flux and measured wall temperature in time periodic saturated flow boiling of R-410A for various imposed heat flux at T =10 C , δ = 2.0mm, tsat o p = 60 sec and G= 500
kg/m2s with ΔG/G=20%. 57
Fig. 4.16 Time variations of oscillating refrigerant mass flux and measured wall temperature in time periodic saturated flow boiling of R-410A for various imposed heat flux at T =5 C , δ = 2.0mm, tsat o p = 60 sec and G= 400
kg/m2s with ΔG/G=20%. 58
Fig. 4.17 Time variations of oscillating refrigerant mass flux and measured wall temperature in time periodic saturated flow boiling of R-410A for various imposed heat flux at T =15 C , δ = 2.0mm, tsat o p = 60 sec and G= 400
kg/m2s with ΔG/G=20%. 59 Fig. 4.18 Time variations of flow boiling heat transfer coefficients in time periodic
saturated flow boiling of R-410A for various imposed heat fluxes at
o sat T =10 C , δ = 2.0mm, tp = 60 sec and G = 400 kg/m2 ΔG/G=10% s with . 60
Fig. 4.19 Time variations of flow boiling heat transfer coefficients in time periodic saturated flow boiling of R-410A for various imposed heat fluxes at
o sat T =10 C , δ = 2.0mm, tp = 60 sec and G = 400 kg/m2 ΔG/G=20% s with . 61
Fig. 4.20 Time variations of flow boiling heat transfer coefficients in time periodic saturated flow boiling of R-410A for various imposed heat fluxes at
o sat T =10 C , δ = 2.0mm, tp = 60 sec and G = 400 kg/m2 ΔG/G=30% s with . 62
Fig. 4.21 Time variations of flow boiling heat transfer coefficients in time periodic saturated flow boiling of R-410A for various imposed heat fluxes at
o sat T =10 C , δ=2.0mm, tp = 20 sec and G = 400 kg/m2 ΔG/G=20% s with . 63
Fig. 4.22 Time variations of flow boiling heat transfer coefficients in time periodic saturated flow boiling of R-410A for various imposed heat fluxes at
o sat T =10 C , δ =2.0mm, tp = 120 sec and G = 400 kg/m2 ΔG/G=20% s with . 64
Fig. 4.23 Time variations of flow boiling heat transfer coefficients in time periodic saturated flow boiling of R-410A for various imposed heat fluxes at
o sat T =10 C ,δ =2.0mm, tp = 60 sec and G = 300 kg/m2 ΔG/G=20% s with . 65
Fig. 4.24 Time variations of flow boiling heat transfer coefficients in time periodic saturated flow boiling of R-410A for various imposed heat fluxes at
o sat T =10 C ,δ =2.0mm, tp = 60 sec and G = 500 kg/m2 ΔG/G=20% s with . 66
Fig. 4.25 Time variations of flow boiling heat transfer coefficients in time periodic saturated flow boiling of R-410A for various imposed heat fluxes at
o sat
T =5 C ,δ =2.0mm, tp = 60 sec and G= 400 kg/m2s with ΔG/G=20%. 67 Fig. 4.26 Time variations of flow boiling heat transfer coefficients in time periodic
saturated flow boiling of R-410A for various imposed heat fluxes at
o sat
T =15 C ,δ =2.0mm, tp = 60 sec and G= 400kg/m2s with ΔG/G=20%. 68 Fig. 4.27 Effects of imposed heat flux on amplitudes of wall temperature oscillation
in time periodic saturated flow boiling of R-410A for various amplitudes of mass flux oscillation (a), periods of mass flux oscillation (b), mean
mass fluxes (c), and refrigerant saturated temperatures (d). 69
Fig. 4.28 Flow regime map for tome periodic R410A flow boiling regimes atδ =2mm, and tp
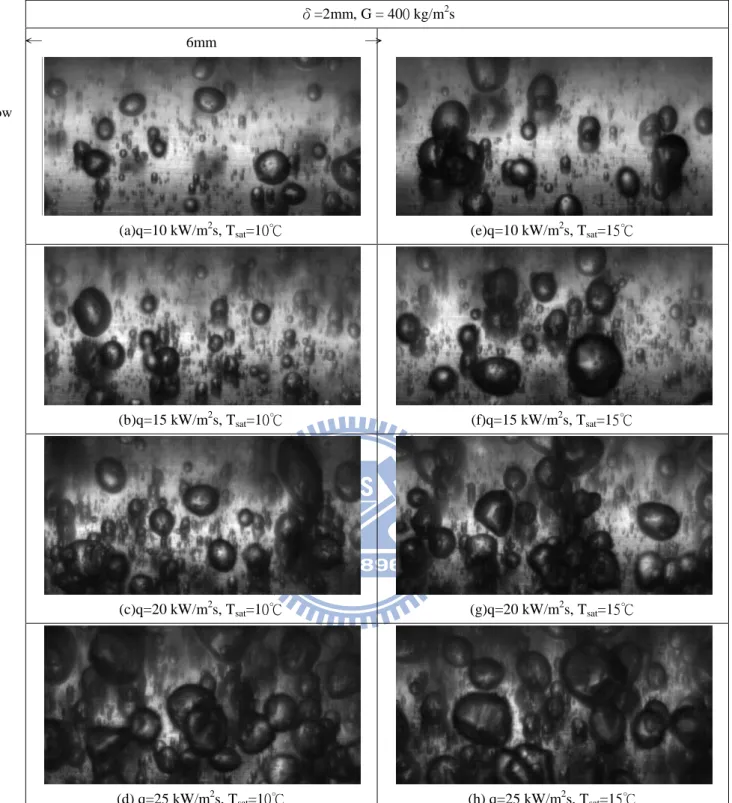
Fig. 4.29 Photos of boiling flow in stable saturated flow boiling of R-410A for various imposed heat flux at δ =2.0mm, t
= 60sec for various saturated temperatures and mean mass
fluxes. 71 p = 60 sec, G = 400 kg/m2 o o sat sat T =10 C & T =15 C s and . 72
Fig. 4.30 Photos of boiling flow in stable saturated flow boiling of R-410A for various imposed heat flux at δ =2.0mm, tp = 60 sec, T =10 C sat o ,G =300
kg/m2s and 500 kg/m2
Fig. 4.31 Photos of intermittent saturated flow boiling flow of R-410A at selected time instants in a typical periodic cycle for q= 4
s. 73
2
kW/m at G =400 kg/m2s, ΔG/G 10%= , T =10 C , δ =2.0mm and tsat o p
Fig. 4.32 Photos of intermittent saturated flow boiling flow of R-410A at selected time instants in a typical periodic cycle for q= 4
= 60sec. 74
2
kW/m at G =400 kg/m2s, ΔG/G 20%= , T =10 C , δ =2.0mm and tsat o p
Fig. 4.33 Photos of intermittent saturated flow boiling flow of R-410A at selected time instants in a typical periodic cycle for q= 4
= 60sec. 75
2
kW/m at G =400 kg/m2s, ΔG/G 30%= , T =10 C , δ =2.0mm and tsat o p
Fig. 4.34 Photos of intermittent saturated flow boiling flow of R-410A at selected time instants in a typical periodic cycle for q= 4
= 60sec. 76
2
kW/m at G =400 kg/m2s, ΔG/G 20%= , T =10 C , δ =2.0mm and tsat o p
Fig. 4.35 Photos of intermittent saturated flow boiling flow of R-410A at selected time instants in a typical periodic cycle for q= 4
= 20sec. 77
2
kW/m at G =400 kg/m2s, ΔG/G 20%= , T =10 C , δ =2.0mm and tsat o p
Fig. 4.36 Photos of intermittent saturated flow boiling flow of R-410A at selected time instants in a typical periodic cycle for q= 3
= 120sec. 78
2
kg/m2s, ΔG/G 20%= , T =10 C , δ =2.0mm and tsat o p
Fig. 4.37 Photos of intermittent saturated flow boiling flow of R-410A at selected time instants in a typical periodic cycle for q= 5
= 60sec. 79
2
kW/m at G =500 kg/m2s, ΔG/G 20%= , T =10 C , δ =2.0mm and tsat o p
Fig. 4.38 Photos of intermittent saturated flow boiling flow of R-410A at selected time instants in a typical periodic cycle for q= 4
= 60sec. 80
2
kW/m at G =400 kg/m2s, ΔG/G 20%= , T =5 C , δ =2.0mm and tsat o p
Fig. 4.39 Photos of intermittent saturated flow boiling flow of R-410A at selected time instants in a typical periodic cycle for q= 4
= 60sec. 81
2
kW/m at G =400 kg/m2s, ΔG/G 20%= , T =15 C , δ =2.0mm and tsat o p
Fig. 4.40 Photos of time periodic saturated flow boiling flow of R-410A at selected time instants in a typical periodic cycle for q= 10
= 60sec. 82
2
kW/m at G =400 kg/m2s, ΔG/G 10%= ,T =10 C , δ =2.0mm and tsat o p
Fig. 4.41 Photos of time periodic saturated flow boiling flow of R-410A at selected time instants in a typical periodic cycle for q= 10
= 60sec. 83
2
kW/m at G =400 kg/m2s, ΔG/G 20%= ,T =10 C , δ =2.0mm and tsat o p
Fig. 4.42 Photos of time periodic saturated flow boiling flow of R-410A at selected time instants in a typical periodic cycle for q= 10
= 60sec. 84
2
kW/m at G =400 kg/m2s, ΔG/G 30%= ,T =10 C , δ =2.0mm and tsat o p
Fig. 4.43 Photos of time periodic saturated flow boiling flow of R-410A at selected time instants in a typical periodic cycle for q= 10
= 60sec. 85
2
kW/m at G =400 kg/m2s, ΔG/G 20%= ,T =10 C , δ =2.0mm and tsat o p
Fig. 4.44 Photos of time periodic saturated flow boiling flow of R-410A at selected time instants in a typical periodic cycle for q= 10
= 20sec. 86
2
kW/m at G =400 kg/m2s, ΔG/G 20%= ,T =10 C , δ =2.0mm and tsat o p
Fig. 4.45 Photos of time periodic saturated flow boiling flow of R-410A at selected time instants in a typical periodic cycle for q= 10
= 120sec. 87
2
kW/m at G =300 kg/m2s, ΔG/G 20%= ,T =10 C , δ =2.0mm and tsat o p
Fig. 4.46 Photos of time periodic saturated flow boiling flow of R-410A at selected time instants in a typical periodic cycle for q= 10
= 60sec. 88
2
kW/m at G =500 kg/m2s, ΔG/G 20%= ,T =10 C , δ =2.0mm and tsat o p
Fig. 4.47 Photos of time periodic saturated flow boiling flow of R-410A at selected
time instants in a typical periodic cycle for q= 10kW/m at G =500 2 kg/m2s, ΔG/G 20%= ,T =5 C , δ =2.0mm and tsat o p
Fig. 4.48 Photos of time periodic saturated flow boiling flow of R-410A at selected time instants in a typical periodic cycle for q= 10
= 60sec. 90
2
kW/m at G =500 kg/m2s, ΔG/G 20%= ,T =15 C , δ =2.0mm and tsat o p
Fig. 4.49 Time variations of mean bubble departure diameter in time periodic saturated flow boiling for q= 10
= 60sec. 91 2 kW/m at o sat T =10 C , G =400 kg/m2 ΔG/G 20%= s, δ =2.0mm (a) for various oscillation amplitudes of G at tp= 60sec, and (b)
for various periods of G oscillation at . 92
Fig. 4.50 Time variations of mean bubble departure diameter in time periodic
saturated flow boiling of R-410A for q= 10 kW/m2 at
o sat T =10 C , G =400 kg/m2 o sat T =10 C
s, δ =2.0mm (a) for various mean mass fluxes
at , and (b) for various mean saturated temperatures at
2
G=400kg/m s .. 93
Fig. 4.51 Time variations of mean bubble departure frequency in time periodic
saturated flow boiling of R-410A for q= 10 kW/m2 at
o sat
T =10 C , G =400 kg/m2
p
t =60sec
s, δ =2.0mm (a) for various oscillation
amplitudes of G at , and (b) for various periods of G oscillation
at ΔG/G 20%= . 94
Fig. 4.52 Time variations of mean bubble departure frequency in time periodic saturated flow boiling of R-410A for q= 10kW/m at 2 δ =2.0mm G =400
kg/m2s, ΔG/G 20%= , t =60sec , and(a) for various mean fluxes p
atT =10 C , and (b) for various mean saturated temperatures at sat o 2
G=400kg/m s. 95
Fig. 4.53 Time variations of mean active nucleation site density in time periodic saturated flow boiling of R-410A for q= 10kW/m at 2 δ =2.0mm G =400
kg/m2s, ΔG/G 20%= , t =60sec , and(a) for various oscillation p
amplitudes of G att =60sec , and (b) for various periods of G oscillation p
at ΔG/G 20%= . 96
Fig. 4.54 Time variations of mean active nucleation site density in time periodic saturated flow boiling of R-410A for q= 10kW/m at 2 δ =2.0mm G =400
kg/m2s, ΔG/G 20%= , t =60sec , and(a) for various mean fluxes p
atT =10 C , and (b) for various mean saturated temperatures at sat o 2
Fig. 4.55 Variations of bubble departure diameter (a), departure frequency (b), and active nucleation site density (c) with R-410A mass flux for time-periodic
saturated flow boiling of R-410A. 98
Fig. 5.1 Time-average flow boiling curves for R-410A for (a) various amplitudes of imposed heat flux oscillation at Tsat
2
G=400kg/m
=10℃,δ =2.0 mm, and
tp = 60 sec. and (b) various periods of heat flux oscillation at Tsat
2
G=400kg/m
= 10℃,
δ = 2.0 mm, and . 110
Fig. 5.2 Time-average flow boiling heat transfer coefficients for R-410A for (a) various amplitudes of imposed heat flux oscillation at Tsat
2
G=400kg/m
= 10℃, δ =2.0
mm, and tp = 60 sec. and (b) various periods of heat flux
oscillation at Tsat=10℃,δ =2.0 mm,G=400kg/m2and . 111
Fig. 5.3 Time variations of imposed heat flux and measured wall temperature in time periodic saturated flow boiling of R-410A at Tsat
Fig. 5.4 Time variations of imposed heat flux and measured wall temperature in time periodic saturated flow boiling of R-410A at T
= 10℃, δ = 2.0mm,
tp = 60 sec and G =400kg/m2s with ∆q/q ̅=10%. 112
sat = 10℃, δ = 2.0mm, tp =60 sec and G =400kg/m2
Fig. 5.5 Time variations of imposed heat flux and measured wall temperature in time periodic saturated flow boiling of R-410A at T
s with ∆q/q ̅=30%. 113
sat = 10℃, δ = 2.0mm,
tp = 60 sec and G = 400kg/m2s with . 114
Fig. 5.6 Time variations of imposed heat flux and measured wall temperature in time periodic saturated flow boiling of R-410A at Tsat = 10℃, δ = 2.0mm,
tp = 20 sec and G = 400kg/m2s with . 115
Fig. 5.7 Time variations of imposed heat flux and measured wall temperature in time periodic saturated flow boiling of R-410A at Tsat = 10℃, δ = 2.0mm,
tp = 120 sec and G = 400kg/m2s with . 116
Fig. 5.8 Time variations of imposed heat flux and measured wall temperature in time periodic saturated flow boiling of R-410A at Tsat = 10℃, δ = 2.0mm,
tp = 60 sec and G =300kg/m2s with . 117
Fig. 5.9 Time variations of imposed heat flux and heat transfer coefficient in time periodic saturated flow boiling of R-410A at Tsat = 10℃, δ = 2.0mm, tp =
60 sec and G = 500kg/m2s with . 118
Δq/q=30% Δq/q=30%
periodic saturated flow boiling of R-410A at Tsat = 15℃, δ = 2.0mm, tp =
60 sec and G = 400kg/m2s with . 119
Fig. 5.11 Time variations of imposed heat flux and heat transfer coefficient in time periodic saturated flow boiling of R-410A at Tsat = 5℃, δ = 2.0mm, tp =
60 sec and G = 400kg/m2s with . 120
Fig. 5.12 Time variations of imposed heat flux and heat transfer coefficient in time periodic saturated flow boiling of R-410A at Tsat = 10℃, δ = 2.0mm, tp =
60 sec and G =400kg/m2s with . 121
Fig. 5.13 Time variations of imposed heat flux and heat transfer coefficient in time periodic saturated flow boiling of R-410A at Tsat = 10℃, δ = 2.0mm, tp =
60 sec and G = 400kg/m2s with . 122
Fig. 5.14 Time variations of imposed heat flux and heat transfer coefficient in time periodic saturated flow boiling of R-410A at Tsat = 10℃, δ = 2.0mm, tp =
60 sec and G = 400kg/m2s with . 123
Fig. 5.15 Time variations of imposed heat flux and heat transfer coefficient in time periodic saturated flow boiling of R-410A at Tsat = 10℃, δ = 2.0mm, tp =
20 sec and G = 400kg/m2s with . 124
Fig. 5.16 Time variations of imposed heat flux and heat transfer coefficient in time periodic saturated flow boiling of R-410A at Tsat = 10℃, δ = 2.0mm, tp =
120 sec and G = 400kg/m2s with . 125
Fig. 5.17 Time variations of imposed heat flux and heat transfer coefficient in time periodic saturated flow boiling of R-410A at Tsat = 10℃, δ = 2.0mm, tp =
60 sec and G = 300kg/m2s with . 126
Fig. 5.18 Time variations of imposed heat flux and heat transfer coefficient in time periodic saturated flow boiling of R-410A at Tsat = 10℃, δ = 2.0mm, tp =
60 sec and G = 500kg/m2s with . 127
Fig. 5.19 Time variations of imposed heat flux and heat transfer coefficient in time periodic saturated flow boiling of R-410A at Tsat = 15℃, δ = 2.0mm, tp =
60 sec and G = 400kg/m2s with . 128
Fig. 5.20 Time variations of imposed heat flux and heat transfer coefficient in time periodic saturated flow boiling of R-410A at Tsat = 5℃, δ = 2.0mm, tp =
Fig. 5.21 Flow regime map for time periodic R-410A flow boiling regimes atδ =2mm and tp
Fig. 5.22 Time variations of imposed heat flux and wall temperature at z = 80 mm for t
= 60 sec for various saturated temperatures and mass
fluxes. . 130
p
Fig. 5.23 Time variations of imposed heat flux and wall temperature at z = 80 mm for t
= 2 sec. 131
p
Fig. 5.24 Time variations of imposed heat flux and wall temperature at z = 80 mm for t
= 120 sec. 132
p
Fig. 5.25 Time variations of imposed heat flux and wall temperature at z = 80 mm
for various . 134
= 600 sec. 133
Fig. 5.26 Photos of time periodic intermittent flow boiling of R-410A at selected time instants in a typical periodic cycle at Tsat =10℃, G = 400 kg/m2s,
δ =2.0mm and tp= 60 sec for = 4kW/m2, = 10%. 135
Fig. 5.27 Photos of time periodic intermittent flow boiling of R-410A at selected time instants in a typical periodic cycle at Tsat =10℃, G = 400 kg/m2s,
δ =2.0mm and tp= 60 sec for = 4kW/m2, = 30%. 136
Fig. 5.28 Photos of time periodic intermittent flow boiling of R-410A at selected time instants in a typical periodic cycle at Tsat =10℃, G = 400 kg/m2s,
δ =2.0mm and tp= 60 sec for = 4kW/m2, = 50% 137
Fig. 5.29 Photos of time periodic intermittent flow boiling of R-410A at selected time instants in a typical periodic cycle at Tsat =10℃, G = 400 kg/m2s,
δ =2.0mm and tp= 20 sec for = 4kW/m2, = 10%. 138
Fig. 5.30 Photos of time periodic intermittent flow boiling of R-410A at selected time instants in a typical periodic cycle at Tsat =10℃, G = 400 kg/m2s,
δ =2.0mm and tp= 120 sec for = 4kW/m2, = 30%. 139
Fig. 5.31 Photos of time periodic intermittent flow boiling of R-410A at selected time instants in a typical periodic cycle at Tsat =10℃, G = 400 kg/m2s,
δ =2.0mm and tp= 60 sec for = 3kW/m2, = 30%. 140
Fig. 5.32 Photos of time periodic intermittent flow boiling of R-410A at selected time instants in a typical periodic cycle at Tsat =10℃, G = 400 kg/m2s,
δ =2.0mm and t = 60 sec for = 5kW/m2, = 30%. 141
Fig. 5.33 Photos of time periodic intermittent flow boiling of R-410A at selected time instants in a typical periodic cycle at Tsat = 5℃, G = 400 kg/m2s,
δ =2.0mm and tp= 60 sec for = 5kW/m2, = 30%. 142
Fig. 5.34 Photos of time periodic intermittent flow boiling of R-410A at selected time instants in a typical periodic cycle at Tsat = 15℃, G = 400 kg/m2s,
δ =2.0mm and tp= 60 sec for = 4kW/m2, = 30%. 143
Fig. 5.35 Photos of time periodic saturated flow boiling of R-410A at selected time instants in a typical periodic cycle at Tsat =10℃, G = 400 kg/m2s,
δ =2.0mm and tp= 60 sec for = 10kW/m2, = 10% 144
Fig. 5.36 Photos of time periodic saturated flow boiling of R-410A at selected time instants in a typical periodic cycle at Tsat =10℃, G = 400 kg/m2s,
δ =2.0mm and tp= 60 sec for = 10kW/m2, = 30%. 145
Fig. 5.37 Photos of time periodic saturated flow boiling of R-410A at selected time instants in a typical periodic cycle at Tsat =10℃, G = 400 kg/m2s,
δ =2.0mm and tp= 60 sec for = 10kW/m2, = 30%. 146
Fig. 5.38 Photos of time periodic saturated flow boiling of R-410A at selected time instants in a typical periodic cycle at Tsat =10℃, G = 400 kg/m2s,
δ =2.0mm and tp= 20 sec for = 10kW/m2, = 30%. 147
Fig. 5.39 Photos of time periodic saturated flow boiling of R-410A at selected time instants in a typical periodic cycle at Tsat =10 ℃ , G = 400 kg/m2s,
δ =2.0mm and tp= 120 sec for = 10kW/m2, = 30%. 148
Fig. 5.40 Photos of time periodic saturated flow boiling of R-410A at selected time instants in a typical periodic cycle at Tsat =10℃, G = 300 kg/m2s,
δ =2.0mm and tp= 60sec for = 10kW/m2, = 30%. 149
Fig. 5.41 Photos of time periodic saturated flow boiling of R-410A at selected time instants in a typical periodic cycle at Tsat =10℃, G = 500 kg/m2s,
δ =2.0mm and tp= 60sec for = 10kW/m2, = 30%. 150
Fig. 5.42 Photos of time periodic saturated flow boiling of R-410A at selected time instants in a typical periodic cycle at Tsat = 5℃, G = 400 kg/m2s,
δ =2.0mm and tp= 60sec for = 10kW/m2, = 30%. 151
Fig. 5.43 Photos of time periodic saturated flow boiling of R-410A at selected time instants in a typical periodic cycle at Tsat =15℃, G = 400 kg/m2s,
Fig. 5.44 Time variations of mean bubble departure diameter in time periodic saturated flow boiling of R-410A for = 10kW/m2 at Tsat =10°C, G = 400 kg/m2s and δ =2.0mm for (a) various at tp = 60 sec and (b)
various tp at = 30%. 153
Fig. 5.45 Time variations of mean bubble departure diameter in time periodic saturated flow boiling of R-410A for = 10kW/m2 at = 30%, tp = 60 sec and δ =2.0mm for (a) various G at Tsat = 10°C and (b) various Tsat at G = 400 kg/m2
Fig. 5.46 Time variations of mean bubble departure frequency in time periodic saturated flow boiling of R-410A for
s. 154
= 10kW/m2 at Tsat =10°C, G = 400 kg/m2s and δ =2.0mm for (a) various at tp = 60 sec and (b)
various tp at = 30%. 155
Fig. 5.47 Time variations of mean bubble departure frequency in time periodic saturated flow boiling of R-410A for = 10kW/m2 at = 30%, tp = 60 sec and δ =2.0mm for (a) various G at Tsat = 10°C and (b) various Tsat at G = 400 kg/m2
Fig. 5.48 Time variations of mean active nucleation site density in time periodic saturated flow boiling of R-410A for
s. 156
= 10kW/m2 at Tsat =10°C, G = 400 kg/m2s and δ =2.0mm for (a) various at tp = 60 sec and (b)
various tp at = 30%. 157
Fig. 5.49 Time variations of mean bubble departure frequency in time periodic saturated flow boiling of R-410A for = 10kW/m2 at = 30%, tp = 60 sec and δ =2.0mm for (a) various G at Tsat = 10°C and (b) various Tsat at G = 400 kg/m2
Fig. 5.50 Variations of bubble departure diameter (a), departure frequency (b), and active nucleation site density (c) with heat flux for time-periodic saturated
flow boiling of R-410A. 159
s. 158
Fig. 6.1 Stable saturated flow boiling curves(a) and heat transfer coefficients for various refrigerant at Tsat = 10℃, G = 400 kg/m2
Fig. 6.2 Time variations of oscillating refrigerant mass flux and measured heated wall temperature in time periodic saturated flow boiling of R-410A (a) and R-134a (b) for various imposed heat fluxes at
s and δ= 2.0 mm. 163
o sat
Fig. 6.3 Time variations of flow boiling heat transfer coefficients in time periodic saturated flow boiling of R-410A (a) and R-134a (b) for various imposed heat fluxes at T =10 Csat o ,δ= 2.0mm, tp = 60 sec and G= 400 kg/m2
ΔG/G=20%
s
with . 165
Fig. 6.4 Variations of amplitudes of heated wall temperature with imposed heat
flux for various refrigerants R-410A & R-134a. 166
Fig. 6.5 Photos of time periodic saturated flow boiling of R-134a at selected time instants in a typical periodic cycle for q= 10kW/m2at G=400 kg/m2
ΔG/G 20%= , Tsat = 10℃, δ=2.0mm and tp s, Fig. 6.6 Photos of time periodic saturated flow boiling of R-410A at selected time
instants in a typical periodic cycle for q= 10
= 60sec. 167
2
kW/m at G=400 kg/m2
ΔG/G 20%= , Tsat = 10℃, δ=2.0mm and tp s, Fig. 6.7 Time variations of mean bubble departure diameter (a), bubble departure frequency(b), and active nucleation site density(c) in time periodic
saturated flow boiling of R-410A & R-134a. 169
= 60sec. 168
Fig. 6.8 Time variations of imposed heat flux and measured wall temperature in time periodic saturated flow boiling of R-410A (a) and R-134a (b) for various imposed heat fluxes at Tsat = 10℃, δ= 2.0mm, tp = 60 sec and
G =400kg/m2s with =30%. 171
Fig. 6.9 Time variations of imposed heat flux and heat transfer coefficients in time periodic saturated flow boiling of R-410A (a) and R-134a (b) at Tsat = 10
℃,δ= 2.0mm, tp = 60 sec and G =400kg/m2s with =30%. 172
Fig. 6.10 Photos of time periodic saturated flow boiling of R-134a at selected time instants in a typical periodic cycle for q= 10kW/m2at at Tsat = 10℃,δ=
2.0mm, tp = 60 sec and G =400kg/m2s with =30%. 173
Fig. 6.11 Photos of time periodic saturated flow boiling of R-410A at selected time instants in a typical periodic cycle for q= 10kW/m2at at Tsat = 10℃,δ=
2.0mm, tp = 60 sec and G =400kg/m2s with =30%. 174
Fig. 6.12 Time variations of mean bubble departure diameter (a), bubble departure frequency (b), and active nucleation site density(c) in time periodic
NOMENCLATURE
A heat transfer area of the annular duct, m
Bo Boiling number, 2 fg q Bo= G i⋅ , dimensionless cp D diameter of duct, m specific heat, J/kg℃ Dh hydraulic diameter, m, Dh = 4Ac/P = ( Do-Di d ) P
f bubble generation frequency
bubble departure diameter, m
ff F friction factor f Fr Froude number, fluid-dependent parameter 2 2 l h G Fr= ρ g D⋅ ⋅ , dimensionless
g acceleration due to gravity, m/s
G mass flux, kg/m
2
2
G
s
mean mass flux, kg/m2
h heat transfer coefficient, W/m
s 2
i
℃ fg
I measured current from DC power supply, A
enthalpy of vaporization, J/kg
1
Ja Jakob number based on ΔT , sat 1 l p sat
g fg C T Ja i ρ ρ ⋅ ⋅ ∆ = ⋅ , dimensionless 2
Ja Jakob number based on ΔT , sub 2 l p sub
g fg C T Ja i ρ ρ ⋅ ⋅ ∆ = ⋅ , dimensionless k thermal conductivity, W/m℃
L heating length of the annular duct, m
Nconf 0.5 conf h (σ/(gΔρ)) N = D
Confinement number, , dimensionless
Nu Nusselt number,Nu=hDh
k , dimensionless
P system pressure, kpa
Pr Prandtl number,
k C
Pr=µ⋅ p , dimensionless
q average imposed heat flux, W/m
Q heat transfer rate, W
2 Ra Rayleigh number, gβ∆TH3 αν Re h GD Re= l µ Rel l h GD (1 ) Re = l x µ −
Reynolds number of liquid in two-phase flow, , dimensionless
tp
T temperature,℃
period of mass flux oscillation, sec
Tsat
V measured voltage from DC power supply, V
saturated temperature of the refrigerant, ℃
Wel 2 l l G D We ρ σ ⋅ = ⋅
Weber number based on liquid, , dimensionless
Xtt
x vapor quality
Martnelli parameter
z coordinate (downstream coordinate for annular duct flow), mm
Greek Symbols
∆G amplitude of mass flux oscillation, kg/m2
∆T temperature difference, ℃
s
δ gap size, mm
μ viscosity, N⋅s/m2
∆ρ density difference, ∆ =ρ ρ - ρ ,l g kg/m
σ surface tension, N/m
3
ε mean absolute error,
1
1 predicted value-experimental value
experimental value
N
N
ε =
∑
, %λ fraction of data predicted to within ±30%, %
Subscripts
ave average
exp experimental value
fg difference between liquid phase and vapor phase
g vapor
i, o inside and outside diameter of the smooth pipe
l all-liquid nonboiling heat transfer
n net power input to the refrigerant
r refrigerant side
s heater surface
sat saturated flow boiling
sub subcooled flow boiling
tp two-phase
CHAPTER 1
INTRODUCTION
1.1 Motivation
It is well known that refrigerant R-22 is one of the most widely used working fluids in air-conditioning systems. However, the use of the chlorofluorocarbons refrigerants (CFCS) such as CFC-11, CFC-12, CFC-113, CFC-114, CFC-115 and the hydrochlorofluorocarbons refrigerants (HCFCs) such as R-22 have resulted in the destruction of the ozone layer in the arctic area and the global warming. Thus the Montreal Protocol signed in 1987 only allowed the use of the CFCs up to 1996 and the HCFCs are going to be phased out in 2020. Therefore, the substitution of CFCs and HCFCs becomes urgent. The hydrofluorocarbons refrigerants (HFCs) such as R-134a, R-407C, R-410A, R-410b and R-507 have been considered to be suitable and some are currently in use.
Refrigerant R-410A has zero ozone depletion potential and is recognized as the main replacement to R-22. It is a high pressure and near-azeotropic binary mixture refrigerant consisting of 50 wt% of R-32 and 50 wt% of R-125. This near-azeotropic mixture has a very small temperature glide (0.1 o
In the past, the use of variable frequency compressors in air-conditioning and refrigeration systems to meet the changing heat load is found to significantly improve their energy efficiencies. It is important to note that the two-phase flow in these systems is subject to time varying refrigerant flow rate and heat flux. The use of compact heat exchangers to promote the thermal performance of these systems is beneficial because of their low thermal resistance, very high ratio of surface area to volume, and lower total mass of working fluids.
C) and behaves like a single component refrigerant. The operating conditions of refrigerants R-410A, R-407C and R-134a are compared in Table 1.1.
Additionally, it is also well known that the IC junction temperature must be kept under 85℃ to avoid being damaged and to maintain its normal operation. The use of the direct liquid cooling accompanying with phase change can greatly increase the heat
removal rate, but the power dissipation in IC chips are often time dependent in practical operation. Therefore, the transient oscillatory flow boiling resulting from varying heat load needs to be explored.
In view of the possible enhancement of heat transfer in small channels, we require to develop smaller and more compact evaporators and condensers. Despite the great effort has been paid to the investigation of single- and two-phase flow and heat transfer in small channels from the heat transfer research community, the detailed heat transfer mechanisms in the small-channel flow boiling remain controversial. A detailed understanding of the phase-change processes in-small channel flow subject to time varying coolant flow rate or imposed heat flux is essential in thermal design for electronics cooling and air-conditioning and refrigeration systems. Although considerable research has been carried out in the past for the two-phase flow and heat transfer under the condition of fixed flow rate and imposed heat flux, the corresponding research for the transient oscillatory flow rate or imposed heat flux remains largely unexplored. In the present study an initial attempt is made to unravel how the characteristics of flow boiling and associated heat transfer and bubble motion in a narrow annular channel are affected by given time periodic refrigerant flow rate or imposed heat flux oscillation.
1.2 Literature Review
In sizing the small channels, Kandlikar and Grande [1] proposed that Dh >3mm for the conventional channels, 200μm< Dh <3mm for the mini-channels, 10μm < Dh <200μm for the micro-channels, 0.1μm < Dh <10μm for the transitional channels, 1μm < Dh <10μm for the transitional micro-channels, 0.1μm < Dh <1μm for the transitional nano-channels, and Dh
≤
0.1μm for the molecular nano-channels. On the other hand, Kew and Cornwell [2] introduced a dimensionless group named as the Confinement number,0.5 conf h (σ/(gΔρ)) N = D ,
which represents the importance of the restriction of the flow by the small size of the channel. They showed that when Nconf
1.2.1 Stable Flow Boiling Heat Transfer
>0.5, the effects of the channel size become very important.
well known that boiling heat transfer for flow inside channels can be regarded as a combination of convective heat transfer from the wall to the liquid and nucleate boiling at the wall. In convection-dominated flow boiling, the heat transfer coefficient is independent of the wall heat flux but increases with increasing mass flux and vapor quality. On the contrary, in nucleation-dominated flow boiling the boiling heat transfer coefficient is independent of the mass flux and vapor quality. However, it increases with the heat flux and is sensitive to the refrigerant saturation pressure level.
Hsieh et al. [3] examined the stable flow boiling heat transfer and associated bubble characteristics of R-410A in a horizontal annular duct. They showed that raising the imposed heat flux can increase the boiling heat transfer coefficient. Wang et al. [4] compared the two-phase heat transfer characteristics of refrigerants R-22 and R-410A. Their results indicate that the evaporative heat transfer coefficients for R-410A are about 10-20% higher than that for R-22. Ebisu and Torikoshi [5] examined the evaporative heat transfer for R-410A, R-407C and R-22. They showed that evaporative heat transfer coefficient of R-410A was about 20% higher than that of R-22 up to the vapor quality of 0.4, while the heat transfer coefficients of R-410A and R-22 became almost the same at the quality of 0.6.
Fujita et al. [6] studied flow boiling heat transfer and pressure drop for refrigerant R-123 in a horizontal small-diameter tube (Dh=1.12 mm). They showed that the flow boiling was dominated by bubble nucleation in the small tube rather than the forced convective evaporation because of very weak influences of the mass velocity and vapor quality. Hsieh et al. [7] investigate the effect of the channel size on R-407C saturated flow boiling heat transfer in a narrow annular duct. The gap of the duct is fixed at 1.0 mm and 2.0 mm. They reported that the saturated flow boiling heat transfer coefficient increased with a decrease in the duct gap. Besides, Lie & Lin [8,9] examined the flow boiling heat transfer and associated bubble characteristics of R-134a in the same duct (Dh = 2&4 mm). The effects of the refrigerant mass flux and saturated temperature on the boiling heat transfer coefficient were found to be small.
Flow boiling of refrigerants R-11 and R-123 in a small horizontal copper tube (Dh=1.95 mm) investigated by Bao et al. [10] showed that the heat transfer coefficients were independent of the refrigerant mass flux and vapor quality, but were a strong function of the heat flux. Nucleate boiling was noted to be the dominant mechanism over a wide
range of flow conditions. A similar study from Tran et al. [11] examined flow boiling of refrigerant R-12 in small circular and rectangular channels (Dh=2.46, 2.4 mm). Two distinct two-phase flow regions were noted, convective boiling dominant region at lower wall superheat (< 2.75K) and nucleate boiling dominant region at higher wall superheat (> 2.75K). Kandlikar and Steinke [12] noted that for a high liquid-vapor density ratio (ρl/ρg), the convective effects dominated as the vapor quality increased. This led to an increasing trend in the boiling heat transfer coefficient at increasing vapor quality. A high Boiling number results in a higher nucleate boiling contribution, which tends to decrease as the vapor quality increases. This leads to a decreasing trend in heat transfer coefficient with increasing vapor quality. Oh et al. [13] examined flow boiling heat transfer characteristics of R-134a in a capillary tube heat exchanger (Dh=2, 1, 0.75 mm). Their data showed that the heat transfer in the forced convection dominated region was more influenced by the mass flux than by the Boiling number and the heat transfer coefficient was controlled by the Reynolds number.
Yin et al. [14] investigated the subcooled flow boiling heat transfer for refrigerant R-134a flowing in a horizontal annular duct. The gap of duct is 5.16 mm. They found that boiling heat transfer is insignificantly affected by the mass flux, imposed heat flux and refrigerant saturation temperature. But a decrease in the inlet subcooling results in much better heat transfer. Chen et al. [15] investigate how the channel size affects the subcooled flow boiling heat transfer of refrigerant R-407C in a horizontal narrow annular duct(Dh = 1.0 and 2.0 mm). They indicated that the temperature overshoot at ONB is relatively significant. Besides, the subcooled flow boiling heat transfer coefficient increases with a reduction in the duct gap, but decreases with an increase in the inlet liquid subcooling.
1.2.2 Time Dependent Flow Boiling Heat Transfer
In examining two-phase flow instabilities in a circular channel (Dh=9.525mm), Comakli et al [16] found that the periods and amplitudes of the pressure drop and density wave type oscillations decreased with decreasing mass flow rate and increased with decreasing inlet temperature. Recently, some detailed characteristics associated with these intrinsic instabilities were investigated through experimental measurement and theoretical modeling. An experimental investigation of thermal instabilities in forced convection boiling of R-11 in a vertical annular channel (Dh =17 mm) was conducted by Kakac et al.
assumption were used to predict the condition leading to the thermal oscillation. And their predicted periods and amplitudes of the oscillations were in a good agreement with their measured data.In a continuing study for R-11 in a horizontal tube of 106 cm long, Ding et al. [18] examined the dependence of the oscillation amplitude and period on the system parameters and located the boundaries of various types of oscillations on the steady-state pressure-drop versus mass flux characteristic curves.
Wang et al. [19] noted that the boiling onset in a upward flow of subcooled water in a vertical tube of 7.8-m long connected with a liquid surge tank could cause substantial flow pressure and density-wave oscillations. These boiling onset oscillations were attributed to a sudden increase of pressure-drop across the channel and a large fluctuation in the water flow rate at the onset of nucleate boiling. This in turn results from the feedback of the pressure-drop and flow rate by the system, causing the location of the boiling onset to move in and out of the channel. Experimental investigation on the critical heat flux was conducted under the forced flow oscillation condition by Ozawa et al. [20]. They found that the reduction of the CHF from the steady state value was larger for increases in the amplitude and period of the flow oscillation.
Kotaoka et al. [21] investigated transient flow boiling of water over a platinum wire subject to an exponentially increasing heat input. The wire diameter and length respectively vary from 0.8 to 1.5 mm and from 3.93 to 10.4 cm. Two types of transient boiling were observed. In A-type (heating period is 20 ms, 50 ms or 10 s) boiling, the transient maximum critical heat flux increases with decreasing heating period at constant flow velocity. Whereas in the B-type (heating period is 5ms, 10ms, or 14ms) boiling, the transient maximum critical heat flux decreases first with the period and then increases. Two-phase flow and heat transfer in a small tube of 1 mm in the internal diameter using R-141b as the working fluid were studied by Lin et al. [22]. At a low heat flux input, a relatively constant wall temperature was obtained. Besides, forced convection evaporation occurs towards the outlet end of the tube and the fluctuations in the wall temperature are small. With a high heat flux input, however, significant fluctuation in the wall temperature can appear. This is caused by a combination of time varying heat transfer coefficient and time varying local pressure and fluid saturation temperature.
The dynamic behavior for a horizontal boiling channel connected with a surge tank for liquid supply has also received some attention. Mawasha and Gross [23] used a
constitutive model containing a cubic nonlinearity combined with a homogeneous two-phase flow model to simulate the pressure-drop oscillation. Their prediction is matched with the measured data. Later, the channel wall heat capacity effects were included [24] to allow the wall temperature and heat transfer coefficient to vary with time.
1.2.3 Flow Patterns and Bubble Characteristics
To elucidate the flow boiling heat transfer mechanisms in small channels, we require to delineate the prevailing flow regimes. Cornwell and Kew [25] examined various flow regimes for boiling of refrigerant R-113 in a vertical rectangular multi-channel with Dh
However, bubble characteristics such as bubble departure frequency, growth, sliding and departure size are known to play an important role in flow boiling heat transfer. Visualization of subcooled flow boiling of upward water flow in a vertical annular channel (D
= 1.03 and 1.64 mm. Based on visualization of the flow and measurement of the heat transfer, three flow regimes have been suggested, namely, the isolated bubble, confined bubble and annular-slug bubble flows. In the isolated bubble regime, heat transfer coefficient depends on the heat flux and hydraulic diameter. In the confined bubble regime, heat transfer coefficient depends on the heat flux, mass flux, vapor quality and hydraulic diameter. While in the annular-slug bubble regime, heat transfer coefficient depends on the mass flux, vapor quality and hydraulic diameter.
h=19 mm) by Situ et al. [26] suggested that generally the bubble departure frequency increased as the heat flux increased. The averaged bubble growth rate drops sharply after lift-off. An experimental analysis was carried out by Thorncroft et al. [27] to investigate the vapor bubble growth and departure in vertical upflow and downflow boiling of FC-87. They found that the bubble growth rate and bubble departure diameter increased with the Jacob number(increasing △Tsat
Kandlikar [28] examined the subcooled flow boiling of water in a rectangular horizontal channel. They noted that the bubble growth was slow at high subcooling and the departure diameter decreased as the flow rate increased. The influence of the heat flux on ) and decreased at increasing mass flux in both the upflow and downflow. Hsieh et al. [3] examined saturated flow boiling heat transfer and associated bubble characteristics of R-410A in a horizontal annular duct. They concluded that a higher refrigerant mass flux results in a smaller bubble departing size and a higher bubble departure frequency.
the waiting time between two cycles is much weaker. Chang et al. [29] studied the near-wall bubble behavior for water in a vertical rectangular channel with one-side heated (Dh=4.44 mm). They showed that the size of coalesced bubbles decreased for an increase in the mass flux and the mass flux only exhibited a strong effect on the bubble size. Del Balle and Kenning [30] examined the subcooled flow boiling for water in a rectangular vertical channel and found that the maximum bubble diameter was independent of the heat flux. Yin et al. [14] examined the bubble characteristics associated with subcooled flow boiling of refrigerant R-134a in a horizontal annular duct (Dh=10.31 mm). They noted that the bubble departure frequency was suppressed by raising the mass flux and subcooling of R-134a, and only the subcooling showed a strong effect on the bubble size. The study of
water boiling in a horizontal rectangular channel with one side heated (Dh=40 mm)
conducted by Maurus et al. [31] found that the waiting time between two bubble cycles decreased significantly at increasing mass flux. An experimental study on bubble rise path after the departure from a nucleation site for water in a vertical upward tube (Dh
1.2.4 Correlation Equations for Flow Boiling Heat Transfer
=20 mm) by Okawa et al. [32] suggested that the inertia force significantly influenced the onset of bubble detachment and the shear force induced a lift force to detach the bubble from the wall.
An early general correlation model for the flow boiling in channels was proposed by Chen [33]. He divided the boiling heat transfer coefficient into two parts: a microconvective (nucleate boiling) contribution estimated by the pool boiling correlations and a macroconvective (non-boiling forced convection) contribution estimated by the single-phase correlation such as the Dittus-Boelter equation [34]. In order to account for the diminished contribution of nucleate boiling, as the convective boiling effects increased at a higher vapor quality he introduced the enhanced factor E and suppression factor S to respectively accommodate the forced convective and nucleate boiling contributions. Gungor and Winterton [35] modified the Chen’s correlation and proposed the correlations for the enhanced and suppression factors. A new correlation from Liu and Winterton [36] introduced an asymptotic function to predict the heat transfer coefficient for vertical and horizontal flows in tubes and annuli. Zhang et al. [37] modified the Chen’s correlation to predict the heat transfer in mini channels. Besides, Tran et al. [11] modified the heat transfer correlation of Lazarek and Black [38] with the Reynolds number of the flow
replaced by the Weber number to eliminate viscous effects in favor of the surface tension. Similar correlations were proposed by Fujita et al. [6].
Kandlikar [39] proposed a general correlation for saturated flow boiling heat transfer inside horizontal and vertical tubes. The correlation was based on a model utilizing the contributions due to nucleate boiling and convective mechanisms. In a following study [40,41], he developed correlations to predict transition, laminar and deep laminar flows in minichannels and microchannels. A new correlation for boiling heat transfer in small diameter channels was proposed by Kew and Cornwell [2]. The correlation was divided by three flow regimes based on the values of the Confinement number. Some empirical correlation equations proposed in the literature for flow boiling heat transfer coefficients in the small channels were summarized in Table 1.2.
1.3 Objective of the Present Study
The above literature review clearly indicates that the dynamic instabilities in the flow boiling of refrigerant in a channel subject to constant inlet flow rate and uniform heating has received considerable attention. However, the unstable characteristics of flow boiling heat transfer and associated bubble behavior in a channel subject to imposed time varying refrigerant flow rate or time varying heat flux remain largely unexplored. In this study, an experimental study will be carried out to investigate how an imposed time periodic inlet flow rate oscillation affects the time dependent saturated R-410A flow boiling heat transfer and associated bubble characteristics in a horizontal narrow annular duct with a constant imposed heat flux. On the other hand, another experimental study will be conducted to examine how a time periodic imposed heat flux oscillation affects the time dependent saturated R-410A flow boiling heat transfer and associated bubble characteristics in the same horizontal narrow annular duct with a constant inlet flow rate. Effects of the period and amplitude of the imposed flow rate or heat flux oscillation on the boiling characteristics will be examined in detail for various average refrigerant mass fluxes, imposed heat fluxes, and refrigerant saturated temperatures of R-410A.
Table 1.1 Comparison of some properties of three HFCs refrigerants for air-conditioning and refrigeration applications
Refrigerant R-410A R-134a R-407C
Component HFC-32/125 HFC-134a HFC-32/125/134a
Wt % 50/50% 100 % 23/25/52%
Comparison with R-22
1. near-azeotropic refrigerant. 2. the working pressure is five times
than R-22.
3. the frication pressure drop is smaller.
1. the lower working pressure. 2. the frication pressure drop is
larger in the same capability of freezing.
1. zeotropic refrigerant, and the components charge easy.
2. the working pressure is same with R-22.
The energy efficiency
ratio relative to R-22 94~100 72~90 90~97
Molecule quality 72.6 102.3 85.62
Remark
1. the design of system must to consider the strong and optimum elements.
1. the volume of operating system becomes larger.
2. the air-out volume of compress is larger.
1. the solutions of variation of R-407C components. Green-house effect (100 years) 1725 1300 1526 Toxicity limit (kg/m3) 0.44 0.25 0.31 Boiling point (℃) -52.7 R32 (-51.8℃) / R125 (-48.5℃) -26.2 -43.6 R32 (-51.8℃) / R125 (-48.5℃) / R134a (-26.2℃) Temperature glides <1 ℉ ─ 10 ℉ 9
Table 1.2 Heat transfer correlations for flow boiling in small channels
Reference Fluid Heat Transfer Coefficient Correlations Application Range
Lazarek and Black [38] R-113 0.857 0.714
30 Re ( / ) tp l l h = Bo k D 2 2 4 4 : 3.1 :125 750 :14 380 Re : 860 5500 : 2.3 10 76 10 :1.3 4.1 D mm G kg m s q kW m Bo − − P bar − − − × − × − Y. Fujita et al. [6] R-123 0.143 0.714 0.884 tp h = G q 2 2 4 4 :1.12 : 50 400 : 5 20 Re :135 1070 :1.1 1.2 : 0.2 0.9 : 3 10 8.9 10 D mm G kg m s q kW m P bar x Bo − − − − − − − − × − ×
Z.Y. Bao et al. [10] R-11,
R-123 0.86 0.75 0.41 1 3000 1.12( /(1 )) ( ) tp l l g h h = + Bo + x −x ρ ρ 2 2 :1.95 : 50 1800 : 50 200 Re : 860 5500 : 2 5 : 0.3 0.9 : 5 15o sat D mm G kg m s q kW m P bar x T C − − − − − − ∆ − T.N. Tran et al. [11] R-12, R113
(
)(
)
0.4 0.3 5 2 8.4 10 l for T>2.75 tp l g h Bo We ρ C ρ − − ° = × ∆ 2 2 4 4 : 2.46 , 2.92 ; 2.4 : 44 832 : 7.5 129 : 0.045 0.2 : 2 10 23 10 : 2.8 18.2 h r o sat D mm mm D mm G kg m s q kW m P Bo T C − − = − − − × − × ∆ − 10Table 1.2 Continued
Reference Fluid Heat Transfer Coefficient Correlations Application Range
Z. Liu and R.H.S. Winterton [36] 2 2 2 0.8 0.4 0.12 0.55 0.5 0.67 0.35 0.16 0.1 1 ( ) ( ) 0.023( ) Re Pr 55 ( ln ) (1 Pr ( 1)) (1 0.55 Re ) tp l pool l l l l pool r r l l g l h Fh Sh h k D h P P M q F x S F ρ ρ − − − = + = = − = + − = + 2 2 4 : 2.95 32 :12.4 8179.3 : 0.35 2620 Re : 568.9 87500 P : 0.0023 0.895 : 0 0.948 : 2.66 10 2240 Pr : 0.83 9.1 r l D mm G kg m s q kW m x Fr − − − − − − − × − − W. Zhang et al. [37] R-11, R-123
(
6 1.17)
0.79 0.45 0.49 0.24 0.75 0.5 0.29 0.24 0.24 0.5 2 1 1 2.53 10 Re 0.00122 ( ) 1 0.64 1 ,1 tp pool l l l pl lpool w sat sat
l fg g tt tt h S h F h S k c h T T P i C F Max X X ρ σ µ ρ − = ⋅ + ⋅ = + × = − ∆ = + + 2 2 0.78 6 23.4 2939 2.95 2511 P=0.101-1.21MPa h D mm G kg m s q kW m = − = − = − 1 1
Table 1.2 Continued
Reference Fluid Heat Transfer Coefficient Correlations Application Range
S.G. Kandlikar [40] 0.1 0.16 0.64 0.7 0.8 0.45 0.72 0. [ ] maximun of [ ]
Nucleate boiling dominant region
[ ] 0.6683( ) (1 ) ( )
1058 (1 )
Convection boiling dominant region
[ ] 1.1360( ) (1 ) tp l NBD tp l tp l CBD tp l NBD l g l f tp l CBD l g h h h h h h h h x x f Fr Bo F x h h x x ρ ρ ρ ρ = = − + − = − 08 2 0.7 0.8 0.3 ( ) 667.2 (1 ) (25 ) 0.04 . ( ) 1 0.04 . & . l f l l l l f Fr Bo F x
Fr for Fr forH tube
f Fr
for Fr forH V tube
+ − < − = > − 2 2 4 4 : 8.1 20 :123 1523 : 0.8 82.1 :1.6 14.8 : 0 0.868 : 0.035 10 24.02 10 D mm G kg m s q kW m P bar x Bo − − − − − − − × − × 12