The Seventeenth KKCNN Symposium on Civil Engineering December 13-15, 2004, Thailand
A hyperelastic model for the elastic behaviour of sandstone
Li-Sheng Tsai, Fu-Shu Jeng, Ming-Lang Lin and Meng-Chia Weng Department of Civil Engineering, National Taiwan University, Taipei, Taiwan
Sinotech Engineering Consultants, Inc., Taipei, Taiwan
[email protected] [email protected] [email protected] [email protected]
Abstract
In order to investigate the mechanical behaviour of porous sandstones, a set of hydrostatic and triaxial tests, include creep test, has been performed through pure shear stress path
loading, which is also termed as ‘triaxial compression’ test by Chen and Saleeb (1982). The
experimental results obtained show significant non-linear elastic behavior in this rock. To
interpret the data it is essential to separate the elastic and inelastic parts of the total strain. We observed that the elastic volumetric strain of sandstone tend to dilate elastically significantly upon shearing. A hyperelastic model (or Green elastic model) constitutive equation is suggested to describe the non-linear behavior of sandstone. Prediction of the model compares favorably with the experimental.
Introduction
In civil engineering, the description of the complex behaviour of soft porous rock is very important for the understanding of various geomechanical problems, such as slope stability and underground excavation. As regards the modelling of the behaviour of geomaterials, various kinds of constitutive equations have been developed over the last few decades following different assumptions and principles. The general approach to modelling the mechanical behaviour of materials starts with the assumption that the deformation of a stressed body is the sum of elastic and non-elastic terms. Linearity often considered the main signature of elastic behaviour is in fact not required. On the contrary, the presence of pores
and grain contacts in elastic porous materials is known to introduce non-linearity (Bernabe et
al., 1994; Jeng et al., 2001). The initial portion of a rock stress/strain curve is often non-linear with an upward curvature thought to be caused by crack closure. Usually, a linear segment along which the mechanical behaviour is traditionally considered elastic follows this non-linear portion. However, apparent non-linearity may not be sure evidence of elastic behaviour. In this work, we first present the laboratory results of standard tests and creep tests performed on Mushan sandstone during triaxial (Pure shear stress path) test. We then formulate a non-liner elasticity model using hyperelastic model to the features of our rock. Finally a comparison of the predicted model response with the experimental data is presented.
Samples Description
In this research, Mushan sandstone, the stratum in which squeezing has occurred during
tunnel construction (Jeng et al., 1996), is adopted as the specimen. The specimen size is 5.5
cm in diameter and 12.9 cm in height. The specimens were firstly dried at 105℃ temperature. The longitudinal and transverse deformation were separately measured by a full Wheatstone
bridge consisted of four strain gages, which are capable of measuring strains up to 2 % with an accuracy of ±0.85 (mm/m)/℃.
The physical and mechanical properties are measured according to the methods suggested by
ISRM (1981). The results show that this sandstone has a mean dry density of 2.3 g/cm3, a mean porosity 14 %, mean saturated water content of 4.91 % and a mean uniaxial compressive strength of 32 MPa. The average ultrasonic elastic constants are around 11.7 GPa and 0.096 for Young’s modulus and Poisson’s ratio.
Experimental setting
In order to isolate the influence of volumetric loading from the shear loading, a pure shear stress path loading which is also termed as ‘triaxial compression’ (TC) test by Chen and
Saleed (1982), was adopted (Bernabe et al., 1994; Jeng et al., 2001) as shown schematically
inFigure 1. The measure of shear loading is expressed in terms of (J2) 0.5, where J2=1/2(SijSji)
and Sij= deviatoric stress tensor.
The creep study was performed in TC stress condition following a step-wise loading procedure. The step-wise loading procedure permitted the evaluation of creep behaviour in reasonable times, in terms of laboratory requirements. This procedure is particularly suitable using Cristescu’s theory. In a stress-strain plane, the geometrical locus of points where
stabilization by creep has stopped is called the stabilization boundary (Cristescu, 1989).Thus,
in triaxial configuration the creep time (tc) was performed at various levels of the
corresponding short-term rock strength ( λ≡ (J2)0.5/((J2)0.5)f) following the protocol: λ
=0.2~0.6, tc=6 hours; λ=0.6~0.8, tc=12 hours andλ=0.8~0.95, tc=24 hours. However, if the
rock considered exhibits significant rheological properties, then before passing from loading unloading the specimen must be kept under constant stress for a sufficiently long time interval, during which by creep the rock approaches a stable state (or a state corresponding to
very small rates of deformation) (Cristescu, 1993). Therefore, after creep steps, cycles of
unloading/reloading were conducted in several tests for obtaining the elastic deformation, which will be used to decompose the total deformation into elastic and non-elastic
components. A summary of the test conditions is given in Table 1. The loading rate is
2.7MPa/min.
Experimental Results Typical creep behavior
Figure 2 shows the relative stress-strain curves obtained in the second stage of a triaxial creep
test for Mu-shan sandstone. The geometrical locus in the (εv,(J2)0.5) plane of the point where
the deformation by creep has stopped is call the stabilization boundary, and is shown in
Figure 2 as an interrupted line. Figure 3 shows the typical volumetric creep curve, obtained with various constant loading stresses. The volume first decreases (compressibility) and
afterwards under higher constant loading stresses, it increases during creep (dilatancy).
Volumetric strain deformation induced by hydrostatic
Figure 4 shows a typical hydrostatic stress vs. volumetric strain relationship, in which cycles of loading and unloading have been applied to identify the elastic and inelastic components of the total deformation. If all the cycles of unloading and reloading curve were put together, as
shown in Figure 5, the elastic component of deformation can then be determined as indicated
by the thick, solid curve based on regression analysis.
The viscoplastic component of deformation can then be determined by subtracting the elastic component from the total deformation. Both the elastic and the viscoplastic components of
Volumetric strain deformation induce by shear stress
Volumetric deformation induced by shear stress does exist as depicted by Figure 7, in which
increasing of shear stress first compress the sandstone followed by dilation of sandstone.
Remarkably, Figure 7 depicts that a pure shear loading would lead to an elastic dilation and a
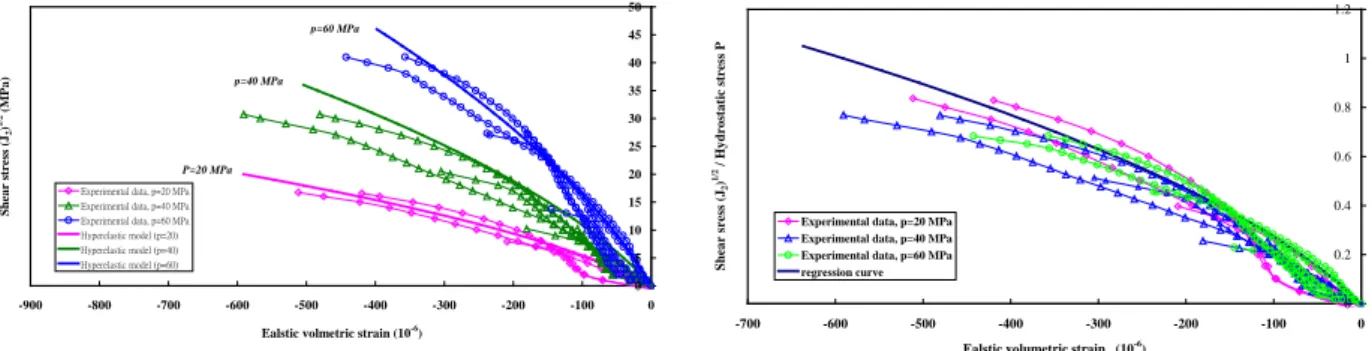
viscoplastic compression at earlier stages of loading. Again, all the cycles of
unloading-reloading curves, including p=20, 40 and 60 MPa (p=1/3(σ1+σ2+σ3)), are put together as
shown in Figure 8. A normalized shear stress measure δ ( δ =(J2)0.5/p) is used to
normalization as shown in Figure 9. Since the last cycle where significant deterioration
appears (dilation). Therefore, the last cycle of loading is excluded in the regression analysis
and a hypothetical elastic curve is obtained as shown by the thick solid curve inFigure 9.
As a result, the elastic and the viscoplastic components are shown in Figure 10. It reveals
that the sandstone tends to dilate elastically upon shearing.
Shear strain deformation induce by shear stress
The typical relation of shear strain versus shear stress is shown in Figure 11, in which the
load-deformation curve approximates toward a horizontal asymptote (i.e., failure state) when shear stress approaches the strength of sandstone. To obtain a representative elastic shear modulus, the later cycles of unloading-reloading curves are therefore excluded in regression
analysis and a hypothetical elastic deformation curve is obtained as shown in Figure 12.
Subtracting the elastic component from the total deformation, the non-elastic (viscoplastic)
component can be obtained as shown in Figure 13. It indicates that, when the shear stress
approaches the shear strength of sandstone, significant viscoplastic shear strain occurs and it eventually dominates the total deformation.
Hyperelastic Model
In view of the non-linear elastic behavior shown in Figure 5 and 8,a hyperelastic model (or
Green elastic model) is thus adopted. On the basis of such a model, the strain tensor can be
determined from an energy density functionΩ and the stress tensor σij by the following
expression: ije ij ε σ ∂Ω = ∂ (1) where e ij
ε is the elastic strain tensor and Ω the energy density function. From the
experimental results, Ω is selected to be:
Ω =b I1 12 / 3+b I J2 1−1 2+b J3 2 (2)
where b1, b2 and b3 are material constants.
Substituting Eq. (2) into Eq. (1), the elastic strain tensor e
ij
ε has the following form:
2 1 11/ 2 2 12 2 ( 2 11 3) 3 e ij ij ij ij b I b I J b I b S ε δ σ − − ∂Ω = − + + ∂ (3)
According to Eq. (3), the volumetric strain can be obtained as: 11 22 33 2 2 1/ 2 1 1 2 1 9 3 2 e e e e v J b I b I ε =ε +ε +ε = − (4)
Eq. (4) indicates that both hydrostatic stress and shear stress will induce volumetric strain.
Therefore, the elastic volumetric strain can be separated into two components, ,
e v p ε and , e v s ε , as the following expressions:
1/ 2 , 1 1 9 2 e v p b I ε = (5)
2 2 , 2 1 3 e v s J b I ε = − (6)
The shear strain (γe =2 J2' ) can also be determined based on Eq. (3) as:
γe = 2
(
b I2 1−1+b3)
J2 (7)Accordingly, the material constants b1, b2 and b3 can be determined by a curve fitting derived
from the experimental curves shown in Figure 5, 9and 12. For the Mushan sandstone tested,
b1, b2 and b3 are found to be 168.26μ‧(MPa)-1/2, 2456.4 μ, 66.19 (MPa)-1 , respectively.
The strains from model prediction,εv pe, , εv pe, and γe are compared to the experimental results
as shown in Figure 5, 8 and 12. In general, the proposed model is capable of predicting the
nonlinear elastic behavior, including shear dilation of sandstone and its prediction has a
reasonably good agreement with the experimental curves as well.
Conclusion
Sandstone sampled from Mushan Formation, a typical stratum encountering squeezing, is tested in this research. Several characteristics of experimental results are summarized below: (a) Figure 14 indicates that the threshold condition, including total, plastic and viscoplastic shear dilation, at which is initiated. It shows that the onset threshold condition of plastic and viscoplastic dilation is very similar. From experimental result it follows that the thresholds of
dilatancy, include point A, B and C in Figure 14, increases with hydrostatic stress as shown
in Figure 15.
(b) The experimental results obtained show significant non-linear elastic behavior in this rock. It reveals that the elastic volumetric strain of sandstone tend to dilate elastically significantly upon shearing.
(c)The elastic behaviour can be reasonably well described by a hyperelastic model base on a
proposed energy density function. References
ISRM (1981), In: Brown, E.T. (Ed.), Rock Characterization Testing & Monitoring – ISRM Suggested Methods, Pergamon, New York.
Chen, W.F. & Saleeb, A.F. (1982), Constitutive Equations for Engineering Materials, Vol. I: Elasticity and Modeling, John Wiley & Sons, New York.
Cristescu, N.D. (1989), Rock Rheology. Kluwer Academic, Dordrecht.
Cristescu, N.D. (1993), Rock rheology, Comprehensive Rock Engineering: Principles,
Practice & Projects, editor-in-chief, John A. Huson, 1,523-544.
Bernabe, Y., Fryer, D.T. & Shively, R.M. (1994), Experimental observations of the elastic and inelastic behaviour of porous sandstones. Geophys. J. Int., 117, 403-418.
Jeng, F.S., Lin, M.L., Huang, T.H. (1996), Study of the Geological Barriers of the Tunnels in Northern Taiwn, Ministry of Transportation and Communications, Research Report MOTC-STAO-RD1501.
Jeng, F.S., Weng, M.C., Huang, T.H. & Lin, M.L. (2002), Deformational characteristics of
weak sandstone and impact to tunnel deformation. Tunn. Undergr. Space Technology, 17, 263-274.
Table 1. Testing program of Mushan sandstone state σ3(MPa) sample no. Pure shear stress path test(TC test) 20 3+1* 30 1+1* 40 1+1* 50 1 60 3+2* Pure shear stress path creep test 20 2+1* 40 1 60 2+1* Remark: *Cyclic loading/unloading was performed.
Fig. 1. Schematic illustration for stress path of pure
shear test. 0 10 20 30 40 50 60 70 -1600 -1400 -1200 -1000 -800 -600 -400 -200 0 200 400 600 Volumetric strain (10-6) S h ea r s tres s ( J2 ) 1/ 2 ( MPa ) compressible creep strain dilatant creep strain
(J2)1/2= 54.5 MPa 47.7 40.9 27.3 14 failure 61.4 I1/3=60 MPa Stabilization boundary -400 -300 -200 -100 0 100 200 300 0 5 10 15 20 25 30 35 40 Time (hour) V ol um et ri c creep s trai n ( 10 -6) Compressible Dilatant 14 27.3 (J2)1/2= 54.5 MPa 40.9 47.7 I1/3=60 MPa
Fig. 2. Shear stress vs volumetric strain relations. Fig. 3. Volumetric creep strain vs time relations. 0 10 20 30 40 50 60 70 0 2000 4000 6000 8000 10000 Volumetric strain (10-6 ) H y d ro st at ic s tr es s ( MP a)
Fig. 4. Typical volumetric strain vs hydrostatic stress
relations.
Fig. 5. Loops of unloading-reloading curves.
0 10 20 30 40 50 60 70 -3500 -3000 -2500 -2000 -1500 -1000 -500 0 500 1000 volumetric strain (10-6 ) S h ea r s tres s ( J2 ) 1/ 2 ( MPa ) p=60 MPa
Fig. 6. Relationship of volumetric strain with
hydrostatic stress.
Fig. 7. Variation of volumetric strain with shear stress
0 5 10 15 20 25 30 35 40 45 50 -900 -800 -700 -600 -500 -400 -300 -200 -100 0
Ealstic volmetric strain (10-6
) S h ea r s tr es s ( J2 ) 1 /2 (M P a )
Experimental data, p=20 MPa Experimental data, p=40 MPa Experimental data, p=60 MPa Hyperelastic model (p=20) Hyperelastic model (p=40) Hyperelastic model (p=60) p=60 MPa P=20 MPa p=40 MPa 0 0.2 0.4 0.6 0.8 1 1.2 -700 -600 -500 -400 -300 -200 -100 0
Ealstic volumetric strain (10-6
) Shear s res s ( J2 ) 1 /2 / H ydros tat ic s tres s P
Experimental data, p=20 MPa Experimental data, p=40 MPa Experimental data, p=60 MPa regression curve
Fig. 8. Loops of unloading-reloading curves. Fig. 9. A hypothetical elastic curve (show by thick,
solid line) was obtained by regression analysis.
0 10 20 30 40 50 60 70 -1500 -1000 -500 0 500 1000 Volumetric strain (10-6 ) S h ea r st re ss ( J2 ) 1/ 2 (MP a) Elastic def. Total def. Viscoplatic def. A Stabilization boundary. 0 10 20 30 40 50 60 70 0 2000 4000 6000 8000 10000 12000 14000 16000 18000 20000 Shear strain (J'2) 1/2 (10-6 ) S h ea r s tres s ( J2 ) 1/ 2 ( MPa ) p=60 MPa
Fig. 10. Typical result of total, elastic and viscoplatic
deformation after separation of components.
Fig. 11. Variation of shear strain with shear stress
during shear loading.
0 5 10 15 20 25 30 35 0 500 1000 1500 2000 2500 3000 3500 4000
Ealstic shear strain 2*(J'2)1/2 (10-6 ) S h ea r s tr es s ( J2 )1 /2 ( MP a)
Experimental data, p=20 MPa Experimental data, p=40 MPa Experimental data, p=60 MPa Hyprerelastic model (p=20 MPa) Hyprerelastic model (p=40 MPa) Hyprerelastic model (p=60 MPa)
P=20 MPa P=40 MPa P=60 MPa 0 10 20 30 40 50 60 70 -100 1900 3900 5900 7900 9900 11900 13900 15900 Shear strain (J'2)1/2 (10-6 ) S h ea r st re ss (J 2 ) 1/ 2 (M
Pa) Elastic def.
Total def. Viscoplatic def.
Stabilization boundary.
Fig. 12. Loops of unloading-reloading curves. Fig. 13. Typical result of total, elastic and viscoplatic deformation after separation of components.
0 10 20 30 40 50 60 70 -2500 -2000 -1500 -1000 -500 0 500 1000 volumetric strrain (10-6 ) sh ea r str ess (J 2 ) 1 /2 ( M Pa ) B
Viscoplatic def. form TC creep test
Platic def. form TC test
C
A : Total dilation threshold B : Platic dilation threshold C : Viscoplatic dilation threshold
A
total def. form TC test
0 0.2 0.4 0.6 0.8 1 0 10 20 30 40 50 60 70
Hydrostatic stress (MPa)
λ
Total dilation threshold Platic dilation threshold Viscoplatic dilation threshold
Fig. 14. variation of threshold with εv-(J2)0.5 curves. Fig. 15. Variation of threshold λ magnitude with