Structural and optical properties of single crystal Zn
1−xMg
xO nanorods—
Experimental and theoretical studies
Yu-Sheng Chang, Chih-Tao Chien, and Chun-Wei Chena兲
Department of Materials Science and Engineering, National Taiwan University, Taipei, Taiwan Ta-Ya Chu
Institute and Department of Electrophysics, National Chiao-Tung University, Taiwan Hsuen-Han Chiang, Chen-Hao Ku, and Jih-Jen Wu
Department of Chemical Engineering, National Cheng Kung University, Tainan, Taiwan Chao-Sung Lin
Department of Materials Science and Engineering, National Taiwan University, Taipei, Taiwan Li-Chyong Chen
Center for Condensed Matter Sciences, National Taiwan University, Taipei, Taiwan Kuei-Hsien Chen
Institute of Atomic and Molecular Sciences, Academic Sinica, Taipei, Taiwan
共Received 5 June 2006; accepted 13 November 2006; published online 1 February 2007兲
Structural and optical properties of single crystal Zn1−xMgxO nanorods共0ⱕxⱕ0.17兲 are studied experimentally and theoretically. Structural analyses indicate that the nanorods grown on Si substrates are oriented in the c-axis direction and the nanorods possess the single-crystalline hexagonal structure with the Mg incorporated within the ZnO nanorods by means of substituting Zn. A blueshift of the near-band edge emission in the photoluminescence spectra by increasing Mg content is observed. Two distinct emission bands are found in the photoluminescence spectra; one is mainly attributed to the delocalized exciton recombination and the other is originating from localized excitons due to the incorporation of foreign impurity of Mg. Enhanced exciton localization with increasing Mg content in Zn1−xMgxO nanorods is mainly due to large ionic characters of Mg-O bonding. Structural stability, band structures, projected density of states, and charge distribution in various Zn1−xMgxO alloy compounds were further investigated by first-principles calculations. A good agreement between experimental and theoretical results is found. © 2007 American Institute
of Physics.关DOI:10.1063/1.2429729兴
I. INTRODUCTION
ZnO has a direct band gap of 3.37 eV with a large exci-ton binding energy of 60 meV at room temperature. Due to the strong binding energy of excitons, ZnO-based semicon-ductors are recognized as very promising photonic materials in the ultraviolet共UV兲 region.1,2 Room-temperature UV las-ing properties in ZnO epitaxial films,3 microcrystalline thin films,4 and nanoclusters5 have been successfully demon-strated. Recently, the research on one-dimensional well-aligned single crystalline ZnO nanorods has attracted consid-erable attention owing to their potential applications in nanoscale optoelectronic devices.6Two critical challenges in fabricating ZnO laser diodes are p-type doping and band gap engineering in alloy semiconductors to create barrier layers and quantum wells which facilitate radiative recombination by carrier confinement. The addition of impurities among the wide band gap semiconductors often induces dramatic changes in their structural and optical properties. For ex-ample, ternary Zn1−xCdxO alloy has an energy gap lower than that for ZnO to serve as an active layer for light
emis-sion in the visible range because of the smaller direct band gap of CdO of 2.3 eV.7 The value of the energy gap of ternary Zn1−xBexO can be efficiently engineered to values larger than ZnO due to the larger band gap of BeO 共10.6 eV兲.8
Zn1−xMgxO is another candidate to develop ZnO-based alloy that has an energy gap larger than that of ZnO. The optical band gap energies of the hexagonal Zn1−xMgxO films are tunable from 3.3 to 4.0 eV at room temperature as the content of Mg is increased upward to x = 0.33.9
Since the crystal structures of ZnO and MgO are wurtz-ite共hexagonal, a=3.24 Å and b=5.20 Å兲 and rock salt 共cu-bic, a = 4.24 Å兲, respectively, the solubility limit of Mg in ZnO depends on the growth mechanisms as well as growth conditions.10–12Alloying ZnO with the increasing concentra-tion of Mg can lead to structural evoluconcentra-tion from a hexagonal phase to a cubic phase. Recently, one-dimensional Zn1−xMgxO nanorods have been synthesized and tunable photoluminescence 共PL兲 emission with Mg content can be achieved.13A blueshift of the near-band edge emission with increasing Mg content is observed, indicating the Zn1−xMgxO nanorods can be used as an excellent band gap engineering material for near UV nanophotonic applications. In this article, temperature and power dependent photolumi-nescence measurements were employed to investigate the a兲Author to whom correspondence should be addressed; electronic mail:
fundamental optical properties of Zn1−xMgxO 共0ⱕxⱕ0.17兲 nanorods. In addition, a comprehensive study of structural and optical properties in alloy Zn1−xMgxO compounds by first-principles calculations is also presented.
II. EXPERIMENTAL SETUP AND CHARACTERIZATIONS
Highly oriented Zn1−xMgxO nanorods were prepared on a Si共100兲 substrate by catalyst-free metalorganic chemical vapor deposition at low temperature of 500 ° C. The fabrica-tions of the Zn1−xMgxO nanorods were detailed elsewhere.13 In brief, tuning the partial pressures of the Zn and the Mg sources in gas phase via adjusting the vaporizing tempera-tures of the Zn and the Mg sources as well as the diameters of the Zn and the Mg source containers were employed to tailor the Mg contents of the single phase Zn1−xMgxO nano-rods grown in the metalorganic chemical vapor deposition reactor. Zinc and magnesium metalorganic sources, zinc acetylacetonate关Zn共C5H7O2兲2, Lancaster, 98%兴 and magne-sium acetylacetonate 关Mg共C5H7O2兲2, Aldrich, 98%兴, which were placed in two Pyrex glass containers were loaded into the two low-temperature zones of the furnace where the tem-peratures are controlled in the range of 115–125 and 185 − 215 ° C, respectively. The morphology of the nanorods was examined using scanning electron microscopy共SEM兲 共Hita-chi, S-4200兲. Elemental analyses were conducted using the electron probe x-ray microanalyzer 共EPMA兲 共JOEL, JXA-8600SX兲. The crystal structures of the Zn1−xMgxO nanorods were investigated by x-ray diffraction 共XRD兲 共Rigaku D/MAX-2000兲 and transmission electron microscopy 共TEM兲 共JOEL 2010兲.The PL spectra were obtained by exciting the samples using a continuous wave He-Cd laser共325 nm兲 and the emission spectra were analyzed with a Jobin–Yvon TRIAX 0.55 m monochromator and detected by a photomul-tiplier tube and standard photocounting electronics. The samples were maintained under vacuum inside a helium cry-ostat during measurements.
III. COMPUTATIONAL METHOD
The calculations were performed using first-principles, plane-wave, pseudopotential approach within the framework of density-functional theory 共DFT兲 implemented in the
CASTEP codes.14 The exchange-correction functional is ap-proximated by the local-density approximation 共LDA兲. The ion-electron interaction is modeled by the nonlocal, norm conserving pseudopotential.15 The summation over the Bril-louin zone was carried out with a k-point sampling using a Monkhorst–Pack grid.16 Ten different cubic and hexagonal derived Zn1−xMgxO structures with different compositions 共x=0, 0.25, 0.5, 0.75, and 1, respectively兲 are used to study the energetic stabilities and electronic structures. A kinetic-energy cutoff of 280 eV and 25 special k points were used to ensure the convergence in the calculations. In searching for the lowest-energy geometries for these crystals, each struc-ture was optimized for a specified cell geometry with relax-ation of both lattice parameters and atomic positions.
IV. RESULTS AND DISCUSSION A. Experimental results
1. Structural properties
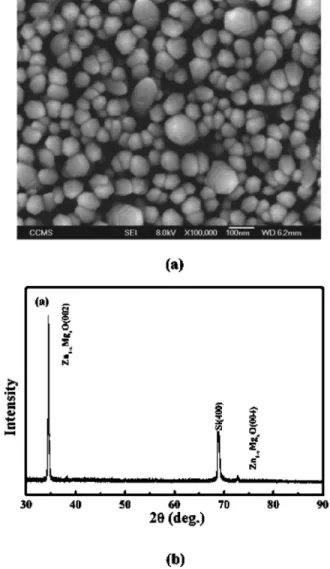
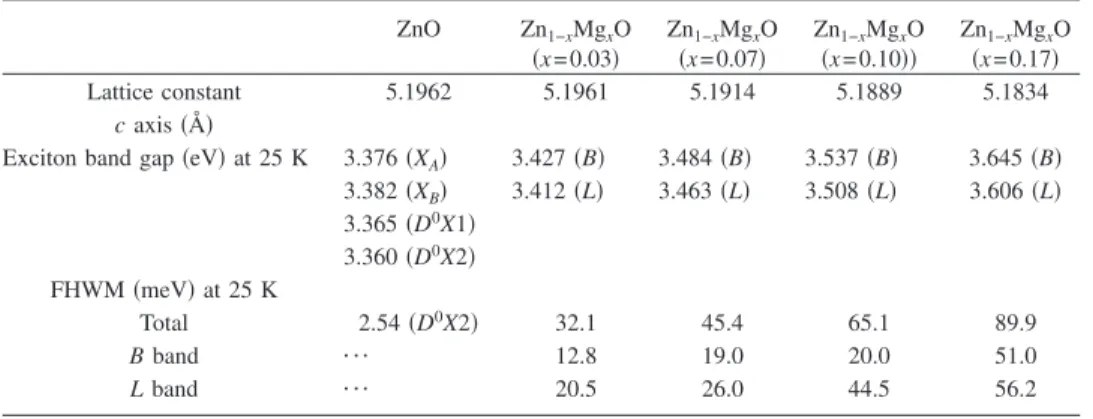
Figure1共a兲depicts the SEM image of the formation of a high density of well-aligned Zn1−xMgxO nanorods. Accord-ing to EPMA measurement, Mg content of Zn1−xMgxO na-norods is tunable from 0 to 0.17 by adjusting the partial pressures of the Zn and Mg sources in gas phase. A typical XRD pattern of the well aligned Zn1−xMgxO nanorods is shown in Fig. 1共b兲. In addition to the Si共004兲 diffraction peak, a peak very closed to 共002兲 diffraction peak of the hexagonal共wurtzite兲 ZnO structure appearing in the pattern implies that Zn1−xMgxO nanorods possess the same structure as that of the ZnO and they preferentially orient in the c-axis direction. There is no diffraction peak of MgO or Mg crystal present in the XRD pattern. The c-axis lattice constants cal-culated from the d 共002兲 peaks for the Zn1−xMgxO nanorods show a decreasing function of the Mg concentration as shown in TableI. The obtained c-axis lattice constant of ZnO nanorods 共5.1962 Å兲 is less than the previous report 共5.206 Å兲,17
which may results from the possible origin of stress in our samples due to the smaller diameters 共50–80 nm兲
com-FIG. 1. 共a兲 SEM micrograph of the well-aligned Zn1−xMgxO nanorods.共b兲
pared to those in the Ref. 17 共⬃300 nm兲. In addition, the
increasing surface-to-volume ratio with decreasing diameters in ZnO nanorods could also account for shortening of the
c-axis lattice constant according to the theoretical calculations,18 where the contraction of the in-plane Zn-O bond length occurs in the ZnO nonpolar关1010兴 surface. Fur-ther structural characterizations of the well-aligned Zn1−xMgxO nanorods were performed using the TEM analy-sis. A cross-sectional TEM image of the Zn1−xMgxO 共x = 0.10兲 nanorods on the Si substrate as shown in Fig. 2共a兲
demonstrates that most of the nanorods were grown perpen-dicularly to the substrate. The corresponding selected area diffraction 共SAD兲 of the cross-sectional image is illustrated in the inset. All the d spacing values estimated from the SAD are consistent with those of the ZnO structure and are mis-matching with those of the MgO and the Mg structures, con-firming the XRD analyses that MgO and Mg phases are not observed in the nanorods. Figure 2共b兲 illustrates a typical high-resolution共HR兲 TEM image of the Zn1−xMgxO nanorod as well as the corresponding electron diffraction pattern. The lattice spacing of around 0.52 nm corresponds to the d spac-ing of共001兲 crystal planes of the hexagonal ZnO. No segre-gated cluster of impurity phase appears throughout the nano-rod via HRTEM observation. The absence of the diffraction peaks of MgO or Mg phase in the XRD and TEM patterns and the systematic dependence of the Mg content with the lattice constant both imply that the Mg incorporated within the ZnO nanorods by means of substituting Zn.
2. Optical properties
Figure 3 shows the low temperature PL spectra of Zn1−xMgxO nanorods measured at 25 K with x equal to 0, 0.03, 0.07, 0.10, and 0.17, respectively. First, a blueshift of the near-band edge emission with increasing Mg content is observed. For the undoped ZnO nanorods, several sharp peaks in the vicinity of the band edge are observed. The inset exhibits the near-band edge emission of the ZnO nanorods consisting of four distinct peaks at 3.360, 3.365, 3.376, and 3.382 eV, respectively. The PL emission peaks at 3.376 and 3.382 eV are attributed to free A and B excitons and the peak positions at 3.365 and 3.360 eV are ascribed to neutral bound exciton peaks D0X1 and D0X2, respectively, in a good
agree-ment with the reported values in ZnO epilayers19 and
nanorods.17The green band at⬃2.5 eV caused by the intrin-sic defects or oxygen vacancies in the ZnO共Refs.20and21兲
is almost negligible, implying that the ZnO nanorods are almost defect free and of high quality. The full half width maximum共FHWM兲 value of the D0X2 exciton peak for ZnO
TABLE I. The lattice constant共c axis兲, exciton band gap, and FHWM for Zn1−xMgxO nanorods with x = 0, 0.03,
0.07, 0.10, and 0.17, respectively. ZnO Zn1−xMgxO 共x=0.03兲 Zn1−xMgxO 共x=0.07兲 Zn1−xMgxO 共x=0.10兲兲 Zn1−xMgxO 共x=0.17兲 Lattice constant 5.1962 5.1961 5.1914 5.1889 5.1834 c axis共Å兲
Exciton band gap共eV兲 at 25 K 3.376共XA兲 3.427共B兲 3.484共B兲 3.537共B兲 3.645共B兲
3.382共XB兲 3.412共L兲 3.463共L兲 3.508共L兲 3.606共L兲 3.365共D0X1兲 3.360共D0X2兲 FHWM共meV兲 at 25 K Total 2.54共D0X2兲 32.1 45.4 65.1 89.9 B band ¯ 12.8 19.0 20.0 51.0 L band ¯ 20.5 26.0 44.5 56.2
FIG. 2. 共a兲 TEM cross-sectional image of Zn1−xMgxO nanorods共x=0.10兲
and SAD pattern共inset兲. 共b兲 High-resolution TEM image of the top region of an individual Zn1−xMgxO nanorod共x=0.10兲 and the corresponding
nanorods is about 2.5 meV, which is as narrow as those for bulk crystals.3The increasing FHWM value with Mg content in Zn1−xMgxO nanorods is associated with alloy broadening commonly observed in alloy semiconductors. The PL spectra for Zn1−xMgxO nanorods can be further fitted with two Lorentzian functions labeled as B and L bands, respectively. The B band emission has a higher energy than the L band emission. The results are summarized in TableI
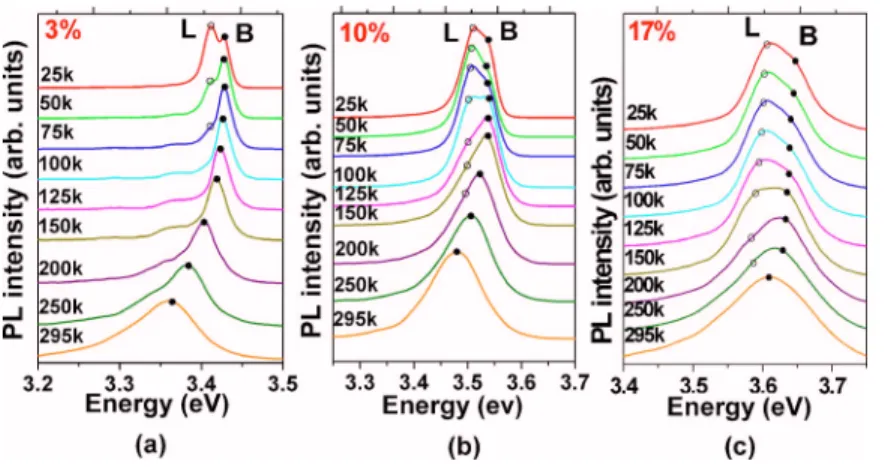
In order to understand the fundamental properties of B and L emission bands, a series of temperature- and power-dependent PL measurements were carried out. Figure 4
shows the evolution of PL spectra of Zn1−xMgxO nanorods with x = 0.03, 0.10, and 0.17, respectively, measured from 25 K to room temperature. A clear evolution from band L to band B is found when temperature is increased. For x = 0.03, band L is quickly thermally quenched and becomes unnotice-able at temperatures above 75 K. These transition tempera-tures are 200 and 250 K for x = 0.10 and 0.17, respectively. The distinct character of L band emission can observed at a higher temperature with increasing Mg content, leading to the assignment of the L band emission originating from ex-citons being localized by the foreign impurity of Mg atoms. The disorder and fluctuation is larger in ZnO than in III–V semiconductors because excitons in ZnO have a small Bohr radius 共18 Å兲 and are more sensitive to local inhomogeneity.22Figure5shows the correlation of the ther-mal activation energy Ea of the L band emission and the energy separation E at 25 K between bands B and L for
Zn1−xMgxO nanorods 共0ⱕxⱕ0.17兲. As the Mg content is increased, the excitonic localization is enhanced and the en-ergy separation E between bands B and L is also increased. At higher temperature, band L is thermally quenched and the localized excitons are dissociated into the delocalized exci-tons.
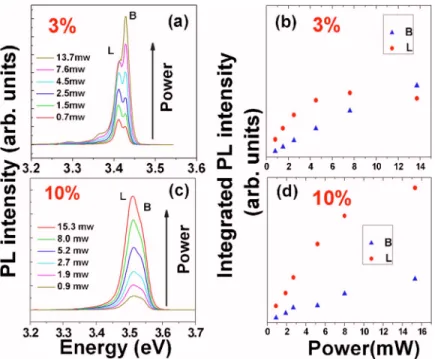
Figure 6共a兲 shows the excitation power dependence of PL spectra for the Zn1−xMgxO nanorod sample 共x=0.03兲 at 25 K. There is no shift in the emission peak positions for B and L bands over the whole excitation energy range. As the excitation power⬍4.5 mW, the intensity of L emission band is larger than B emission band. With the increase of excita-tion power ⬎4.5 mW, the predominant B emission band is observed. The integrated PL intensity of the B emission band increases linearly with excitation power; in contrast, the in-tensity of the L emission band reaches to saturation as the excitation power ⬎4.5 mW. The situation is very different for the Zn1−xMgxO nanorods with higher Mg content. Figure
6共b兲 shows the excitation dependent PL spectra for the Zn1−xMgxO nanorods with x = 0.10. The integrated PL inten-sities for both B and L emission bands exhibit a monotonic increasing function with excitation power. More pronounced
L band emission is always observed over the whole
excita-tion range. For the Zn1−xMgxO nanorods with low Mg con-tent共x=0.03兲, the photogenerated excitons are no longer able to be localized by Mg-related sites as the excitation power ⬎4.5 mW, leading to the saturation of L band emission
in-FIG. 3. PL spectra for Zn1−xMgxO nanorods with x = 0, 0.03, 0.07, 0.10, and
0.17 measured at 25 K. The inset shows the details of the near-band edge region of ZnO nanorods.
FIG. 4. Temperature dependent of PL spectra for Zn1−xMgxO nanorods with共a兲 x=0.03, 共b兲 x=0.10, 共c兲 x = 0.17, respectively. The filled circle 共쎲兲 represents
the B band emission and the open circle共䊊兲 represents the L band emission, respectively.
FIG. 5. Correlation of thermal activation energy Eaof the L band emission
共circle兲 and the energy separation E 共square兲 at 25 K between bands B and
tensity. Further increase in excitation power predominantly prompts the emerging emission related to delocalized exci-tons. For the Zn1−xMgxO nanorods with x = 0.10 which con-sists of a higher population of Mg atoms, the photogenerated excitons are predominantly localized to the impurities of Mg atoms within our excitation power range. The earlier results indicate that B band emission is mainly attributed to the de-localized exciton recombination and the L band emission is originating from localized exciton recombination due to the incorporation of foreign impurity of Mg. Similar observation has also been reported in the GaNAs/GaAs quantum well structure.23 It is worth noting that no stimulated emission or biexciton emission as seen in ZnO nanorods17 is expected due to the relatively low excitation power in our measure-ments.
B. Theoretical simulations 1. Structural properties
Ohtomo et al.,9 who obtained Zn1−xMgxO alloys with a hexagonal phase up to x = 0.36, beyond which MgO phase separation started to occur. Chen et al.24 have summarized approximately the dependence of Mg concentration on the band gap energy in Zn1−xMgxO thin films for x varying from 0 to 82 at. % and indicate that the hexagonal structure is more favorable for x⬍0.4, and the cubic phase is more stable for x⬎0.6. There is a mixed hexagonal and cubic phase for Mg content between 37% and 62%. Figure 7 ex-hibits the relative structural stability of ten different opti-mized hexagonal and cubic Zn1−xMgxO crystals with differ-ent Mg contdiffer-ent 共x=0, 0.25, 0.50, 0.75, and 1.0兲. From the total energy calculations, it is found that the hexagonal Zn1−xMgxO crystal is energetically favorable compared to the cubic-phase Zn1−xMgxO crystal for x⬍0.7. Our simu-lated results account for the structural stability of hexagonal and cubic Zn1−xMgxO crystals based on their electronic structures where no thermodynamic factor 共0 K兲 is consid-ered during calculations. Therefore, the discrepancy between
the simulated and experimental results for 0.4ⱕxⱕ0.6 is expected, where a mixed hexagonal and cubic phase exists. According to the phase diagram of ZnO-MgO binary sys-tems, the thermodynamic solid solubility of MgO in a ZnO matrix is normally less than 4 at. %.25The enhancement of solubility limit of Zn1−xMgxO might be explained in terms of nonthermal equivalent nature during different growth condi-tions. The variations of lattice constants a and c of simulated hexagonal Zn1−xMgxO crystals with increasing Mg content are shown in TableII. As Zn is replaced by Mg in the ZnO crystal 共Zn0.75Mg0.25O兲, although the ionic radius of Mg2+ 共0.57 Å兲 is smaller than Zn2+ 共0.60 Å兲,26
the Mg-O bond length along the c axis is enlarged from 1.997 to 2.009 Å due to the nature of more ionic Mg-O bonding. However, the buckled hexagonal rings of the wurtzite basal plane 共⬜c axis兲 become flat with increasing Mg content 共from 108.72° to 108.22°兲. As a result, the a-axis length in the lat-tice gradually increases, while the c-axis length decreases with increasing Mg content, consistent with our experimental results and also with other Zn1−xMgxO films.9
FIG. 6. Excitation power dependence of PL spectra measured at 25 K for Zn1−xMgxO nanorods with共a兲 x
= 0.03 and共c兲 x=0.10, respectively. Plots of the inte-grated intensities of B and L emission varying with ex-citation power 共b兲 for x=0.03 and 共d兲 for x=0.10, respectively.
FIG. 7. Relative structural stability of simulated hexagonal and cubic Zn1−xMgxO crystals with x = 0, 0.25, 0.50, 0.75, and 1, respectively.
2. Electronic structure calculations
The alloy band gap bowing behavior in hexagonal Zn1−xMgxO crystals is also examined. The experimental gap of ZnO is 3.37 eV and a band gap correction parameter of 2.42 eV is required for our calculations due to the underes-timation of band gap by LDA. With the correction applied to all other hexagonal Zn1−xMgxO crystals, we obtain a bowing coefficient b of 0.72 eV for these compounds, defined as
Eg共x兲 = 3.37共1 − x兲 + 5.91x − bx共1 − x兲, 共1兲 where 3.37 and 5.91 eV are the band gap values of hexago-nal ZnO and MgO crystals, respectively, after band gap cor-rection. Figure 8 shows the variation of band gap with Mg content in hexagonal Zn1−xMgxO crystals with 0ⱕxⱕ0.45 by Eq.共1兲 in comparison with experimental results. A good consistency between the theoretical and experimental results for x⬍0.25 is found. For x⬎0.3, the discrepancy between the experimental and simulated results may be attributed to the mixed phase in this region from experimental results.
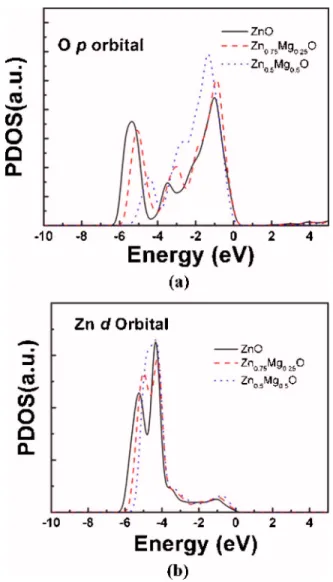
Large exciton localization effect in Zn1−xMgxO nanorods with increasing Mg content can be further realized by the following electronic structure calculations. Figures9共a兲and
9共b兲show the partial density of states共PDOS兲 of O 2p and Zn 3d bands of hexagonal Zn1−xMgxO 共x=0, 0.25, and 0.5兲 crystals, respectively. It is clearly shown that both O 2p and Zn 3d bands become more localized in the top of valence bands with a narrower bandwidth and larger PDOS intensity as the Mg content increases. The enhanced localization in O 2p and Zn 3d bands indicates that more ionic characters in Zn1−xMgxO crystals are found with increasing Mg content.
As a result, the photogenerated excitons will be localized more effectively in Zn1−xMgxO crystals with increasing Mg content, which accounts for the distinct characters between L and B band emission in our experiments.
V. CONCLUSION
In conclusion, we have investigated the structural and optical properties in Zn1−xMgxO nanorods experimentally and theoretically, by temperature and power dependent PL spectra and first-principles calculations. The structural and optical properties in Zn1−xMgxO nanorods can be tuned by varying the Mg content. Although the Mg-O bond length along the c axis is increased in Zn1−xMgxO crystals, the buckled hexagonal rings of the wurtzite basal plane become flat with increasing Mg content. As a result, the a-axis length in the lattice gradually increases, while the c-axis length de-creases. A blueshift of the near-band edge emission with in-creasing Mg content is observed and can be well described by a bowing equation from our calculations. Two distinct emission B and L bands are found in the PL spectra. The B emission band is mainly attributed to the delocalized exciton recombination. The L band emission originating from
local-TABLE II. The variation of lattice constants a and c of simulated hexagonal Zn1−xMgxO crystals with increasing Mg content.
x 0% 25% 50% 75% 100%
a共Å兲 3.275 3.297 3.313 3.325 3.333
c共Å兲 5.270 5.248 5.221 5.203 5.175
FIG. 8. Variations of band gap values in hexagonal Zn1−xMgxO crystals with
0ⱕxⱕ0.45 by Eq. 共1兲共line兲 in comparison with experimental results of Ref. 9共circle兲 and this experimental work 共square兲. The inset shows the
variation of band gap of the simulated hexagonal Zn1−xMgxO crystal
struc-tures共triangle兲 with x=0, 0.25, 0.50, 0.75, and 1 with respect to the Eq.共1兲 共line兲.
FIG. 9. PDOS of共a兲 O 2p and 共b兲 Zn 3d bands in hexagonal Zn1−xMgxO
crystals共x=0, 0.25, and 0.5兲, respectively. The 0 eV is defined as the top of the valence band.
ized excitons is largely enhanced with increasing Mg content in Zn1−xMgxO crystals due to their more ionic features.
ACKNOWLEDGMENT
This work is supported by National Science Council, Taiwan. 共Project Nos. NSC94–2120-M-001–015, NSC94– 2112-M-002–040, and NSC95–2120-M-002–014兲.
1H. J. Ko and Y. F. Chen, Z. Zhu, T. Yao, I. Kaobayyashi, and H. Uchiki,
Appl. Phys. Lett. 76, 1905共2000兲.
2W. I. Park, Y. H. Jun, S. W. Jung, and G.-C. Yi, Appl. Phys. Lett. 82, 964
共2003兲.
3D. M. Bagnall, Y. F. Chen, Z. Zhu, T. Yao, S. Koyama, M. Y. Shen, and T.
Goto, Appl. Phys. Lett. 70, 2230共1997兲.
4P. Zu, Z. K. Tang, G. K. L. Wong, M. Kawasaki, A. Ohtomo, H. Koinuma,
and Y. Segawa, Solid State Commun. 103, 459共1997兲.
5H. Cao, J. Y. Xu, E. W. Seelig, and R. P. H. Chang, Appl. Phys. Lett. 76,
2997共2000兲.
6M. H. Huang et al., Science 292, 1897共2001兲. 7T. Gruber et al., Appl. Phys. Lett. 83, 3290共2003兲. 8Y. R. Ryu et al., Appl. Phys. Lett. 88, 052103共2006兲.
9A. Ohtomo et al., Appl. Phys. Lett. 72, 2466共1998兲; The band gap values
used in the text are obtained from the inset in Fig. 4 of Ref.9.
10S. Choopun, R. D. Vispute, W. Yang, R. P. Sharma, T. Venkatesan, and H.
Shen, Appl. Phys. Lett. 80, 1529共2002兲.
11W. I. Park, G.-C. Yi, and H. M. Jang, Appl. Phys. Lett. 79, 2022共2001兲. 12A. K. Sharma, J. Narayan, J. F. Muth, C. W. Teng, C. Jin, A. Kvit, R. M.
Kolbas, and O. W. Holland, Appl. Phys. Lett. 75, 3327共1999兲.
13C. H. Ku, H. H. Chiang, and J. J. Wu, Chem. Phys. Lett. 404, 132共2005兲. 14M. C. Payne, M. Teter, D. C. Allan, and J. D. Joannopoulos, Rev. Mod.
Phys. 64, 1045共1992兲.
15A. J. Read and R. J. Needs, Phys. Rev. B 44, 13071共1991兲. 16H. J. Monkhorst and J. D. Pack, Phys. Rev. B 13, 5188共1976兲. 17B. P. Zhang, N. T. Binh, K. Wakatsuki, Y. Segawa, Y. Kashiwaba, and K.
Haga, Nanotechnology 15, S382共2004兲.
18B. Meyer and D. Mark, Phys. Rev. B 67, 035403共2003兲.
19S. W. Jung, W. I. Park, H. D. Cheong, G.-C. Yi, and H. M. Jang, Appl.
Phys. Lett. 80, 1924共2002兲.
20K. Vanheusden, W. L. Warren, C. H. Seager, D. K. Tallant, J. A. Voigt, and
B. E. Gnade, J. Appl. Phys. 79, 7983共1996兲.
21M. H. Huang, Y. Wu, H. Feick, N. Tran, E. Weber, and P. Yang, Adv.
Mater.共Weinheim, Ger.兲 13, 113 共2001兲.
22R. Zimmermann, J. Cryst. Growth 101, 346共1990兲.
23I. A. Buyanova, W. M. Chen, G. Pozina, J. P. Bergman, B. M. Monemar,
H. P. Xin, and C. W. Tu, Appl. Phys. Lett. 75, 501共1999兲.
24N. B. Chen and C. H. Sui, Mater. Sci. Eng., B 126, 16共2006兲. 25J. F. Sarver, F. L. Katnack, and F. A. Hummel, J. Electrochem. Soc. 106,
960共1959兲.
26R. D. Shannon, Acta Crystallogr., Sect. A: Cryst. Phys., Diffr., Theor. Gen.