Multiphoton microscopy for skin wound healing study in terms of
cellular metabolism and collagen regeneration
Gitanjal Deka
1, Kazunori Okano
2, Wei-Wen Wu
1, 3and Fu-Jen kao
11
Intitute of Biophotonics,National Yang-Ming University, Taipei, Taiwan.
2
Center for Interdisciplinary Science; National Chiao Tung University,
Taipei, Taiwan.3
Division of Plastic & Reconstructive Surgery, Department of Surgery, Heping Fuyou Branch, Taipei
City Hospital, Taipei, Taiwan ROC
Speaker’s E-mail:
[email protected]
;
ABSTRACT
Multiphoton microscopy was employed to study normal skin wound healing in live rats noninvasively. Wound healing is a process involving series of biochemical events. This study evaluates the regeneration of collagen and change in cellular metabolic activity during wound healing in rats, with second harmonic generation (SHG) and fluorescence lifetime imaging microscopy (FLIM), respectively. In eukaryotic cells ATP is the molecule that holds the energy for cellular functioning. Whereas NADH is an electron donor in the metabolic pathways, required to generate ATP. Fluorescence lifetime of NADH free to protein bound ratio was evaluated to determine the relative metabolic activity. The FLIM data were acquired by a TCSPC system using SPCM software and analyzed by SPCImage software. Additionally, polarization resolved SHG signals were also collected to observe the changes in optical birefringence and hence the anisotropy of regenerated collagens from rat wound biopsy samples. Mat lab programming was used to process the data to construct the anisotropy images. Results indicated that, cells involved in healing had higher metabolic activity during the first week of healing, which decreases gradually and become equivalent to normal skin upon healing completes. A net degradation of collagen during the inflammatory phase and net regeneration starting from day 5 were observed in terms of SHG signal intensity change. Polarization resolved SHG imaging of the wound biopsy sample indicates higher value of anisotropy in proliferative phase, from day 4th to 8th, of wound formation; however the anisotropy decreases upon healing.
Key words: Wound healing, Fluorescence Lifetime Imaging Microscopy, Second Harmonic Generation, Reduced Nicotinamide Adenine Dinucleotide, Collagen, Anisotropy.
1. INTRODUCTION
During skin wound healing the tissue repair is accomplished through a series of events involving various cell types, extracellular matrix (ECM) components, cytokines, various growth factors and other soluble mediators [1]. Skin repair begins with the formation of a fibrin-rich blood clot, which provides a provisional matrix for subsequent events to follow. Over successive days, the wound heals completely by forming a collagen rich dynamic scar tissue, which restores the functional integrity of the skin [1, 2]. Previous studies on wound healing reveal several vital sequential stages in wound repair, such as inflammation, fibroplasias and capillary invasion into the clot to start the contractile granulation phase [1, 3]. In clinics wounds are observed with histochemical assessment of the biopsies invasively [4, 5]. Most of these methods are limited in non-quantitative and non-qualitative measurements and may even cause further tissue damage and delay healing when biopsies are taken [6].This study demonstrates the feasibility of using laser induced noninvasive methods for diagnosing normal wounds.
Since the development of short pulsed lasers multi-photon excitation has become one of the most important techniques in modern optical microscopy [7, 8]. In comparison to conventional optical microscopy techniques, the multi-photon modality offers a number of advantages such as high resolution, less photo-bleaching and photo-damage [9], deep tissue imaging [10].Additionally, large spectral separation between the multi-photon excitation and emission provides easier collection of entire fluorescence [11]. Among other multi-photon techniques, two-photon microscopy and second harmonic generation is most effective in skin tissue imaging in terms of cellular activity and collagen regeneration [12]. Multi modality of imaging techniques provides the platform to image the different tissue parts easily [12].
Measuring the average life time of fluorescent molecules on the excited state upon light absorption, two-photon FLIM can be used to study relative cellular metabolic activity in terms of NADH protein bound to free ratio [11]. NADH is a coenzyme which donates electron in the metabolic pathways (glycolysis and electron transport chain (ETC)) [13]. Cellular NADH exists in two physiological forms: free and protein bound [13]. Upon binding to metabolic proteins, NADH molecules get associated with the energy generation pathway [14]. As NADH binds to a protein, its lifetime increases from ~0.4 ns to ~2.5 ns due to lack in self quenching [15]. The relative concentration of this coenzyme’s functional states (denoted as a1 and a2) can be measured by fitting the fluorescence decay of NADH to a double exponential model, [11, 14].On the other hand collagen is an extra cellular matrix protein that is crucial for wound healing [16].Since collagen has noncentrosymmetric structure, its regeneration during wound healing can be monitored by SHG microscopy [17].Thus, change in collagen intensity and regeneration direction at the healing wound could be the parameter for clinical diagnosis. Thus, multimodal multiphoton microscopy allows us to evaluate rat skin wound healing process, noninvasively, by monitoring the cellular metabolic rate of NADH free to bound ratio change and the collagen regeneration using FLIM and SHG, respectively.
2. MATERIALS AND METHODS 2.1 Experimental design and sample preparation
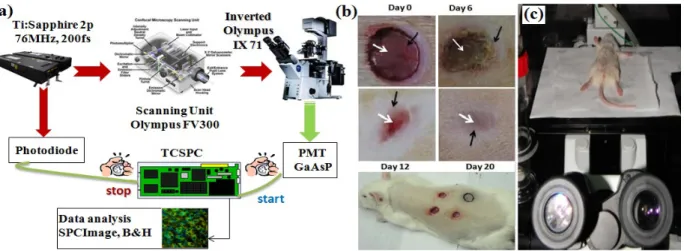
We used five SD (Sprague Dawley) male rats as the animal model for an in vivo noninvasive wound healing study each with 7 weeks old and 280 grams. The experiment was performed in a time lapsed schedule for the wound aging as from after 1 day, 2 days, 3days, 4 days, 5 days, 6 days, 8 days, 10 days, 12 days, 16 days, 20 days of wound formation. The 0th day defines the day of wound formation. For relative comparison of metabolism in normal skin tissue with the regenerating tissues, control data from unwounded skin was collected each day from a marked position on the rats. As wound heals from the edge and ends at the center, we chosen a position at the edge and one at the center for each day’s imaging. The white arrow in figure 1.(b) shows a representative such position at the center and the black arrow at the edge. Each of the five rats was sedated with a concentration of 50 milligram per kg of rat weight intra peritoneally with Pentobarbital (Pento) Sodium. Three circular wounds with a diameter of 8mm and a depth of 2mm on the back of each rat were made with a punch biopsy (Biopsy Punch, Miltex, Inc. PA 17402, USA). We have also used biopsy samples to observe collagen SHG anisotropy changes with wound healing.
2.2 Multiphoton excitation
Mira F-900 (Coherent, United States), mode-locked femtosecond Ti: sapphire laser, in the spectral range from 700 to 1000 nm, operating at 740 nm has been used for the two-photon excitation of cellular NADH auto-fluorescence and collagen second harmonic generation. The excitation beam was coupled to the FV300 (Olympus, Japan) scanning unit. Figure 1(a) schematically depicts the microscope setup. The laser power was ~ 5.5 mW after the 20X plan apochromat air objective (0.40 numerical aperture) (Olympus, Japan). Measurements were conducted on a modified inverted Olympus microscope IX 71 (Olympus, Japan). To match the spectral characteristics of excited molecules, band-pass filter of 447±30 nm was used for NADH autofluorescence signal and 360±40nm (Semrock, USA) was used for collagen SHG signal detection, respectively by a cooled PMT. Additionally, an IR cutoff filter was used for avoiding excitation light to the detector. 2.3 Photon acquisition and data analysis
The acquisition of SHG from collagens and cellular NADH’s FLIM data from intra cellular regions were acquired by a time-correlated single photon counting system (TCSPC) (SPC-830, Becker & Hickl, GmbH, Germany).Data were analyzed using SPCImage (v. 2.8) software (Becker & Hickl, GmbH, Germany). Lifetime calculation from a multi-exponential decay is done by mathematical convolution of a model function, and the instrument response function (IRF) by fitting with the experimental data. Lifetimes from the composite decays of NADH were then derived by convolution of an IRF, Iinstr, with a double-exponential model function, defined in Eq. (1), with offset correction for the ambient light
and/or dark noise I0 to obtain calculated lifetime decay function Ic(t) in Eq. (2)
2 1 / 2 / 1
)
(
t
a
e
t τa
e
t τF
=
−+
− ……..…. (1),∫
∞ ∞ − + = I t I F t dt t Ic( ) instru( ){ o ( )} …. (2).(a)
InvertedTi:Sapphire 2p Sex., U.,
Olympus 76MHz, 200fs
..._.. %
-7--- DC 71 .i-
4E-- .--LN0t0j0e
,,
TCSPC Scanning Unit Olympus FV300 stop,
Data analysis SPCImage, B &H Day 6 PA'IT GaAsP start Where / 1 1 τ te
a
− and / 2 2 τ te
a
− denote the contributed fluorescence decays from short and long lifetimecomponents of NADH, respectively; a1 and a2 refer to the corresponding relative amplitudes and τ1 and τ2 represent their
corresponding lifetime constants. The average lifetime was calculated as an amplitude-weighted parameter of the two lifetime components: 2 1 2 2 1 1
a
a
a
a
m+
+
=
τ
τ
τ
………. (3).The ratio of a1 and a2 is the indicator of free and protein-bound states of NADH, which can be used to depict changes in
cellular metabolism.Note that higher value of a2 represents higher fraction of protein bound NADH. Thus, the value of a1/a2ratio is inversely proportion to the metabolic activity.
2.5 SHG intensity measurements
The second harmonic images were analyzed for SHG signal intensity by using the Java-based image processing software Image-J (National Institute of Health, USA). The photon aquisitionis was done by using the SPCImage software (Becker & Hickl, GmbH, Germany). Owing to that the light coming out of the Ti-Sapphire laser is horizontally polarized, we placed one analyzer in front of the detector, to collect the polarization resolved information. We calibrated the analyzer to transmit horizontally polarized light at 0o and vertical polarized light at 90o position.
Fig. 1: (a) Schematic diagram of the experimental setup. (b) Representative image of freshly created wound on rat and healing wounds at four different stages of healing. White arrow shows a representative center position and black arrow shows representative edge position for time resolved imaging. (c) Living rat over the microscope sample stage.
3. RESULTS AND DISCUSION 3.1 NADH free to bound ratio change
A higher metabolic rate from day 1st to 6th of wound formation was observed with averaged peak value of a
1/a2 distribution within the range of 1.8 to 2 at the center of the wound. From the 8th day, the metabolic rate gradually decreased, where the a1/a2 value reaches 2.2 on that day. From the 10th day to 20th, the ratio increased gradually within a range of 2.4 to 3.5 [Fig. 2 (b)]. The metabolic rate at the edge was comparable with that of the center for the first 3 days. Before the 4th day, the edge of the wound was also under inflammation, subsequently causing a comparable metabolic rate of edge with that of center. From the 4th day the average value of a
1/a2 increased to 2.5 in comparison to center, 2.1 [Fig. 2 (b)]. The average free to protein bound NADH ratio at the edge was approximately same from the 4th to 10th day within a range of 2.35 to 2.65. We observed newly generated skin at the edge, starting from 4th day and subsequently decreasing cellular metabolism due to complete healing. Additionally, the area of newly formed skin increased towards the center with each passing day, finally reaching the center causing gradual increase in a1/a2 value, starting from the 10th to the 20th Day. As the entire wound started to acquire new skin after a week, similar values of a1/a2 ratio at the center and edge were detected, starting
(b)
4 3 o La 2;
i(c)
D Center Edge x Normal skin z >tc ** *** *** ## ## ## # ## #% # # ### ### ### DO D1 D2 D3 D4 DS D6 D8 D10 D12 D16 D20Days after wound formation
* *** 1.2 1 0.8 0.6 0.4 0.2 0 *** # ## xc *** ## T T
*
*** # ##.
*
*** # ##*
7 *** # ##*
*** # ##z
* # ## ** # i*
*** # %I: *** # ## X DO D1 D2 D3 D4 DS D6 D8 D10 D12Days after wound formation
### ### #
?
x
center Edge X Normal skin D16 D20from the 10th day. Figs. 3(b) and 3(c) illustrate Color-coded FLIM images of relative increase in free form NADH over bound form during the healing process at the center and edge, respectively.
Fig. 2: (a) representative color coded a1/a2 lifetime images and grey scaled intensity images of collagen regeneration
by SHG in response to wound healing, (b) Scatter plot of a1/a2 change during wound healing for center and edge.
Significant differences of a1/a2 values measurements by two side student’s t-test at center from normal skin are
designated by *:P>0.05, **:0.05>P>0.001 and ***:P<0.001. And at edge from normal skin are designated as #:P>0.05, ##:0.05>P>0.001, ###:P<0.001. P value less than 0.05 was considered significant. (c) Scatter plot of normalized SHG intensitychange during wound healing for center and edge. Significant differences of SHG intensity measurements by two side student’s t-test at center from normal skin are indicated by *:P>0.05, **:0.05>P>0.001 and ***:P<0.001. And at edge are designated as #:P>0.05, ##:0.05>P>0.001 and ###:P<0.001, P value less than 0.05 was considered significant.
Day 3 Day 5 Day 7 Day 12 Day 16 Day 20
H
Horizontal Detection Vertical Detection Anisotropy Images3.2 Degradation and regeneration of collagen:
Our results indicated decreasing trends in SHG signal intensity from day 1 to day 4 resulted from net degradation of collagens supporting epidermal cell migration [Fig. 2(a), (c)]. After the 5th day, the signal intensity start increasing and net regeneration accelerates even more from 12th to 20th days, which was required for the observed scar formation [Fig. 2(a), (c)]. The observed signal intensity on 20th day was higher than that of a normal skin. At the edge of the wound, the SHG signal was higher than that of the center [Fig. 2(c)]. After the 4th day, the SHG signal improved more in edge than in the center as newly generated skin began to appear at the edge first [Fig. 1(b)]. The detected SHG signal intensity differences between center and edge were increasingly smaller on day 16th and 20th than that on the 12th day. This finding suggests that, when the wound undergoes the remodeling phase, collagens deposit in a greater amount as days passes by.
3.3 Collagen reorganization:
A random organization of collagen bundles were observed from the normal skin. Native collagens were found on the exposed dermis of the wound on the first day of wound formation, when the upper epidermal and a portion of the dermal layer were removed. Degradation of these collagens occurs to facilitate the dermal cell crawling to the wounded site for the first four days. Although collagen generation started from the 1st to 2nd day of wound formation, but the 1st to 4th day, net degradation was more than the regeneration, which results in gradually decreasing collagen concentration [Fig. 2(c)]. Collagens were laid down by the fibroblast to provide the provisional matrix to increase the wound closer and tissue strength. From 5th day onwards the net regeneration becomes higher than the degradation, which makes the apparent increase in SHG intensity [Fig. 2(c)]. Ultimately, on 16th and 20th day of healing, well organized collagens were observed on the newly form scar tissue [Fig. 2(a)].
3.4 Anisotropy measurement
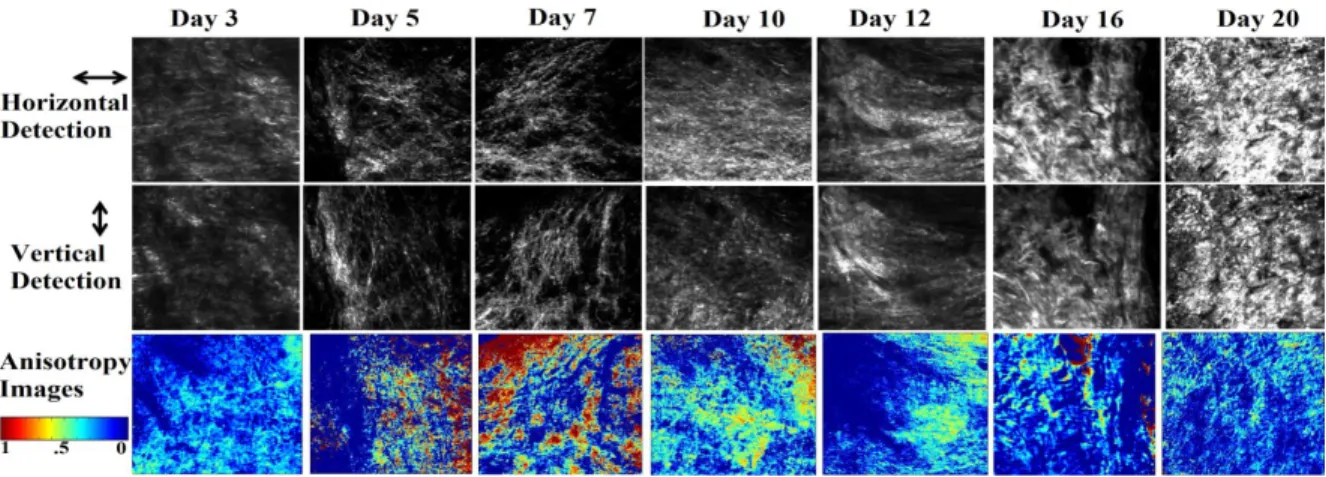
Polarization resolved SHG detection results explains that collagens were more organized and fibrillar from day 4th to 8th when wound margins were pulled together by them. After day 10th, collagen deposits to fill the wound gape which increase the SHG intensity but become a 3D matrix rather than 1D fiber. Figure 3 depicts the representative SHG images taken from the biopsy samples. Our results elucidates higher birefringence properties of collagen during the proliferative phase of wound healing where wound closer by the collagen fibers were must needed [that is day 4th to 8th]. Anisotropy in collagen organization was measured by the equation (4) [13, 16]. And it is given by:
= ...(4)
When, β(t)= 0, it represents the isotropic condition where Ipar and Iperp are equal and physically correspond to having complete randomization of the scatterer. And, if β (t) = 1, corresponds to complete ordering relative to the incident laser, i.e., having well aligned, well-structured scattered system [18, 19].
Fig. 3: Polarization resolved SHG intensity images from biopsy samples taken after different day of wound formation. First row is the images for 0o angle between analyzer and incident light, second row is the images for 90o
angle between analyzer and incident light. Third row is the anisotropy (β; Equation 4) images for the same; processed by ‘Mat lab’ programming.
Images processed by ‘Mat lab’ programming depict the changes in anisotropy with wound healing. Results shows higher anisotropy values during 4th to 8th day. However on 2nd day the molecular collagens have lesser value of anisotropy. Also when wound healing is completing from day 10 onwards the anisotropy starts decreasing [20, 21].
CONCLUSION
FLIM of cellular NADH can provide the mesure of relative metabolic activity of cells in tissues. At the time of skin wound healing, collagens are also crucial biomolecules that can be imaged by SHG. This study has demonstrated the possibility of using multiphoton microscopy in studying wound healing physiology noninvasively. The cellular metabolic rate was higher on the first week both at the center and the edge. Wound healing starts from the edge and finishes at center. Accordingly, the metabolism also decreases at the edge first and finally becomes similar to the center at the time of complete healing. Collagens were observed to be degraded in the first four days, where as the net regeneration exceeds the degradation day 5th onwards and increases gradually. Additionally, collagens in newly generated skin were observed to be more aligned than those in normal skin. Further, we have imaged the freshly cut wounded skin biopsy tissue of rat by SHG of collagen fibers. High anisotropy value of collagen was observed during the starting of proliferative phase when imaged with polarized light. The maximum anisotropy was observed in the wound between 5th to 10th day of healing.
ACKNOWLEDGEMENT
The authors would like to thank the National Science Council of the Republic of China, Taiwan for financially supporting this research. The Taiwan Mouse Clinic, which is funded by the National Research Program for Biopharmaceuticals (NRPB) of the National Science Council (NSC) of the Republic of China, Taiwan, is appreciated for its technical support. Professor T.B.J. Kuo, Department of Brain Research, National Yang Ming University, is commended for use of his laboratory equipment and space for harvesting and dealing with live rats.
REFERENCES
1. Martin, P., “Wound healing--Aiming for perfect skin regeneration,” Science 276(5309), 75-81 (1997).
2. Eckes, B. “Collagen and the reestablishment of dermal integrity” Chapter 16 in [The Molecular and Cellular Biology of Wound Repair], R. A. F. Clark, eds., pp. 493-512, Plenum Press, New York (1996).
3. Tuan, T. L., Nichter, L. S., “The molecular basis of keloid and hypertrophic scar formation,” Mol. Med. Today 4(1), 19-24 (1998).
4. Snyder, R. J., “Treatment of nonhealing ulcers with allografts,” Clin. Dermatol. 23(4), 388-395 (2005). 5. Taylor, J. E., Laity, P. R., Hicks, J., Wong, S. S., Norris, K., Khunkamchoo, P., Johnson, A. F., Cameron, R. E.,
“Extent of iron pick-up in deforoxamine-coupled polyurethane materials for therapy of chronic wounds,” Biomaterials 26(30), 6024-6033 (2005).
6. Schönfelder, U. , Abel, M., Wieqand, C., Klemm, D., Elsner, P., Hipler, U. C., “Influence of selected wound dressings on PMN elastase in chronic wound fluid and their antioxidative potential in vitro,” Biomaterials 26(33), 6664-6673 (2005).
7. Gauderon, R., lukins P. B., Sheppard, C. J., “Simultaneous multichannel nonlinear imaging: combined two-photon excited fluorescence and second-harmonic generation microscopy,” Micron 32(7), 685-689 (2001).
8. Denk, W., Strickler J. H., Webb, W. W., “Two-photon laser scanning fluorescence microscopy,” Science 248(4951), 73-76 (1990).
9. Patterson, G. H. and Piston, D. W., “Photo bleaching in two-photon excitation microscopy,” Biophys J. 78(4), 2159– 2162 (2000).
10. Conchello, J. A. and Lichtman, J. W., “Optical sectioning microscopy,” Nat. Methods. 2(12), 920-931 (2005). 11. Ghukasyan V. V. and Kao, F. J., “Monitoring cellular metabolism with fluorescence lifetime of reduced nicotinamide
adenine dinucleotide,” J. Phys. Chem. C 113(27), 11532-11540 (2009).
12. Zoumi, A., Yeh, Alvin., Tromberg, B. J., “Imaging cells and extracellular matrix in vivo by using second harmonic generation and two photon excited fluorescence” Proc. Natl. Acad. Sci. 99(17), 11014-11019 (2002).
14. Alberts, B., Johnson, A., Lewis, J., Raff, M., Roberts, K., Walter, P., [Molecular Biology of the Cell, B], Garland Science, New York, USA (2008).
15. Gafni, A. and Brand, L., “Fluorescence decay studies of reduced nicotinamide adenine dinucleotide in solution and bound to liver alcohol dehydrogenase,” Biochemistry 15(15), 3165-3171 (1976).
16. Williams, R. M., Zipfel, W. R., Webb, W. W., “Interpreting second-harmonic generation images of collagen I fibrils,” Biophys. J. 88(2), 1377-1386 (2005).
17. Ruszczak, Z., “Effect of collagen matrices on dermal wound healing,” Adv. Drug. Deliv. Rev. 55(12), 1595-1611 (2003).
18. Campagnola, P. J., Millard, A. C., Terasaki, M., Hoppe, P. E., Malone, C. J., Mohler, W. A., “Three-dimensional high resolution second-harmonic generation imaging of endogenous structural proteins in biological tissues,” Biophys. J. 82 (1), 493–508 (2002).
19. Stroller, P., Reiser, K. M., Celliers, P. M., Rubenchik, A. M., “Polarization-modulated second harmonic generation in collagen,” Biophys. J. 82 (6), 3330–3342, (2002).
20. Gomez, M. A., Woo, S. L., Amiel, D, Harwood F, Kitabayashi L, Matyas, J. R., “The effects of increased tension on healing medial collateral ligaments,” Am. J. Sports. Med. 19(4), 347-54 (1991).