Research Article
Large-Scale Investigation of Human TF-miRNA Relations
Based on Coexpression Profiles
Chia-Hung Chien,
1Yi-Fan Chiang-Hsieh,
1Ann-Ping Tsou,
2Shun-Long Weng,
3,4,5Wen-Chi Chang,
1and Hsien-Da Huang
6,7,8,91Institute of Tropical Plant Sciences, National Cheng Kung University, Tainan 701, Taiwan
2Department of Biotechnology and Laboratory Science in Medicine, National Yang-Ming University, Taipei 112, Taiwan 3Mackay Medicine, Nursing and Management College, Taipei 112, Taiwan
4Department of Medicine, Mackay Medical College, New Taipei City 252, Taiwan
5Department of Obstetrics and Gynecology, Hsinchu Mackay Memorial Hospital, Hsinchu 300, Taiwan 6Institute of Bioinformatics and Systems Biology, National Chiao Tung University, Hsinchu 300, Taiwan 7Department of Biological Science and Technology, National Chiao Tung University, Hsinchu 300, Taiwan
8Department of Biomedical Science and Environmental Biology, Kaohsiung Medical University, Kaohsiung 807, Taiwan 9Institute of Biomedical Engineering, National Chiao Tung University, Hsinchu 300, Taiwan
Correspondence should be addressed to Wen-Chi Chang; [email protected] and Hsien-Da Huang; [email protected]
Received 11 March 2014; Revised 2 May 2014; Accepted 18 May 2014; Published 9 June 2014 Academic Editor: Tzong-Yi Lee
Copyright © 2014 Chia-Hung Chien et al. This is an open access article distributed under the Creative Commons Attribution License, which permits unrestricted use, distribution, and reproduction in any medium, provided the original work is properly cited.
Noncoding, endogenous microRNAs (miRNAs) are fairly well known for regulating gene expression rather than protein coding. Dysregulation of miRNA gene, either upregulated or downregulated, may lead to severe diseases or oncogenesis, especially when the miRNA disorder involves significant bioreactions or pathways. Thus, how miRNA genes are transcriptionally regulated has been highlighted as well as target recognition in recent years. In this study, a large-scale investigation of novel cis- and trans-elements was undertaken to further determine TF-miRNA regulatory relations, which are necessary to unravel the transcriptional regulation of miRNA genes. Based on miRNA and annotated gene expression profiles, the term “coTFBS” was introduced to detect common transcription factors and the corresponding binding sites within the promoter regions of each miRNA and its coexpressed annotated genes. The computational pipeline was successfully established to filter redundancy due to short sequence motifs for TFBS pattern search. Eventually, we identified more convinced TF-miRNA regulatory relations for 225 human miRNAs. This valuable information is helpful in understanding miRNA functions and provides knowledge to evaluate the therapeutic potential in clinical research. Once most expression profiles of miRNAs in the latest database are completed, TF candidates of more miRNAs can be explored by this filtering approach in the future.
1. Introduction
Among functional noncoding RNAs (ncRNAs), microR-NAs (miRmicroR-NAs) are tiny molecules (∼21–23 nt) with giant roles. miRNAs participate in gene regulation by targeting messenger RNAs (mRNAs) and influencing their stability and the initiation of translation. It is implied that if the expression of miRNA is aberrant, miRNA-mediated gene circuitries will be disordered, resulting in homeostatic
imbal-ance, pathogenesis, and oncogenesis [1, 2]. In recent years,
elucidating transcriptional regulatory mechanisms of miRNA genes has been highlighted when studying miRNA function. Core promoters of miRNA genes were promptly identified for depicting full-length primary transcripts [3–5]. High-throughput sequencing datasets derived from epigenetic sig-nature and TSS-relevant experiments unfold transcriptional start sites (TSSs) of miRNAs and offer a practical strategy to determine miRNA promoters [6–9].
To further understand upstream regulatory elements controlling miRNA expression, transcription factors (TFs) Volume 2014, Article ID 623078, 8 pages
and their binding sites of miRNA promoters were deciphered by either literature survey or computational prediction [10– 13]. By integrating the information of TF-miRNA regulatory relations and miRNA target interactions, regulatory networks that revolved around miRNAs provide a biological insight into how miRNAs dominate functional processes in bio-chemical reactions or metabolic pathways [14–17]. However, most of the foregoing studies regarded the upstream regions
of pre-miRNAs as promoters (e.g., 10 kb upstream or−900∼
+100 of the 5-start of the pre-miRNA). More convinced
miRNA promoters should be used for searching putative TF-binding sites. In addition, the experimentally verified TF-miRNA relations are insufficient for current miRNAs. According to the statistics in the latest version 1.2 of
Trans-miR, only 735 entries, which include ∼201 transcriptional
factors,∼209 miRNAs, and 16 organisms from 268
publi-cations, were curated. A large-scale investigation of novel cis- and trans-elements is necessary to fulfill the unmet need for locating transcription factor binding sites (TFBSs) within miRNA promoter regions.
Since sequence-specific TFs possess DNA-binding domains (DBDs) to recognize specific motifs in miRNA promoter sequences, potential binding sites can be detected by sequence-based computational approaches, for example, position weight matrix (PWM). A position weight matrix (also called position specific scoring matrix, PSSM) infers a pattern of DNA segment and is widely applied in searching TFBSs [18–21]. Two well-known databases collecting matrix information are TRANSFAC [22] and JASPAR [23]. To avoid excess false positives due to short sequence motifs used for TFBS pattern search, cis-regulatory analysis of coregulated gene sets was executed to determine overrepresented TFBSs [24, 25]. Although previously published web server Pscan [26] and oPOSSUM [27] can search transcription factor binding sites in coexpressed gene promoters to remit the impact of false positive issue, users have to define their coexpressed gene groups with valid gene IDs. In addition, miRNA promoter sequences are not included in these two web servers.
Therefore, the purpose of this study is to create a computational pipeline to undertake large-scale investigation of novel cis- and trans-elements for human miRNA genes based on coexpression strategy. First, we constructed 255 coexpressed gene groups of human miRNAs. Moreover, instead of grapping the upstream regions of pre-miRNAs as promoter sequences, we exploited more concrete human miRNA promoters by following the processes as previously described [7]. Through the detection of transcription factor binding sites within promoter regions of human miRNAs and their coexpressed genes by using matrix information from TRANSFAC, the common TFBSs were identified. We then filtered the redundancy by not only the occurrence of common TFBSs but also the expression correlation between TF-encoded genes and corresponding human miRNA gene groups. Finally, more reliable TF-miRNA regulatory relations of 225 human miRNAs were provided. Furthermore, the liver-specific hsa-miR-122 was also selected as the case study to demonstrate the usage of this filtering approach and its practicability.
2. Materials and Methods
2.1. Human miRNA Promoter Sequences. The latest genomic coordinates of human miRNAs were retrieved from miRBase release 19 [28]. Human miRNA TSSs were identified by repro-ducing the computational procedures described in miRStart resource [7]. The formula which determines tag-enriched loci was modified by weighted tag density (tag density multiply by tag number) in the SVM step to precisely reveal the effect of tag intensity. Then, 1 kb upstream sequences of human miRNA TSSs were acquired from UCSC Genome Browser [29] (hg19/GRCh37 assembly) in FASTA format. The updated intergenic miRNA TSSs in human genome are listed in supplementary Table S1 (available online at http://dx.doi.org/10.1155/2014/623078) in additional file for reference.
2.2. Expression Profiles of Human miRNAs and Annotated Genes. In order to determine human genes that are coex-pressed with specific miRNA genes, GDS596 record, the Affymetrix gene expression profiles from 79 physiologically human normal tissues, was downloaded from Gene
Expres-sion Omnibus (GEO) [30, 31]. Among annotated human
genes in GDS596, genes were filtered out if their HGNC symbols are invalid or have been withdrawn. On the other hand, the expression data of 345 miRNAs in 40 normal human tissues generated by a new type of real time reverse transcription- (RT-) PCR-based miRNA assays were also collected [32]. Mature miRNAs with eliminated miRBase IDs (release 19) were discarded. In both expression datasets, only 17 tissues (adrenal, brain, heart, kidney, liver, lung, lymph node, ovary, pancreas, placenta, prostate, skeletal muscle, testicle, trachea, thymus, thyroid, and uterus) are in common and were considered to be integrated expression profiles of annotated genes and miRNA genes with 17 conditions. To standardize expression levels across extensive range of both
datasets, the raw intensity was𝑍-score transformed [33].
2.3. Coexpressed Gene Groups of Human miRNAs. After the transformation process between two expression datasets, Pearson’s correlation coefficient (PCC) was calculated to estimate which annotated genes are coexpressed with specific miRNAs. The formula of Pearson’s correlation coefficient
(usually using the letter𝑟) is as follows:
𝑟𝑥𝑦= ∑ 𝑛 𝑖=1(𝑋𝑖− 𝑋) (𝑌𝑖− 𝑌) √∑𝑛 𝑖=1(𝑋𝑖− 𝑋)2√∑𝑛𝑖=1(𝑌𝑖− 𝑌)2 , (1)
where𝑋𝑖and 𝑌𝑖 denote the expression level of𝑖 condition
(tissue) of two genes 𝑥 and 𝑦 that are calculated for 𝑟,
whereas 𝑋 and 𝑌 represent the average of corresponding
expression levels in total 𝑛 conditions. Since the value of
Pearson’s correlation coefficient ranges from +1 (positively
correlated) to−1 (negatively correlated), we defined that two
genes of interest are coexpressed if their Pearson’s correlation coefficient is more than 0.8. Subsequently, coexpressed genes of human miRNAs were determined, and their promoter
Promoter sequence miRNA TSS Expression profiles Expression profile of TF-encoded gene Coding gene 1 C o exp re ss ed g enes Coding gene 2 Coding gene 3 Coding gene 4 Coding gene 5 Coding gene 6 Coding gene 7 Coding gene 8 Coding gene 9 Coding gene 10 Identifying coexpressed genes of miRNA of interest
Filtering redundancy
TFBS?
miRNA Calculate coTFBS occurrence
coTFBS
Evaluate expression correlation between miRNA and coTFBS
More convinced TF-miRNA relations
Obtain the promoter sequences (upstream1000 bps from TSSs) of miRNA
coexpressed gene group and use Match to detect TFBSs
Match
1 kb
Figure 1: The summary of detecting TF-miR regulatory relations in human genome.
sequences (1 kb upstream from TSS) were obtained from BioMart of Ensembl release 69 [34].
2.4. CoTFBSs in Human miRNA Promoters. In this work, we defined coTFBS as a common TFBS located in promoter regions of coexpressed genes. The TRANSFAC database [22], comprising data on transcription factors, their target genes, and regulatory binding sites, has been widely used when studying eukaryotic transcriptional regulation. After acquiring 1 kb promoter sequences of miRNA genes and their coexpressed genes in FASTA format, the Match program [35] was executed for sequence motif search of transcription factor binding sites according to the matrix information pro-vided by TRANSFAC (version 2011.4). A customized profile which specified human matrices in TRANSFAC library was used for Match to minimize both false positive and false negative rates with core similarity and matrix similarity cut-off values for each matrix. As defined in the publication of Match, the core of each matrix refers to the first five most conserved consecutive positions of a matrix. A putative TFBS with core similarity less than 1 was filtered out. The occurrence of each coTFBS and its expression correlation with miRNA in coexpressed gene groups was calculated finally. Only those whose encoded genes are coexpressed with corresponding miRNA were considered.
3. Results
3.1. Human miRNAs with Coexpressed Gene Group for
Detect-ing TF-miRNA Relations. Figure 1summarizes the workflow
to investigate human TF-miRNA regulatory relations based on expression profiles of miRNA and annotated genes. Pear-son’s correlation coefficient (PCC) was applied to measure the similarity of expression patterns across 17 human normal tissues, which represents the coexpressed level between a specific miRNA gene and an annotated gene of interest.
Due to the reason that Pearson’s𝑟 cannot be calculated if
the expression levels in all 17 conditions are identical, 29 mature miRNAs with such expression profiles were excluded. After discarding the mature miRNAs whose miRBase IDs are eliminated, 289 human miRNAs were selected to estimate PCC values with annotated human genes in GDS596 record. Among them, however, only 255 human miRNAs have
more than one coexpressed genes (PCC > 0.8). Moreover,
25 out of 255 human miRNAs have no identified TSSs by following the previous strategy [7] and have to be filtered. In total, 230 human miRNAs were qualified to discover putative cis- and trans-elements in their promoter regions. The number of members of each miRNA coexpressed gene group ranges from several to thousand (see Table S2 in additional file for details).
3.2. Putative TF-miRNA Relations Were Explored according to the Occurrence of CoTFBS. Theoretically, a group of genes that are coexpressed may be regulated by common transcrip-tion factors. Based on this concept, a specific transcriptranscrip-tion factor binding site located in the promoter regions of most genes in each coexpressed group implies that its correspond-ing TF is the most possible one controllcorrespond-ing the expression of these genes. Here, we introduce the term “coTFBS” which
Promoter region miRNA gene TSS Coding gene 2 TSS Coding gene 3 TSS Coding gene 4 Coding gene 1 TSS coTFBS TSS
Figure 2: The concept of coTFBS. Protein-coding genes 1, 2, 3, and 4 are coexpressed with the miRNA gene. Colored rectangles represent transcription factor binding motifs in each promoter region. The common TFBS (pink) located within the promoters of miRNA gene and other four genes represents the “coTFBS” of this gene group.
represents the common TFBS of a coexpressed gene group to filter redundant TF candidate of miRNA genes. For example, the “pink rectangle” binding motifs were detected in the proposed miRNA and other four gene promoters in Figure 2. The occurrence of this coTFBS is five. By scanning TFBSs in promoter regions of each miRNA gene and its coexpressed gene group using Match based on TRANSFAC library (version 2011.4) and following the filtering process, the putative TFs that regulate a specific miRNA were determined. In this work, we successfully identified putative TF-miRNA relations of 225 human miRNAs. The full list of putative TFs for each human miRNA promoter can be accessed in Table S3.
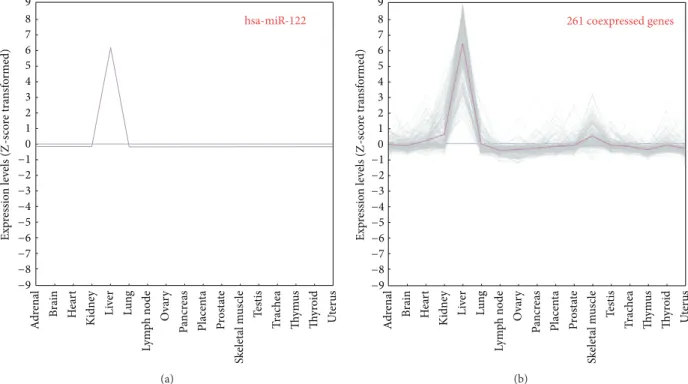
3.3. Case Study: hsa-miR-122. hsa-miR-122 is one of the intergenic miRNAs whose TSS and promoter have been experimentally characterized [7]. Previous studies reported that this liver-specific miRNA is significantly downregulated in hepatocellular carcinoma and profoundly affects carcino-genesis [36]. Because of the explicit promoter and biological importance, hsa-miR-122 was selected as the case study to investigate which TFs may regulate its gene expression. 261 annotated genes coexpressed with miR-122 were identified according to their expression levels with Pearson’s correlation
coefficient (PCC) more than 0.8. Figure 3 compares the
expression patterns of 261 coexpressed genes (the pink line represents the average value of their expression) with hsa-miR-122 among 17 human normal tissues, indicating that remarkable peaks appear in liver for all the coexpressed genes. The expression image (see Figure S1 in additional file) also reveals the similar trends between hsa-miR-122 and its coexpressed genes.
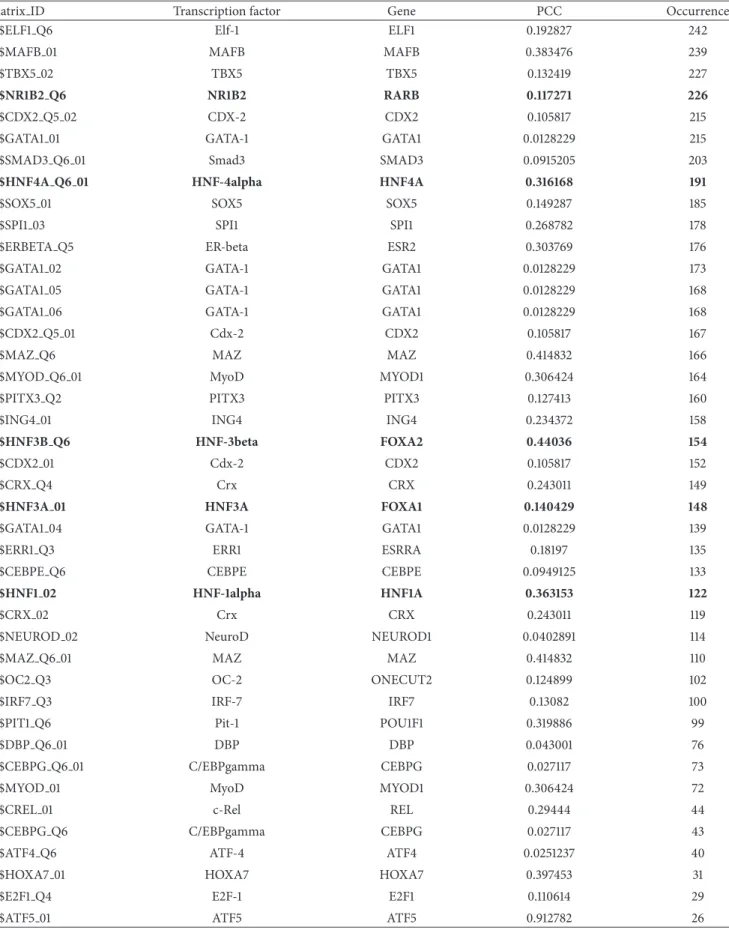
Then, the promoter sequences (1 kb upstream from TSS) of hsa-miR-122 gene and 261 coexpressed genes were col-lected to identify coTFBSs using Match. The occurrence of putative transcription factors of miR-122 is listed in Table 1. Among TF candidates regulating hsa-miR-122, the TF binding motif of HNF-4alpha can be found in 191 coexpressed gene promoters. In 2011, Li et al. reported that HNF-4alpha
is a key regulator positively controlling the expression of miR-122 in liver [37], proving our computational finding. They performed not only the luciferase reporter gene assay to detect the trans-activation effect of HNF-4alpha in miR-122 promoter but also the ChIP and EMSA assays to determine HNF-4alpha binding of miR-122 promoter in vitro and in vivo. Moreover, other liver-enriched transcription factors including 1alpha, 3alpha, 3beta, and HNF-6 showed a strong positive correlation with miR-122. The knockout of HNF1A, FOXA1, and FOXA2 by RNAi assay reduces the expression of miR-122, suggesting that these transcription factors may bind to miR-122 promoter and transcriptionally regulate miR-122 [38]. Importantly, HNF-1alpha, HNF-3alpha, and HNF-3beta were identified in our list of TF candidates, and a HNF-6 binding site was determined (−2720 from miR-122 TSS) if the 3 kb promoter sequence of miR-122 was used.
In addition, the TF binding site of NR1B2 can be found in 226 coexpressed gene promoters. A previous research article published in 1987 indicated that the inappropriate expression of HAP gene (the official HGNC symbol is RARB) may relate to the hepatocellular carcinogenesis, and hap protein may directly participate in the hepatocellular transformation [39]. It is implied that transcription factor NR1B2 may bind to miR-122 promoter and regulate its expression.
4. Discussion
For large-scale investigation of human TF-miRNA relations in this study, the expression profiles of human miRNAs and over ten thousands genes from normal human tissues facil-itate the acquirement of miRNA coexpressed gene groups. However, the latest usable RT-qPCR miRNA expression data for human normal tissues were published in 2007 [32]. The currently available data are almost derived from cancer cell lines or tumor tissues. Totally 230 coexpressed gene groups limit the coTFBS analysis of most miRNAs in existence. Besides, based on the cut-off 0.8 PCC value applied to define coexpression between a miRNA and an annotated gene, 34 miRNAs have no coexpressed genes and 50 miRNAs have less than ten coexpressed genes. Although each miRNA has sufficient coexpressed genes to analyze its putative cis-and trans-elements if the lower PCC cut-off was used, it may cause the trade-off of specificity when determining miRNA coexpressed genes. For example, hsa-let-7a-1 has no coexpressed gene when using 0.8 PCC value but has 29 coexpressed genes if 0.6 PCC value was applied.
It is noteworthy that the normalization process between
two raw expression datasets was only𝑍-score transformed,
without using log10transformation before𝑍-score
standard-ization. According to the definition of formula, Pearson’s correlation coefficient calculates linear correlation between two variables and has an invariant property in statistics.
In fact, the log10 transformation tends to alter the original
expression patterns and sharply reduces the scale of raw intensity, resulting in unexpected affection of PCC values. Figure S2 illustrates an example of hsa-miR-122 expression
9 8 7 6 5 4 3 2 1 0 −1 −2 −3 −4 −5 −6 −7 −8 −9 Ad re n al Br ai n He ar t Ki d n ey Li ve r Lu n g Ly m p h n o d e Ov ar y Pa n cr ea s Placen ta Pro st ate Sk elet al m u sc le Te st is T rac he a Thy mu s Thy ro id Ut er u s hsa-miR-122 Exp ressio n le ve ls ( Z -s co re tra n sf o rmed) (a) 9 8 7 6 5 4 3 2 1 0 −1 −2 −3 −4 −5 −6 −7 −8 −9 Ad re n al Br ai n He ar t K idne y Li ve r Lu n g Ly m p h n o d e Ov ar y Pa n cr ea s Placen ta Pro st ate Sk elet al m u sc le Te st is T rac he a Thy mu s Thy ro id Ut er u s 261 coexpressed genes Exp ressio n le ve ls ( Z -s co re tra n sf o rmed) (b)
Figure 3: 261 human protein-coding genes are coexpressed with hsa-miR-122. The pink curve in 3(b) represents the average value of miR-122 coexpressed genes among 17 human normal tissues. The remarkable peaks appear in liver.
to the high expression level in liver, two obvious peaks of
brain and thymus appear in the log10 transformed
expres-sion profile of hsa-miR-122. The members of hsa-miR-122 coexpression group also reflect the variation. Unlike more
than two hundred coexpression genes by using 𝑍-score
transformed expression data, merely five coexpressed genes
left based on the cut-off 0.8 PCC value by𝑍-score and log10
transformed data.
Another limitation of TFBS/TF detection depends on present transcription factor binding matrices collected in TRANSFAC. As is well known, sequence motif search of transcription factor binding sites is executed by the Match program according to the matrix information in TRANSFAC library. A specific TFBS in miRNA promoter will not be detected if the corresponding matrix has not been obtained by in vitro selection studies. Here is an example. Unlike hsa-miR-122, miR-224 is upregulated in HCC through epigenetic mechanisms and controls several crucial cellular processes [40]. Wang et al. indicated that miR-224 expression is recip-rocally regulated by HDAC1, HDAC3, and EP300. Our result shows that P300 (encoded by EP300) is the TF candidate of miR-224, and its TFBS can be found in 227 coexpressed gene promoters. Because matrices of histone deacetylases 1 and 3 are not available in TRANSFAC, no such transcription factors were predicted.
In conclusion, rather than traditional PWM search char-acterizing putative cis-elements in promoter regions, the coTFBS strategy was developed to determine more confident TFBSs for human miRNAs. The investigation was restricted by the incomplete expression profiles of present human miRNAs. Once most expression profiles of miRNAs in the
latest database are available, TF candidates of more miRNAs can be explored in the future. Furthermore, although more and more ChIP-seq data were generated and were useful to identify transcription factor binding sites [41–43], the corresponding ChIP-seq data of specific TFs are still the minority. It is expected that large-scale ChIP analysis of general TFs contributes more confident TFBSs by observing the aggregated peaks within promoter regions of human miRNAs.
5. Conclusions
In organisms, not all of ribonucleic acids (RNAs) are trans-lated to proteins. miRNAs are such noncoding RNAs which play critical roles in gene regulation, even if it is generally believed that proteins convey vital information from genes and execute biological functions to maintain life processes. Although target prediction has been the mainstream when studying miRNA functions for a while, researchers start to explore TF-miRNA interactions and study the transcrip-tional regulation of miRNAs, which are necessary to depict how miRNAs participate in diverse biological processes. To determine putative TFs and TFBSs located in human miRNA promoters, we created a computational pipeline which not only allows large-scale investigation as long as the expression profiles of miRNAs are available, but also filters the redundancy when searching short sequence. This valuable information is helpful in understanding miRNA functions and provides knowledge to evaluate the therapeutic potential in clinical research.
Table 1: Putative transcription factors regulating miR-122 gene. The bold items indicate the experimental-supported TFs. PCC represents the Pearson’s correlation coefficient between each TF-encoded gene and miR-122.
Matrix ID Transcription factor Gene PCC Occurrence
V$ELF1 Q6 Elf-1 ELF1 0.192827 242
V$MAFB 01 MAFB MAFB 0.383476 239
V$TBX5 02 TBX5 TBX5 0.132419 227
V$NR1B2 Q6 NR1B2 RARB 0.117271 226
V$CDX2 Q5 02 CDX-2 CDX2 0.105817 215
V$GATA1 01 GATA-1 GATA1 0.0128229 215
V$SMAD3 Q6 01 Smad3 SMAD3 0.0915205 203
V$HNF4A Q6 01 HNF-4alpha HNF4A 0.316168 191
V$SOX5 01 SOX5 SOX5 0.149287 185
V$SPI1 03 SPI1 SPI1 0.268782 178
V$ERBETA Q5 ER-beta ESR2 0.303769 176
V$GATA1 02 GATA-1 GATA1 0.0128229 173
V$GATA1 05 GATA-1 GATA1 0.0128229 168
V$GATA1 06 GATA-1 GATA1 0.0128229 168
V$CDX2 Q5 01 Cdx-2 CDX2 0.105817 167
V$MAZ Q6 MAZ MAZ 0.414832 166
V$MYOD Q6 01 MyoD MYOD1 0.306424 164
V$PITX3 Q2 PITX3 PITX3 0.127413 160
V$ING4 01 ING4 ING4 0.234372 158
V$HNF3B Q6 HNF-3beta FOXA2 0.44036 154
V$CDX2 01 Cdx-2 CDX2 0.105817 152
V$CRX Q4 Crx CRX 0.243011 149
V$HNF3A 01 HNF3A FOXA1 0.140429 148
V$GATA1 04 GATA-1 GATA1 0.0128229 139
V$ERR1 Q3 ERR1 ESRRA 0.18197 135
V$CEBPE Q6 CEBPE CEBPE 0.0949125 133
V$HNF1 02 HNF-1alpha HNF1A 0.363153 122
V$CRX 02 Crx CRX 0.243011 119
V$NEUROD 02 NeuroD NEUROD1 0.0402891 114
V$MAZ Q6 01 MAZ MAZ 0.414832 110
V$OC2 Q3 OC-2 ONECUT2 0.124899 102
V$IRF7 Q3 IRF-7 IRF7 0.13082 100
V$PIT1 Q6 Pit-1 POU1F1 0.319886 99
V$DBP Q6 01 DBP DBP 0.043001 76
V$CEBPG Q6 01 C/EBPgamma CEBPG 0.027117 73
V$MYOD 01 MyoD MYOD1 0.306424 72
V$CREL 01 c-Rel REL 0.29444 44
V$CEBPG Q6 C/EBPgamma CEBPG 0.027117 43
V$ATF4 Q6 ATF-4 ATF4 0.0251237 40
V$HOXA7 01 HOXA7 HOXA7 0.397453 31
V$E2F1 Q4 E2F-1 E2F1 0.110614 29
Conflict of Interests
The authors declare that there is no conflict of interests regarding the publication of this paper.
Authors’ Contribution
Chia-Hung Chien, Shun-Long Weng, Wen-Chi Chang, Ann-Ping Tsou, and Hsien-Da Huang conceived and designed the experiments. Chia-Hung Chien and Yi-Fan Chiang-Hsieh analyzed the data and performed the experiments. Chia-Hung Chien wrote the paper.
Acknowledgments
Thanks are due to Pei-Wen Jiang for the assistance of pro-gramming and system maintenance and to Hsi-Yuan Huang for experience sharing in expression profile analysis. This research was supported by a grant from National Science Council of the Republic of China for financially supporting this research under Contract nos. NSC 102-2313-B-006-004, NSC 101-2311-B-009-003-MY3, NSC 100-2627-B-009-002, NSC 102-2911-I-009-101, and NSC 99-2628-B-006-016-MY3.
References
[1] S. M. Khoshnaw, A. R. Green, D. G. Powe, and I. O. Ellis, “MicroRNA involvement in the pathogenesis and management of breast cancer,” Journal of Clinical Pathology, vol. 62, no. 5, pp. 422–428, 2009.
[2] R. Schickel, B. Boyerinas, S.-M. Park, and M. E. Peter, “MicroR-NAs: key players in the immune system, differentiation, tumori-genesis and cell death,” Oncogene, vol. 27, no. 45, pp. 5959–5974, 2008.
[3] H. K. Saini, S. Griffiths-Jones, and A. J. Enright, “Genomic analysis of human microRNA transcripts,” Proceedings of the
National Academy of Sciences of the United States of America,
vol. 104, no. 45, pp. 17719–17724, 2007.
[4] H. K. Saini, A. J. Enright, and S. Griffiths-Jones, “Annotation of mammalian primary microRNAs,” BMC Genomics, vol. 9, article 564, 2008.
[5] J. Qian, Z. Zhang, J. Liang et al., “The full-length transcripts and promoter analysis of intergenic microRNAs in Drosophila
melanogaster,” Genomics, vol. 97, no. 5, pp. 294–303, 2011.
[6] A. Barski, R. Jothi, S. Cuddapah et al., “Chromatin poises miRNA- and protein-coding genes for expression,” Genome
Research, vol. 19, no. 10, pp. 1742–1751, 2009.
[7] C.-H. Chien, Y.-M. Sun, W.-C. Chang et al., “Identifying transcriptional start sites of human microRNAs based on high-throughput sequencing data,” Nucleic Acids Research, vol. 39, no. 21, pp. 9345–9356, 2011.
[8] M. Bhattacharyya, L. Feuerbach, T. Bhadra, T. Lengauer, and S. Bandyopadhyay, “MicroRNA transcription start site prediction with multi-objective feature selection,” Statistical Applications in
Genetics and Molecular Biology, vol. 11, no. 1, article 6, 2012.
[9] Y. Saito, H. Suzuki, T. Taya et al., “Development of a novel microRNA promoter microarray for ChIP-on-chip assay to identify epigenetically regulated microRNAs,” Biochemical and
Biophysical Research Communications, vol. 426, no. 1, pp. 33–37,
2012.
[10] J. Wang, M. Lu, C. Qiu, and Q. Cui, “TransmiR: a transcription factor microRNA regulation database,” Nucleic Acids Research, vol. 38, supplement 1, pp. D119–D122, 2009.
[11] R. Shalgi, D. Lieber, M. Oren, and Y. Pilpel, “Global and local architecture of the mammalian microRNA-transcription factor regulatory network,” PLoS Computational Biology, vol. 3, no. 7, article e131, 2007.
[12] C.-Y. Chen, S.-T. Chen, C.-S. Fuh, H.-F. Juan, and H.-C. Huang, “Coregulation of transcription factors and microRNAs in human transcriptional regulatory network,” BMC
Bioinfor-matics, vol. 12, supplement 1, article S41, 2011.
[13] A. Re, D. Core, D. Taverna, and M. Caselle, “Genome-wide sur-vey of microRNA-transcription factor feed-forward regulatory circuits in human,” Molecular BioSystems, vol. 5, no. 8, pp. 854– 867, 2009.
[14] O. Friard, A. Re, D. Taverna, M. de Bortoli, and D. Cor´a, “CircuitsDB: a database of mixed microRNA/transcription factor feed-forward regulatory circuits in human and mouse,”
BMC Bioinformatics, vol. 11, article 435, 2010.
[15] A. le Bechec, E. Portales-Casamar, G. Vetter et al., “MIR@NT@N: a framework integrating transcription factors, microRNAs and their targets to identify sub-network motifs in a meta-regulation network model,” BMC Bioinformatics, vol. 12, article 67, 2011.
[16] H. Naeem, R. Kuffner, and R. Zimmer, “MIRTFnet: analysis of miRNA regulated transcription factors,” PLoS ONE, vol. 6, no. 8, article e22519, 2011.
[17] X. Li, W. Jiang, W. Li et al., “Dissection of human miRNA regulatory influence to subpathway,” Briefings in Bioinformatics, vol. 13, no. 2, pp. 175–186, 2012.
[18] M. Beckstette, R. Homann, R. Giegerich, and S. Kurtz, “Fast index based algorithms and software for matching position specific scoring matrices,” BMC Bioinformatics, vol. 7, article 389, 2006.
[19] M. C. Frith, J. L. Spouge, U. Hansen, and Z. Weng, “Statistical significance of clusters of motifs represented by position spe-cific scoring matrices in nucleotide sequences,” Nucleic Acids
Research, vol. 30, no. 14, pp. 3214–3224, 2002.
[20] S. Rahmann, T. Muller, and M. Vingron, “On the power of pro-files for transcription factor binding site detection,” Statistical
Applications in Genetics and Molecular Biology, vol. 2, article 7,
2003.
[21] Y. M. Oh, J. K. Kim, S. Choi, and J.-Y. Yoo, “Identification of co-occurring transcription factor binding sites from DNA sequence using clustered position weight matrices,” Nucleic
Acids Research, vol. 40, no. 5, article e38, 2012.
[22] V. Matys, E. Fricke, R. Geffers et al., “TRANSFAC: tran-scriptional regulation, from patterns to profiles,” Nucleic Acids
Research, vol. 31, no. 1, pp. 374–378, 2003.
[23] E. Portales-Casamar, S. Thongjuea, A. T. Kwon et al., “JASPAR 2010: the greatly expanded open-access database of transcrip-tion factor binding profiles,” Nucleic Acids Research, vol. 38, supplement 1, pp. D105–D110, 2010.
[24] S. Aerts, G. Thijs, B. Coessens, M. Staes, Y. Moreau, and B. de Moor, “Toucan: deciphering the cis-regulatory logic of coregulated genes,” Nucleic Acids Research, vol. 31, no. 6, pp. 1753–1764, 2003.
[25] T. T. Marstrand, J. Frellsen, I. Moltke et al., “Asap: a framework for over-representation statistics for transcription factor bind-ing sites,” PLoS ONE, vol. 3, no. 2, article e1623, 2008.
[26] F. Zambelli, G. Pesole, and G. Pavesi, “Pscan: finding over-represented transcription factor binding site motifs in sequences from co-regulated or co-expressed genes,” Nucleic
Acids Research, vol. 37, supplement 2, pp. W247–W252, 2009.
[27] S. J. H. Sui, J. R. Mortimer, D. J. Arenillas et al., “oPOSSUM: identification of over-represented transcription factor binding sites in co-expressed genes,” Nucleic Acids Research, vol. 33, no. 10, pp. 3154–3164, 2005.
[28] A. Kozomara and S. Griffiths-Jones, “miRBase: integrating microRNA annotation and deep-sequencing data,” Nucleic
Acids Research, vol. 39, supplement 1, pp. D152–D157, 2011.
[29] T. R. Dreszer, D. Karolchik, A. S. Zweig et al., “The UCSC Genome Browser database: extensions and updates 2011,”
Nucleic Acids Research, vol. 40, supplement 1, pp. D918–D923,
2012.
[30] A. I. Su, T. Wiltshire, S. Batalov et al., “A gene atlas of the mouse and human protein-encoding transcriptomes,” Proceedings of
the National Academy of Sciences of the United States of America,
vol. 101, no. 16, pp. 6062–6067, 2004.
[31] T. Barrett, D. B. Troup, S. E. Wilhite et al., “NCBI GEO: mining tens of millions of expression profiles—database and tools update,” Nucleic Acids Research, vol. 35, supplement 1, pp. D760– D765, 2007.
[32] Y. Liang, D. Ridzon, L. Wong, and C. Chen, “Characterization of microRNA expression profiles in normal human tissues,” BMC
Genomics, vol. 8, article 166, 2007.
[33] C. Cheadle, M. P. Vawter, W. J. Freed, and K. G. Becker, “Analysis of microarray data using Z score transformation,” The Journal of
Molecular Diagnostics, vol. 5, no. 2, pp. 73–81, 2003.
[34] P. Flicek, I. Ahmed, M. R. Amode et al., “Ensembl 2013,” Nucleic
Acids Research, vol. 41, no. 1, pp. D48–D55, 2013.
[35] A. E. Kel, E. Gossling, I. Reuter, E. Cheremushkin, O. V. Kel-Margoulis, and E. Wingender, “MATCH: a tool for searching transcription factor binding sites in DNA sequences,” Nucleic
Acids Research, vol. 31, no. 13, pp. 3576–3579, 2003.
[36] W.-C. Tsai, S.-D. Hsu, C.-S. Hsu et al., “MicroRNA-122 plays a critical role in liver homeostasis and hepatocarcinogenesis,” The
Journal of Clinical Investigation, vol. 122, no. 8, pp. 2884–2897,
2012.
[37] Z. Y. Li, Y. Xi, W. N. Zhu et al., “Positive regulation of hepatic miR-122 expression by HNF4𝛼,” Journal of Hepatology, vol. 55, no. 3, pp. 602–611, 2011.
[38] C. Coulouarn, V. M. Factor, J. B. Andersen, M. E. Durkin, and S. S. Thorgeirsson, “Loss of miR-122 expression in liver cancer correlates with suppression of the hepatic phenotype and gain of metastatic properties,” Oncogene, vol. 28, no. 40, pp. 3526–3536, 2009.
[39] H. de The, A. Marchio, P. Tiollais, and A. Dejean, “A novel steroid thyroid hormone receptor-related gene inappropriately expressed in human hepatocellular carcinoma,” Nature, vol. 330, no. 6149, pp. 667–670, 1987.
[40] Y. Wang, H. C. Toh, P. Chow et al., “MicroRNA-224 is up-regulated in hepatocellular carcinoma through epigenetic mechanisms,” The FASEB Journal, vol. 26, no. 7, pp. 3032–3041, 2012.
[41] J. Qin, M. J. Li, P. Wang, M. Q. Zhang, and J. Wang, “ChIP-Array: combinatory analysis of ChIP-seq/chip and microarray gene expression data to discover direct/indirect targets of a transcription factor,” Nucleic Acids Research, vol. 39, supplement 2, pp. W430–W436, 2011.
[42] M. Hu, J. Yu, J. M. Taylor, A. M. Chinnaiyan, and Z. S. Qin, “On the detection and refinement of transcription factor binding sites using ChIP-Seq data,” Nucleic Acids Research, vol. 38, no. 7, pp. 2154–2167, 2010.
[43] T. Handstad, M. B. Rye, F. Drablos, and P. Sætrom, “A ChIP-Seq benchmark shows that sequence conservation mainly improves detection of strong transcription factor binding sites,” PLoS
Submit your manuscripts at
http://www.hindawi.com
Hindawi Publishing Corporation
http://www.hindawi.com Volume 2014
Anatomy
Research International
Peptides
Hindawi Publishing Corporation
http://www.hindawi.com Volume 2014
Hindawi Publishing Corporation http://www.hindawi.com
International Journal of
Volume 2014
Zoology
Hindawi Publishing Corporation
http://www.hindawi.com Volume 2014 Molecular Biology International
Hindawi Publishing Corporation
http://www.hindawi.com Volume 2014
The Scientific
World Journal
Hindawi Publishing Corporationhttp://www.hindawi.com Volume 2014
Hindawi Publishing Corporation
http://www.hindawi.com Volume 2014
Bioinformatics
Advances inMarine Biology
Journal ofHindawi Publishing Corporation
http://www.hindawi.com Volume 2014 Hindawi Publishing Corporation
http://www.hindawi.com Volume 2014
Signal Transduction
Journal ofHindawi Publishing Corporation
http://www.hindawi.com Volume 2014
BioMed
Research International
Evolutionary Biology
International Journal of
Hindawi Publishing Corporation
http://www.hindawi.com Volume 2014
Hindawi Publishing Corporation
http://www.hindawi.com Volume 2014
Biochemistry Research International
Archaea
Hindawi Publishing Corporation
http://www.hindawi.com Volume 2014
Hindawi Publishing Corporation
http://www.hindawi.com Volume 2014 Genetics
Research International
Hindawi Publishing Corporation
http://www.hindawi.com Volume 2014
Advances in
Virology
Hindawi Publishing Corporation http://www.hindawi.com
Nucleic Acids
Journal ofVolume 2014
Stem Cells
International
Hindawi Publishing Corporation
http://www.hindawi.com Volume 2014
Hindawi Publishing Corporation
http://www.hindawi.com Volume 2014
Enzyme
Research
Hindawi Publishing Corporation
http://www.hindawi.com Volume 2014
International Journal of