Early life phthalate exposure and atopic disorders in children: a
prospective birth cohort study
I-Jen Wanga,b,c, Ching-Chun Lind, Yen-Ju Lind,Wu-Shiun Hsiehe*, Pau-Chung Chend,f,g*
aDepartment of Pediatrics, Taipei Hospital, Ministry of Health and Welfare, Taipei, Taiwan bChina Medical University, Taichung, Taiwan
cCollege of Medicine, National Yang-Ming University, Taipei, Taiwan;
dInstitute of Occupational Medicine and Industrial Hygiene, National Taiwan University College of Public Health, Taipei, Taiwan
eDepartment of Pediatrics, National Taiwan University Hospital, Taipei, Taiwan
fDepartment of Public Health, National Taiwan University College of Public Health, Taipei, Taiwan
gDepartment of Environmental and Occupational Medicine, National Taiwan University College of Medicine and National Taiwan University Hospital, Taipei, Taiwan
*W.S. Hsieh and P.C. Chen contributed equally to this article
The authors declare no conflict of interest. *Corresponding author at: Pau-Chung Chen
Institute of Occupational Medicine and Industrial Hygiene, National Taiwan University College of Public Health, Room 733, #17 Syujhou Road, Taipei 10055, Taiwan. Tel.: +886-2-2358 2402
Fax: +886-2-2358-2402 E-mail: [email protected]
Short title: Phthalate exposure and atopic disorders
Abbreviations: AD, atopic dermatitis; IgE, immunoglobulin E; BBzP, butyl benzyl
phthalate; DBP, dibutyl phthalate; DEP, diethylphthalate; DEHP, di(2-ethylhexyl) phthalate; GM, geometric mean; MBP, monobutyl phthalate; MBzP, monobenzyl phthalate; MEHP, mono(2-ethylhexyl) phthalate; MEP, monoethyl phthalate.
1 2 3 4 5 6 7 8 9 10 11 12 13 14 15 16 17 18 19 20 21 22 23 24 25 26 27 28 29 30 31 32 33
ABSTRACT
The role of phthalate exposure at different stages in the immune system and atopic disorders is not well-known. This study aims to evaluate the effects of prenatal and postnatal phthalate exposures on immunoglobulin E (IgE) levels and atopic dermatitis (AD) in children by objective biomarkers. We conducted a prospective Taiwan Birth Panel cohort study with 483 mother/infant pairs. Finally, 161 urine specimens at 3rd trimester of pregnancy, 219 urine specimens from children at age 2, and 192 urine specimens at age 5 were analyzed after excluding missing data and loss to follow-up. Urine monoethyl phthalate (MEP), monobutyl phthalate (MBP), monobenzyl phthalate (MBzP), and mono-(2-ethylhexyl) phthalate (MEHP) at 3rd trimester of pregnancy and at ages 2 and 5 were measured by ultra-performance liquid chromatography coupled with tandem mass spectrometry. At ages 2 and 5, information on the development of AD and serum total IgE were collected. The
association between urine phthalate metabolites levels at different stages and serum IgE and AD were evaluated by multivariate linear regression and logistic regression. Urine phthalate metabolites levels were higher at age 2 than those at pregnancy and age 5. At each period, urine MBP levels were higher than MEP, MEHP, and MBzP. MEHP levels at age 2 positively correlated with serum IgE levels (per ln-unit: β=0.191, p=0.02). Analyses stratified by gender revealed that MEHP levels positively correlated with serum IgE levels only in boys (per ln-unit: β=0.256, p=0.03). When dividing into quartiles, urine MBzP levels at age 2 had a significant association with AD. We found no statistically significant
association of other phthalate metabolites with IgE and AD. Early life phthalate exposure may increase the risk of allergic sensitization and atopic disorders.
Keywords: MEHP, MBzP, IgE, Atopic dermatitis, Cohort study 1 2 3 4 5 6 7 8 9 10 11 12 13 14 15 16 17 18 19 20 21 22 23 24
1. Introduction
There have been concerns over the possible health effects of phthalates for many years but public awareness has been relatively limited until 2011, when Taiwan health officials found diethylhexyl phthalate (DEHP) in an emulsifier that had been commonly used in sport drinks. DEHP has been detected in numerous food and drinks that unknowingly used the tainted ingredient (Wu et al., 2012). This contaminated food event caused shock and panic among the general public. It has also attracted international attention for its long term health impact on young children since children are easily vulnerable to toxic chemicals due to the immaturity of their organs.
Phthalates, a kind of endocrine disrupters, are used as plasticizers in the manufacture of poly vinyl chlorides (PVC). Phthalates are widely used in our daily lives, such as food wrappings, toys, PVC flooring, building materials, cosmetics, plasticware, medical devices, and emulsifying agents (Berman et al., 2009). In addition, it has been reported that use of personal care products such as lotion and shampoo, were associated with increased urine concentrations of phthalate metabolites (Berman et al., 2009). The most widely used phthalate have been DEHP, dibutyl phthalate (DBP), butyl benzyl phthalate (BBzP), and diethylphthalate (DEP). Of these, DEHP was probably the most commonly used.
Phthalates are commonly found in foods and household dust. Because phthalate plasticizers are not chemically bound to PVC, they can easily leach and evaporate into food or the atmosphere (Heudorf et al., 2007). So, children can ingest phthalates not only from food but also by breathing and through the skin. Of note, recent human biomonitoring data shows that the tolerable intake of children is exceeded to a considerable degree (Heudorf et al., 2007; Wittassek et al., 2011). While phthalates are not bio-accumulative, the continuous daily exposure leads to an exposure scenario that is similar to persistent and bioaccumulative compounds. Even though they have relatively short half-lives, phthalates have been 1 2 3 4 5 6 7 8 9 10 11 12 13 14 15 16 17 18 19 20 21 22 23 24 25
associated with many serious health problems, including endocrine disruption, reproductive and developmental toxicity, and respiratory allergy (Huang et al., 2007; Jurewicz et al., 2011).
Epidemiological studies have revealed a positive association between DEHP exposure and asthma prevalence in children, but most evidence was limited by imprecise data on levels of exposure (Bornehag et al., 2010; Kimber et al., 2010). Moreover, many toxicology studies are done only on animals without involving real life exposure (Larsen et al., 2001). The lack of objective exposure assessments in the early life limits the interpretation. Since most previous studies were carried out by cross sectional design without a causal link, we conducted a birth cohort study to address the effect of early life phthalates exposure on the development of atopic disorders and the IgE-sensitization by objective biomarkers.
1 2 3 4 5 6 7 8 9 10 11
2. Methods and materials
2.1. Study population
Considering potential environmental exposures and nation-wide representativeness, we recruited our subjects from medical centers, regional hospitals, local hospitals, and clinics in Taiwan in 2004. Pregnant women during their 3rd trimester of pregnancy who had prenatal examination in selected hospitals were invited to join. Cord blood was collected at delivery. A total of 483 mother and child pairs were recruited. Children were followed from
pregnancy through to age 5. Finally, 161 urine specimens at 3rd trimester of pregnancy, 219 urine specimens from children at age 2, and 192 urine specimens at age 5 were analyzed after excluding missing data and loss to follow-up. The study protocol was as described previously in the Taiwan Birth Panel cohort study and was approved by the Joint Institution Review Board in Taiwan. All study subjects provided informed consent (Wang et al., 2008). Cases of AD were defined by the International Study of Asthma and Allergies in Childhood (ISAAC) questionnaire through three questions: “Has your child ever had an itchy rash which was coming and going for at least six months?”, and among those who responded positively “Has your child had this itchy rash at any time in the last 12 months?” and “Has your child ever had AD diagnosed by a doctor?”. A dermatologist examined a sub-group of the participating young children and the combination of answers that resulted in the highest sum of sensitivity and specificity was determined (Chan et al., 2001; Benn et al., 2003). Exclusion criteria included multiple gestation, inability to answer questions in Chinese, and plans to move out of the area before delivery.
At ages 2 and 5 years, information on the development of AD was collected and total IgE levels were determined as an indicator of sensitization. The concentrations of urine phthalate metabolites from the mother at 3rd trimester of pregnancy and from children at ages 2 and 5 were all measured. We compared the concentrations of AD subjects cases and 1 2 3 4 5 6 7 8 9 10 11 12 13 14 15 16 17 18 19 20 21 22 23 24 25
were compared with those of non-AD subjects.
2.2. Questionnaire survey
The parents were asked by home interview questionnaires for basic demographics, parental history of allergic diseases, alcohol and drug use, diets and supplements use, and smoke exposure during pregnancy. From records of the cooperating hospitals, the neonate’s health data at birth, including head circumference, birth body weight, height, weeks of gestation, and type of delivery, were obtained. At ages 2 and 5, the ISAAC questionnaires were performed and post-natal exposures like duration of breast feeding, number of older siblings, furry pets, carpets, or incensing at home, fungi at house walls, and tobacco smoke exposure were evaluated.
2.3. Laboratory method 2.3.1. IgE antibody analysis
Cord blood serum IgE levels and serum total IgE concentrations at 2 years of age were determined using the CAP assay according to the manufacturers' instructions (Pharmacia CAP SystemTM, Pharmacia and Upjohn Diagnostics AB, Uppsala, Sweden). The positive cut-off for the specific IgE assays was 0.35 kU/L and was calibrated against the World Health Organization standard 75/502 for IgE in the range 0.35-100 kU/L. IgE levels were considered increased at values >100 kU/L (Liu et al. 2003).
2.3.2. Measurement of phthalate metabolites concentrations
Urine samples were collected in the morning at 3rd trimester of pregnancy and at ages 2 and 5 and stored at -20oC until analysis. Four phthalate metabolites (monoethyl phthalate (MEP), monobutyl phthalate (MBP), monobenzyl phthalate (MBzP), and mono-(2-ethylhexyl) ph-1 2 3 4 5 6 7 8 9 10 11 12 13 14 15 16 17 18 19 20 21 22 23 24 25
thalate (MEHP)) representing the exposure to four commonly used phthalates (DEP, DBP, BBzP, and DEHP) were measured by ultra-performance liquid chromatography coupled with tandem mass spectrometry (UPLC-MS/MS), as described previously (Silva et al., 2004a). In brief, 1 mL of urine sample was added with 250 μL of ammonium acetate buffer (pH= 6.5). Then, 20 μL of 20µg/L internal standard solution (MEP-13C
4, MBP-13C4, MBzP-13C
4, and MEHP-13C4) and 5μL β-glucuronidase enzyme (200 Unit/mL) were added to each
sample. After enzymatic hydrolysis, samples were acidified with 1 mL of phosphate buffer (pH = 2). Then sample was extracted by solid-phase extraction using Oasis hydrophilic lipophilic balance (HLB). The recoveries of phthalate metabolites spiked into artificial urine ranged from 93% to 102%. The limits of detection for MEP, MBP, MBzP, and MEHP were 0.5, 0.1, 0.1, and 0.1 µg/L, respectively. For concentrations below the detection limits, a value of half thelower limit of quantitation was assigned. Concentrations of MEP, MBP, MBzP, and MEHP were detected in almost all urine samples (96 to100%). All results in-volved duplicate analysis. Urine creatinine levels were analyzed by enzymatic assay accord-ing to the manufacturers' instructions (Cayman Chemical, Ann Arbor, MI) (Cayman Chemi-cal Company, 2012). All phthalate metabolites concentrations were adjusted for urine creati-nine levels and expressed as μg/g creaticreati-nine.
2.4. Statistical analysis
Socio-demographic data of children were compared in terms of urine phthalate metabolites levels using the geometric mean with standard error. Because of the skewed distributions, blood IgE and urine phthalate metabolite levels were log (Ln)-transformed before further analyses. All log-transformed data in the study had a normal distribution and no significant outliers were found. Linear regression was performed to estimate the relationship between log-blood IgE and a unit increase in log-phthalate metabolite 1 2 3 4 5 6 7 8 9 10 11 12 13 14 15 16 17 18 19 20 21 22 23 24 25
concentrations. Urine phthalate metabolite levels were further analyzed as categorical variables after division into quartiles, with the lowest quartile used as the reference category.
The association between urine phthalate metabolites at different stages and AD were analyzed by univariate and multivariate logistic regression. Potential confounders from a review of the related literature, including infant gender, gestational age, parity, maternal age, education, and occupation, diets and supplements during pregnancy, family income, parental atopy, duration of breast feeding, tobacco smoke exposure, incensing and carpets at home, and fungi on house walls were all taken into consideration (Moore et al., 2004; Wang et al., 2007). Only those with a 10% change in point estimate were included in the final model (Maldonado et al., 1993) . All hypothesis testing was two-sided at the significance level of 0.05 and performed with the SAS software version 9.1 (SAS Institute, Inc., Cary, NC). 1 2 3 4 5 6 7 8 9 10 11
3. Results
The data of basic demographics of the study population was provided in Table 1. There was no significant difference in the demographic data between those who lost to follow-up and those who completed follow-up. There were 17.4% of the children with AD at age 2 and 15.7% at age 5. The geometric mean (standard error (s.e.)) of IgE level at age 2 were 29.92 ± 1.09 (kU/L). The geometric means (s.e.) of MEP, MBP, MBzP, and MEHP concentrations were 19.71 (1.09), 64.62 (1.06), 1.84 (1.11), and 16.01 (1.12) µg/g creatinine at 3rd
trimester of pregnancy, 39.74 (1.09), 152.92 (1.05), 3.76 (1.10), and 34.60 (2.18) µg/g creatinine at age 2, and 23.07 (1.09), 57.29 (1.05), 3.46 (1.08), and 14.74 (1.06) µg/g creatinine at age 5. Figure 1 showed the urine phthalate metabolites concentrations at different stages . A statistically significant difference was noted over MEP, MBP, and MEHP at different stages (Figure 1). Urine MEP, MBP, MBzP, and MEHP levels were higher at age 2 than those at pregnancy and age 5. At each period, urine MBP levels were higher than MEP, MEHP, and MBzP levels. The correlation coefficients of phthalate metabolites levels at different time points were not statistically significant (Table S4).
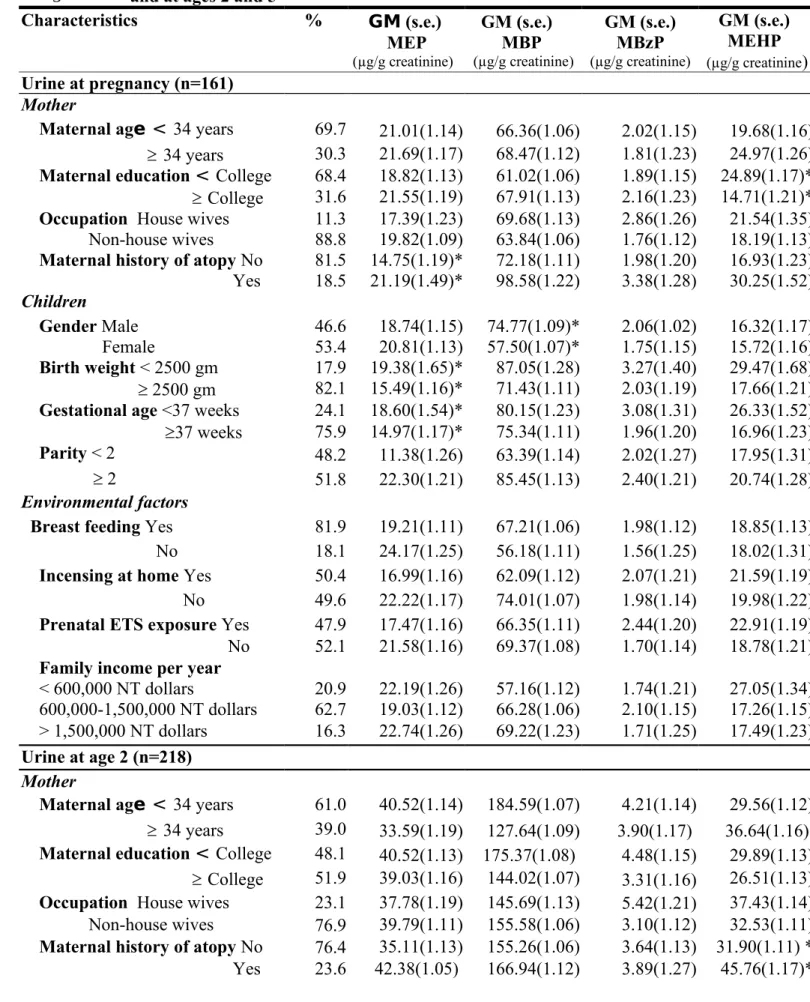
A summary of geometric means of different urine phthalate metabolites concentrations at three stages in relation to the characteristics of mothers and children was outlined in Table 2. Boys showed higher maternal urine MBP levels and MEHP levels at age 2 than girls. Gestational age lower than 37 weeks and lower birth weight were associated with higher MEP levels at three stages. Moreover, lower maternal education was associated with higher MEHP levels at pregnancy and MEP levels at age 5. Maternal history of atopy was associated with higher MEP levels at pregnancy and MEHP levels at age 2. Other demographic characteristics, such as maternal age, occupation, parity, breast feeding, and family income were not significantly associated with urine phthalate concentrations.
The regression coefficients β (s.e.) for log-cord blood IgE and log-blood total IgE at age 1 2 3 4 5 6 7 8 9 10 11 12 13 14 15 16 17 18 19 20 21 22 23 24 25
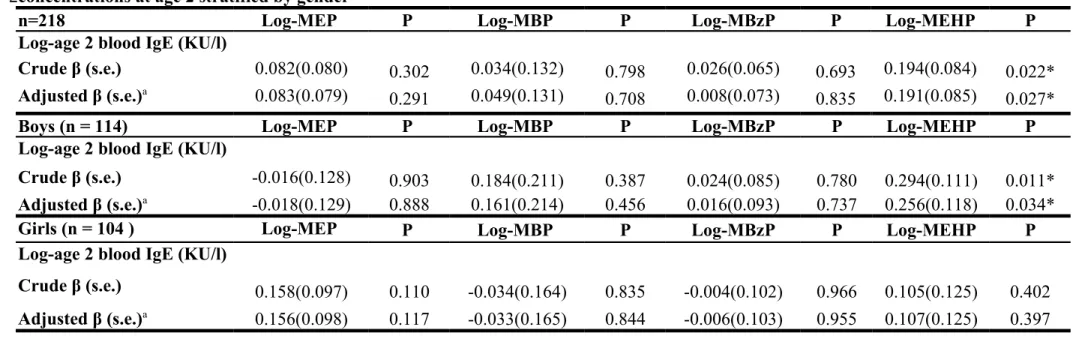
2 according to log-urine phthalate metabolite concentrations at pregnancy and the regression coefficients β (s.e.) for log-total IgE at age 2 according to log-urine phthalate metabolite concentrations at age 2 were shown in Table S1 and Table 3. There was no significant correlation between phthalate metabolite concentrations at pregnancy and cord blood IgE levels and IgE levels at age 2. However, MEHP levels at age 2 positively correlated with blood IgE levels at age 2 (per ln-unit: β=0.191, p=0.02) even after adjusting for potential confounders.
Analyses stratified by gender was further performed (Table S1, Table 3). There was still no significant correlation between urine phthalate metabolite concentrations at pregnancy and blood total IgE levels. However, there was a significantly positive correlation between MEHP levels at age 2 and blood IgE levels at age 2 in boys (per ln-unit: β=0.256, p=0.03). There was no association in girls.
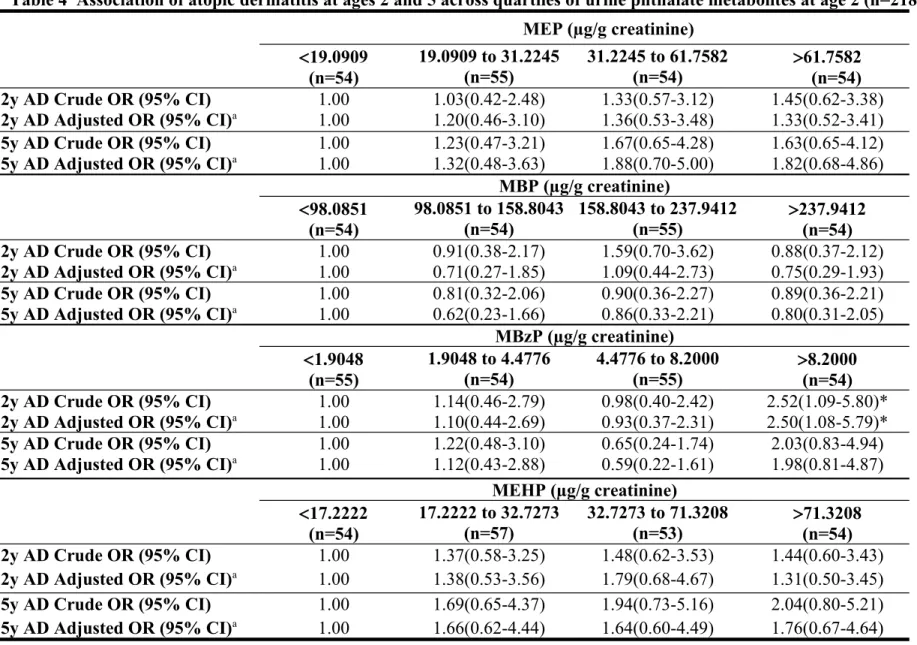
Table S2 presented the association of AD at ages 2 and 5 across quartiles of urine phthalate metabolites at pregnancy by univariate and multivariate logistic regression. There was no significant correlation between urine phthalate metabolite concentrations at pregnancy and AD. Table 4 showed the association of AD at ages 2 and 5 and phthalate metabolites at age 2. When dividing urine phthalate metabolites into quartiles, AD at age 2 was significantly associated with MBzP at a concentration >8.20 µg/g creatinine (adjusted OR 2.50, 95%CI 1.08-5.79). Table S3 presented the association of AD at age 5 and phthalate metabolites at age 5. We failed to find a statistically significant association of MBzP with AD after controlling for confounders. There was no significant relationship between other phthalate metabolites and AD.
1 2 3 4 5 6 7 8 9 10 11 12 13 14 15 16 17 18 19 20 21 22
4. Discussion
This study contributes to the literature on the potential association between phthalate exposure at different stages and pediatric atopy. We found that MEHP levels at age 2 positively correlated with serum IgE levels, particularly in boys. Urine MBzP at age 2 had significant association with AD. These findings not only help understand the etiology of allergic diseases, but also guide potential control measures for a susceptible population.
In this study, there was a positive correlation between MEHP levels and serum IgE levels. MEHP, one metabolite of DEHP, was found to increase IgE levels in a subcutaneous injection mouse model (Larsen et al., 2001). Dietary exposure of rats to DEHP was also found to alter the balance of Th1/Th2 cytokines towards a preferential Th2 phenotype. It is reported that DEHP exposure may up-regulate thymic stromal lymphopoitin (TSLP) protein expression, and TSLP may up-regulate IgE expression (Guo et al., 2012; Nagata et al., 2007). Thus, our study demonstrated that some of the pathology of allergic diseases could be contributed to phthalate exposure.
Interestingly, urine MBzP at age 2 had significant association with AD. Consistent with our study, it has been reported that phthalate can aggravate AD-like skin lesions induced by Dermatophagoides pteronyssinus in mice (Takano et al., 2006). Takano et al. found that mice intraperitoneal exposure to phthalates exacerbated AD skin lesions induced by intradermal injection of mite allergen (Takano et al., 2006). Furthermore, the same group reported that maternal exposure to phthalates during neonatal periods, but not during fetal periods, enhanced AD-like skin lesions related to mite allergen via Th2-dominant responses (Yanagisawa et al., 2008). Consistent human findings were reported in a case-control study in Bulgaria (Kolarik et al., 2008). BBzP concentrations were higher in the house dust of children age 2-7 years with wheezing, rhinitis, or AD in the preceding 12 months. A Swedish case-control study found the risk of allergic rhinitis and AD was related to the 1 2 3 4 5 6 7 8 9 10 11 12 13 14 15 16 17 18 19 20 21 22 23 24 25
house-dust BBzP concentrations (Huang et al., 2009). Above findings indicated that early life phthalate exposure plays an important role in later susceptibility to allergic diseases. Though we failed to demonstrate a statistical significance for the maternal urine phthalate metabolites, the odds ratio was high. Future large-scale studies are warranted to elucidate if there is any relationship.
We failed to find consistent associations of different phthalate metabolites with IgE and AD. One possible explanation was the different molecular weight. High-molecular-weight phthalates, such as DEHP, is found to be related with IgE sensitization (Heudorf et al., 2007). Low-molecular-weight phthalates, such as BBzP, DEP, and DBP, may be dermally absorbed and may cause hypersensitivity via non-IgE-mediated pathway (Heudorf et al., 2007). On the other hand, it is suggested that the biological effects of phthalates are different depending on presence or absence of an antigen such as ovalbumin (OVA) (Guo et al., 2012).With OVA co-exposure, phthalates were a strong agent to promote Th2-related immune responses and to stimulate the body to produce IgE (Type I, IgE-mediated
hypersensitivity); but without OVA co-exposure, phthalates become a weak agent for TH1 cell-induced chronic inflammation (Type IV, delayed-type hypersensitivity). These
phenomena can be explained by an adjuvant effect. Therefore, the health effect and immune response may vary with different kinds of phthalates exposure and the presence of allergens co-exposure (Guo et al., 2012).
Similar to an earlier German Environmental Survey on children, our results indicated that boys had higher average concentrations of MEHP than girls (Becker et al., 2004). Moreover, analyses stratified by gender revealed that MEHP levels positively correlated with serum IgE levels only in boys in our study (Table 3). In accordance with ours, Andrade et al. also demonstrated the existence of gender differences in the susceptibility to DEHP (Andrade et al., 2006). Prior studies are extremely limited about the gender-related influence 1 2 3 4 5 6 7 8 9 10 11 12 13 14 15 16 17 18 19 20 21 22 23 24 25
on phthalate exposure and atopy. Only one animal study reported that maternal exposure to DEHP aggravated AD-like skin lesions in mite allergen-sensitized male offspring (Yanagisawa et al., 2008). However, the effects were not replicated in female offspring, suggesting hormone-mediated processes in phthalate-induced allergic immune responses. In this study, urine phthalate metabolites levels were significantly higher at age 2 than those at pregnancy and age 5. Urine MBzP at ages 2 had a significant association with AD. Meeker et al. reported that phthalate metabolite levels were higher in post-natal than pre-natal samples (Meeker et al., 2009). Lin et al. also found that total urinary phthalate metabolite concentration was higher in 2-and 5-years-olds than pregnant women (Lin et al., 2007). In general, children showed higher urinary phthalate metabolite concentration than adults (Becker et al. 2009). Toddlers are at the greatest risk of exposure, because of their mouthing behavior and their crawling on the flooring. Moreover, increased dosage per unit body surface area, increase metabolic capabilities, and immature renal function in young children may also account for this finding.
Of note, we found urine MBP levels were higher than MEP, MEHP, and MBzP at each stage. Compared to children in the United States, our subjects had higher levels of MBP (Lin et al., 2007; CDC, 2009). Levels of MEHP were also higher in Taiwanese children
compared to the US and German children, which might be due to the contaminated food event (Becker et al., 2009; CDC, 2009; Koch et al., 2007; Silva et al., 2004b). In contrast, levels of MEP and MBzP in Taiwanese children were much lower than the US and German children. Since MBzP levels in the children in our study were close to levels measured in a previous study (Huang et al., 2007), it implicated a consistently low level of BBzP in Taiwan. Different geographic areas, life style, dietary habits, different exposure routes, duration, concentrations, and different rates of metabolism may account for these inconsistencies. 1 2 3 4 5 6 7 8 9 10 11 12 13 14 15 16 17 18 19 20 21 22 23 24 25
There are some potential limitations to this study and results should be cautiously interpreted. First, our study was limited by the use of questionnaires that were utilized to ascertain AD, which may not be as accurate as the standard diagnostic criteria used by a dermatologist. Nevertheless, ISAAC questionnaires have been validated versus clinical examinations in studies performed in the United States, Brazil, and Korea, and have been used by many epidemiological studies (Agostino et al., 2010; Benn et al., 2003; Brunekreef et al., 2012; Choi et al., 2012; Wang et al., 2007).Second, potential selection bias could have occurred when non-participants differ in socio-demographics or smoking status from
participants. However, the statistics of those lost in the follow-up and in those who
completed the follow-up were not significantly different. Therefore, a selection bias would be trivial even if there is one. Finally, the statistical analysis was calculated in a cross-sectional and not in a longitudinal manner. However, we can evaluate the phthalate effect at different time points and search for the critical window of exposure by this manner.
The population based prospective cohort design and exposure assessment of objective biomarkers at different stages were the strengths of this study. The advantage of conducting a prospective cohort design is that causality can be established. In addition, cohort studies may offer further insight into the timing of exposure relative to disease onset and minimize recall bias. Instead of maternal self-reporting of relevant information, perinatal information like birth weight and gestational age were collected from medical records, adding data reliability. The concentration of phthalates might change with age and different conditions because of their short half-life and rapid excretion within hours of consumption of food. Braun et al. (2012) analyzed intra-correlation coefficients (ICC) of phthalate metabolites repeatedly measured during pregnancy. They report that more than one urine sample may be necessary for MBzP and DEHP because of their low ICC. Exposure measurements by following-up a child’s urine specimens at different periods in our study may reduce potential confounders, 1 2 3 4 5 6 7 8 9 10 11 12 13 14 15 16 17 18 19 20 21 22 23 24 25
increase power, and give the chance looking at exposure levels more in depth. The use of urine biomarkers offered a more direct measure of individual exposure than house dust by integrating ingestion, inhalation, and dermal absorption. Moreover, urine phthalate metabolites were analyzed by UPLC-MS/MS with good validity. Therefore, the exposure assessment is reliable. 1 2 3 4 5
5. Conclusion
Early life phthalate exposure, especially before 2 years of age, may increase the risk of allergic sensitization and atopic disorders. Preventive measures should be introduced as early as possible for young children to avoid subsequent development of allergic diseases. Making rapid economic growth the first priority often compromises environmental safety and public health. It is important for governments to implement national standards that are in the best interests and protect the health of children.
Acknowledgments
This study was supported in part by a grant # NSC 101-2314-B-192 -001 from the National Science Council and NTUH-UN101-044 in Taiwan.
1 2 3 4 5 6 7 8 9 10 11 12
References
Andrade AJ, Grande SW, Talsness CE, Grote K, Chahoud I. A dose-response study
following in utero and lactational exposure to di-(2-ethylhexyl)-phthalate (DEHP): non-monotonic dose-response and low dose effects on rat brain aromatase activity.
Toxicology 2006;227:185-92.
Becker K, Seiwert M, Angerer J, Heger W, Koch HM, Nagorka R. DEHP metabolites in urine of children and DEHP in house dust. Int J Hyg Environ Health 2004;207:409-17. Becker K, Göen T, Seiwert M, Conrad A, Pick-Fuss H, Müller J, et al. GerES IV: phthalate
metabolites and bisphenol A in urine of German children . Int J Hyg Environ Health 2009;212:685-92.
Benn CS, Benfeldt E, Andersen PK, Olesen AB, Melbye M, Björkstén B. Atopic dermatitis in
young children: diagnostic criteria for use in epidemiological studies based on telephone interviews. Acta Derm Venereo 2003;83:347-50.
Berman T, Hochner-Celnikier D, Calafat AM, Needham LL, Amitai Y, Wormser U, et al. Phthalate exposure among pregnant women in Jerusalem, Israel: results of a pilot study. Environ Int 2009;35:353-37.
Bornehag CG, Nanberg E. Phthalate exposure and asthma in children. Int J Androl 2010;33:333-45.
Braun JM, Smith KW, Williams PL, Calafat AM, Berry K, Ehrlich S, et al. Variability of urinary phthalate metabolite and bisphenol A concentrations before and during pregnancy. Environ Health Perspect 2012;120:739-45.
Brunekreef B, Von Mutius E, Wong G, Odhiambo J, García-Marcos L, Foliaki S; ISAAC Phase Three Study Group. Exposure to cats and dogs, and symptoms of asthma, rhinoconjunctivitis, and eczema. Epidemiology 2012;23:742-50.
1 2 3 4 5 6 7 8 9 10 11 12 13 14 15 16 17 18 19 20 21 22 23 24 25
Cayman Chemical Company. Creatinine (urinary) Assay Kit. 2012. Available at: https://www.caymanchem.com/pdfs/500701.pdf (accessed on 3 May 2012).
CDC. Fourth National Report on Human Exposure to Environmental Chemicals, Atlanta, GA, Centers for Disease Control and Prevention; 2009. Available at:
http://www.cdc.gov/exposurereport/pdf/fourthreport.pdf (accessed on 15 May 2012).
Chan HH, Pei A,Van Krevel C,Wong GW, Lai CK. Validation of the Chinese translated version of ISAAC core questions for atopic eczema. Clin Exp Allergy 2001;31:903-07. Choi WJ, Ko JY, Kim JW, Lee KH, Park CW, Kim KH, et al. Prevalence and risk factors
for atopic dermatitis: a cross-sectional study of 6,453 Korean preschool children. Acta Derm Venereol 2012;92:467-71.
Guo J,Han B,Qin L,Li B,You H,Yang J, et al. Pulmonary Toxicity and Adjuvant Effect of 2929Di-(2-exylhexyl) Phthalate in Ovalbumin-Immunized BALB/c Mice. PLoS One 2012;7:e39008.
Heudorf U, Mersch-Sundermann V, Angerer J. Phthalates: toxicology and exposure. Int J Hyg
Environ Health 2007; 210:623-34.
Huang PC, Kuo PL, Chou YY, Lin SJ, Lee CC. Association between prenatal exposure to phthalates and the health of newborns. Environ Int 2009;35:14-20.
Jurewicz J, Hanke W. Exposure to phthalates: reproductive outcome and children health. A review of epidemiological studies. Int J Occup Med Environ Health 2011;24:115-41. Kimber I, Dearmna RJ. An assessment of the ability of phthalates to influence immune and
allergic responses. Toxicology 2010;271:73-82.
Koch HM, Becker K, Wittassek M, Seiwert M, Angerer J, Kolossa- Gehring M.
Di-n-butylphthalate and butylbenzylphthalate- urinary metabolite levels and estimated 1 2 3 4 5 6 7 8 9 10 11 12 13 14 15 16 17 18 19 20 21 22 23 24 25
daily intakes: pilot study for the German Environmental Survey on children. J Expo Sci Environ Epidemiol 2007;17:378-87.
Kolarik B, Naydenov K, Larsson M, Bornehag CG, Sundell J. The association between ph-thalates in dust and allergic diseases among Bulgarian children. Environ Health Perspect 2008:116:98–103.
Larsen ST, Hansen JS, Thygesen P, Begtrup M, Poulsen OM, Nielsen GD. Adjuvant and immuno-suppressive effect of six monophthalates in a subcutaneous injection model with BALB/c mice. Toxicology 2001;169:37-51.
Lin S, Ku HY, Su PH, Chen JW, Huang PC, Angerer J, et al. Phthalate exposure in pregnant women and their children in central Taiwan. Chemosphere 2007;82:947-55.
Liu CA, Wang CL, Chuang H, Ou CY, Hsu TY, Yang KD. Prediction of elevated cord blood IgE levels by maternal IgE levels, and the neonate's gender and gestational age.
Chang Gung Med J 2003;26:561-9.
Maldonado G, Greenland S. Simulation study of confounder-selection strategies.Am J
Epidemiol 1993;138:923-36.
Meeker JD, Sathyanarayana S, Swan SH. Phthalates and other additives in plastics: human exposure and associated health outcomes. Philos Trans R Soc Lond B Biol Sci
2009;364:2097-13.
Monfort N, Ventura R, Balcells G, Segura J. Determination of five
di-(2-ethylhexyl)phthalate metabolites in urine by UPLC-MS/MS, markers of blood transfusion misuse in sports. J Chromatogr B Analyt Technol Biomed Life Sci 2012; 908:113-21.
Moore MM, Rifas-Shiman SL, Rich-Edwards JW, Kleinman KP, Camargo CA Jr, Gold DR,
et al. Perinatal predictors of atopic dermatitis occurring in the first six months of life. Pediatrics 2004;113:468-74. 1 2 3 4 5 6 7 8 9 10 11 12 13 14 15 16 17 18 19 20 21 22 23 24 25
Nagata Y, Kamijuku H, Taniguchi M, Ziegler S, Seino K. Differential role of thymus
stromal
lymphopoietin in the induction of airway hyperreactivity and Th2 immune response in antigen-induced asthma with respect to natural killer T cell function. Int Arch Allergy Immunol 2007;144:305-14.
Silva MJ, Slakman AR, Reidy JA, Preau JL, Jr Herbert AR, Samandar E, et al. Analysis of human urine for fifteen phthalate metabolites using automated solid-phase extraction. J Chromatogr B 2004a;805,161-7.
Silva MJ, Barr DB, Reidy JA, Malek NA, Hodge CC, Caudill SP, et al. Urinary levels of seven phthalate metabolites in the US population from the National Health and Nutrition Examination Survey (NHANES) 1999–2000. Environ Health Perspect 2004b;112:331-8.
Takano H,Yanagisawa R, Inoue K, Ichinose T, Sadakane K,Yoshikawa T. Di-(2-ethylhexyl) phthalate enhances atopic dermatitis-like skin lesions in mice. Environ Health Perspect 2006;14:1266-9.
Wang IJ, Hsieh WS, Guo YL, Jee SH, Hsieh CJ, Hwang YH, et al. Neuro-mediators as predictors of paediatric atopic dermatitis. Clin Exp Allergy 2008;38,1302-8.
Wang IJ, Guo YL,Weng HJ, Hsieh WS,Chuang YL, Lin SJ, et al. Environmental risk factors for early infantile atopic dermatitis. Pediatr Allergy Immunol 2007;18:441-7. Wittassek M, Koch HM, Angerer J, Brüning T. Assessing exposure to phthalates - the
human biomonitoring approach. Mol Nutr Food Res 2011;55:7-31.
Wu MT,Wu CF,Wu JR,Chen BH,Chen EK,Chao MC, et al. The public health threat of phthalate-tainted foodstuffs in Taiwan: the policies the government implemented and the lessons we learned. Environ Int 2012;44:75-9.
Yanagisawa R,Takano H,Inoue K,Koike E,Sadakane K,Ichinose T. Effects of maternal exposure to di-(2-ethylhexyl) phthalate during fetal and/or neonatal periods on atopic 1 2 3 4 5 6 7 8 9 10 11 12 13 14 15 16 17 18 19 20 21 22 23 24 25
dermatitis in male offspring. Environ Health Perspect 2008;116:1136-41.
Zeng HX,Cheng G, Pan WS, Zhong GP, Huang M. Preparation of codeine-resinate and
hlorpheniramine-resinate sustained-release suspension and its pharmacokinetic evaluation in beagle dogs. Drug Dev Ind Pharm 2007;33:649-65.
1 2 3 4
Table 1 Comparison of basic demographics of the study population at 3rd trimester of pregnancy and at ages 2 and 5
Characteristics Total cohort
(N=483) Pregnancy (N=161) Age 2 (N=218) Age 5 (N=191) P value Mother
Maternal age≧34 years (%) 37.5 30.3 39.0 37.2 0.27
Maternal education≧College (%) 46.7 47.0 51.9 54.2 0.42
Occupation (Non-house wives)(%) 84.5 88.8 81.4 86.2 0.12
Maternal history of atopy Yes (%)
22.1 18.5 23.6 20.7 0.66
Children
Gender Male (%) 50.5 46.6 52.3 51.8 0.49
Birth weight < 2500 gm (%) 12.6 17.9 11.6 11.4 0.40
Gestational age <37 weeks (%) 17.4 24.1 17.1 13.9 0.21
Parity < 2 (%) 40.2 48.2 38.4 38.3 0.37
Environmental factors
Breast feeding Yes (%) 19.8 18.1 20.6 26.5 0.14
Incensing at home Yes (%) 45.7 50.4 50.8 45.2 0.52
Prenatal ETS exposure Yes (%) 37.3 42.0 38.7 33.1 0.28
Family income per year >1,500,000 (NT dollars) (%)
18.7 16.3 17.7 20.2 0.57
Abbreviations: ETS, environmental tobacco smoke; NT, New Taiwan dollars 1
2
Table 2 Basic demographics of the study population in terms of geometric means (s.e.) of urine phthalate metabolites concentrations at 3rd trimester of pregnancy and at ages 2 and 5
Characteristics % GM (s.e.) MEP (µg/g creatinine) GM (s.e.) MBP (µg/g creatinine) GM (s.e.) MBzP (µg/g creatinine) GM (s.e.) MEHP (µg/g creatinine) Urine at pregnancy (n=161) Mother
Maternal age < 34 years 69.7 21.01(1.14) 66.36(1.06) 2.02(1.15) 19.68(1.16) 34 years 30.3 21.69(1.17) 68.47(1.12) 1.81(1.23) 24.97(1.26) Maternal education < College 68.4 18.82(1.13) 61.02(1.06) 1.89(1.15) 24.89(1.17)* College 31.6 21.55(1.19) 67.91(1.13) 2.16(1.23) 14.71(1.21)* Occupation House wives 11.3 17.39(1.23) 69.68(1.13) 2.86(1.26) 21.54(1.35) Non-house wives 88.8 19.82(1.09) 63.84(1.06) 1.76(1.12) 18.19(1.13) Maternal history of atopy No 81.5 14.75(1.19)* 72.18(1.11) 1.98(1.20) 16.93(1.23) Yes 18.5 21.19(1.49)* 98.58(1.22) 3.38(1.28) 30.25(1.52) Children Gender Male 46.6 18.74(1.15) 74.77(1.09)* 2.06(1.02) 16.32(1.17) Female 53.4 20.81(1.13) 57.50(1.07)* 1.75(1.15) 15.72(1.16) Birth weight < 2500 gm 17.9 19.38(1.65)* 87.05(1.28) 3.27(1.40) 29.47(1.68) 2500 gm 82.1 15.49(1.16)* 71.43(1.11) 2.03(1.19) 17.66(1.21) Gestational age <37 weeks 24.1 18.60(1.54)* 80.15(1.23) 3.08(1.31) 26.33(1.52) 37 weeks 75.9 14.97(1.17)* 75.34(1.11) 1.96(1.20) 16.96(1.23) Parity < 2 48.2 11.38(1.26) 63.39(1.14) 2.02(1.27) 17.95(1.31) 2 51.8 22.30(1.21) 85.45(1.13) 2.40(1.21) 20.74(1.28)
Environmental factors
Breast feeding Yes 81.9 19.21(1.11) 67.21(1.06) 1.98(1.12) 18.85(1.13) No 18.1 24.17(1.25) 56.18(1.11) 1.56(1.25) 18.02(1.31) Incensing at home Yes 50.4 16.99(1.16) 62.09(1.12) 2.07(1.21) 21.59(1.19) No 49.6 22.22(1.17) 74.01(1.07) 1.98(1.14) 19.98(1.22) Prenatal ETS exposure Yes 47.9 17.47(1.16) 66.35(1.11) 2.44(1.20) 22.91(1.19) No 52.1 21.58(1.16) 69.37(1.08) 1.70(1.14) 18.78(1.21) Family income per year
< 600,000 NT dollars 20.9 22.19(1.26) 57.16(1.12) 1.74(1.21) 27.05(1.34) 600,000-1,500,000 NT dollars 62.7 19.03(1.12) 66.28(1.06) 2.10(1.15) 17.26(1.15) > 1,500,000 NT dollars 16.3 22.74(1.26) 69.22(1.23) 1.71(1.25) 17.49(1.23) Urine at age 2 (n=218)
Mother
Maternal age < 34 years 61.0 40.52(1.14) 184.59(1.07) 4.21(1.14) 29.56(1.12) 34 years 39.0 33.59(1.19) 127.64(1.09) 3.90(1.17) 36.64(1.16) Maternal education < College 48.1 40.52(1.13) 175.37(1.08) 4.48(1.15) 29.89(1.13) College 51.9 39.03(1.16) 144.02(1.07) 3.31(1.16) 26.51(1.13) Occupation House wives 23.1 37.78(1.19) 145.69(1.13) 5.42(1.21) 37.43(1.14) Non-house wives 76.9 39.79(1.11) 155.58(1.06) 3.10(1.12) 32.53(1.11) Maternal history of atopy No 76.4 35.11(1.13) 155.26(1.06) 3.64(1.13) 31.90(1.11) * Yes 23.6 42.38(1.05) 166.94(1.12) 3.89(1.27) 45.76(1.17)* 1
2 3
Children
Gender Male 47.7 41.93(1.12) 162.75(1.06) 3.86(1.16) 39.72(1.12)* Female 52.3 38.01(1.14) 145.49(1.08) 3.68(1.13) 30.66(1.12)* Birth weight < 2500 gm 11.6 41.75(1.27)* 162.25(1.21) 4.39(1.42) 38.12(1.20) 2500 gm 88.4 33.64(1.11)* 158.81(1.06) 3.63(1.12) 33.85(1.09) Gestational age <37 weeks 17.1 42.40(1.21)* 164.16(1.16) 3.93(1.31) 30.59(1.14) 37 weeks 82.9 34.34(1.12)* 156.81(1.06) 3.68(1.13) 35.96(1.11) Parity < 2 38.4 40.95(1.17) 157.69(1.09) 3.72(1.19) 35.81(1.13) 2 61.6 40.57(1.13) 164.49(1.07) 3.71(1.14) 33.43(1.12)
Environmental factors
Breast feeding Yes 79.4 40.40(1.11) 151.53(1.06) 3.91(1.12) 34.56(1.08) No 20.6 37.76(1.22) 161.23(1.13) 3.26(1.22) 35.19(1.25) Incensing at home Yes 50.8 40.10(1.13) 157.89(1.08) 3.07(1.15) 29.39(1.12) No 49.2 40.57(1.15) 163.91(1.07) 4.36(1.16) 29.63(1.13) Prenatal ETS exposure Yes 38.7 44.26(1.13) 158.59(1.07) 4.01(1.15) 34.72(1.11) No 61.3 37.75(1.15) 159.93(1.09) 3.43(1.17) 33.33(1.15) Family income per year
< 600,000 NT dollars 20.3 42.92(1.23) 155.92(1.12) 4.97(1.27) 32.22(1.19) 600,000-1,500,000 NT dollars 62.0 39.19(1.13) 154.39(1.07) 3.64(1.14) 37.76(1.12) > 1,500,000 NT dollars 17.7 38.34(1.19) 169.12(1.09) 3.28(1.23) 35.10(1.23) Urine at age 5 (n=191) Mother
Maternal age < 34 years 62.8 22.46(1.13) 60.41(1.08) 3.33(1.11) 14.32(1.07) 34 years 37.2 21.10(1.22) 60.36(1.11) 3.40(1.13) 15.59(1.12) Maternal education < College 45.8 26.62(1.15)* 56.42(1.09) 3.51(1.12) 13.78(1.07) College 54.2 19.51(1.14)* 58.94(1.08) 3.03(1.09) 14.26(1.08) Occupation House wives 13.8 30.07(1.26) 59.95(1.15) 3.55(1.28) 14.14(1.21) Non-house wives 86.2 21.58(1.09) 57.24(1.06) 3.37(1.08) 14.79(1.06) Maternal history of atopy No 79.3 19.80(1.09) 57.37(1.06) 4.47(1.08) 12.09(1.06) Yes 20.7 25.50(1.28) 63.14(1.13) 3.28(1.23) 14.67(1.13) Children Gender Male 51.8 21.71(1.13) 56.33(1.07) 3.46(1.09) 15.13(1.09) Female 48.2 24.13(1.14) 58.01(0.17) 3.38(1.13) 14.22(1.07) Birth weight < 2500 gm 11.4 52.93(1.34)* 70.90(1.19) 5.14(1.46) 14.23(1.16) 2500 gm 88.6 21.45(1.11)* 59.66(1.06) 3.33(1.07) 14.25(1.06) Gestational age <37 weeks 13.9 44.61(1.36)* 70.86(1.17) 5.01(1.38) 14.40(1.14) 37 weeks 86.1 22.33(1.09)* 59.83(1.06) 3.31(1.07) 14.12(1.06) Parity < 2 38.3 23.85(1.17) 61.51(1.09) 4.36(1.16) 14.48(1.09) 2 61.7 23.71(1.13) 60.43(1.07) 3.05(1.08) 14.10(1.07)
Environmental factors
Breast feeding Yes 73.5 23.47(1.11) 56.26(1.06) 3.29(1.09) 14.10(1.06) No 26.5 21.55(1.20) 60.99(1.11) 3.94(1.14) 16.10(1.12) Incensing at home Yes 45.2 28.79(1.09) 62.64(1.06) 3.61(1.13) 14.95(1.08) No 54.8 21.57(1.19) 60.13(1.11) 3.43(1.09) 13.53(1.08) Prenatal ETS exposure Yes 33.1 26.60(1.13) 65.52(1.07) 3.81(1.11) 14.37(1.07) No 66.9 23.63(1.16) 59.24(1.12) 3.36(1.16) 14.05(1.09) Family income per year
< 600,000 NT dollars 17.9 28.24(1.22) 52.82(1.15) 3.36(1.19) 11.47(1.09) 600,000-1,500,000 NT dollars 61.9 25.79(1.12) 57.17(1.07) 3.52(1.12) 16.45(1.08) > 1,500,000 NT dollars 20.2 15.99(1.28) 65.78(1.16) 3.05(1.15) 11.94(1.21)
Abbreviations: GM, geometric mean; ETS, environmental tobacco smoke; NT, New Taiwan dollars
*p<0.05 1
2 3
Table 3 Regression coefficients β (s.e.) for log-serum total IgE at 2 years of age according to log-urine phthalate metabolite concentrations at age 2 stratified by gender
n=218 Log-MEP P Log-MBP P Log-MBzP P Log-MEHP P
Log-age 2 blood IgE (KU/l)
Crude β (s.e.) 0.082(0.080) 0.302 0.034(0.132) 0.798 0.026(0.065) 0.693 0.194(0.084) 0.022* Adjusted β (s.e.)a 0.083(0.079)
0.291 0.049(0.131) 0.708 0.008(0.073) 0.835 0.191(0.085) 0.027*
Boys (n = 114) Log-MEP P Log-MBP P Log-MBzP P Log-MEHP P
Log-age 2 blood IgE (KU/l)
Crude β (s.e.) -0.016(0.128) 0.903 0.184(0.211) 0.387 0.024(0.085) 0.780 0.294(0.111) 0.011* Adjusted β (s.e.)a -0.018(0.129) 0.888 0.161(0.214) 0.456 0.016(0.093) 0.737 0.256(0.118) 0.034*
Girls (n = 104 ) Log-MEP P Log-MBP P Log-MBzP P Log-MEHP P
Log-age 2 blood IgE (KU/l)
Crude β (s.e.) 0.158(0.097) 0.110 -0.034(0.164) 0.835 -0.004(0.102) 0.966 0.105(0.125) 0.402 Adjusted β (s.e.)a 0.156(0.098) 0.117 -0.033(0.165) 0.844 -0.006(0.103) 0.955 0.107(0.125) 0.397 *p<0.05
aadjusted for gestational age, maternal education, maternal history of atopy, and pre-natal ETS exposure 1
2
3 4
Table 4 Association of atopic dermatitis at ages 2 and 5 across quartiles of urine phthalate metabolites at age 2 (n=218) MEP (µg/g creatinine) 19.0909 (n=54) 19.0909 to 31.2245 (n=55) 31.2245 to 61.7582(n=54) 61.7582(n=54) 2y AD Crude OR (95% CI) 1.00 1.03(0.42-2.48) 1.33(0.57-3.12) 1.45(0.62-3.38) 2y AD Adjusted OR (95% CI)a 1.00 1.20(0.46-3.10) 1.36(0.53-3.48) 1.33(0.52-3.41) 5y AD Crude OR (95% CI) 1.00 1.23(0.47-3.21) 1.67(0.65-4.28) 1.63(0.65-4.12) 5y AD Adjusted OR (95% CI)a 1.00 1.32(0.48-3.63) 1.88(0.70-5.00) 1.82(0.68-4.86) MBP (µg/g creatinine) 98.0851 (n=54) 98.0851 to 158.8043 (n=54) 158.8043 to 237.9412(n=55) 237.9412(n=54) 2y AD Crude OR (95% CI) 1.00 0.91(0.38-2.17) 1.59(0.70-3.62) 0.88(0.37-2.12) 2y AD Adjusted OR (95% CI)a 1.00 0.71(0.27-1.85) 1.09(0.44-2.73) 0.75(0.29-1.93) 5y AD Crude OR (95% CI) 1.00 0.81(0.32-2.06) 0.90(0.36-2.27) 0.89(0.36-2.21) 5y AD Adjusted OR (95% CI)a 1.00 0.62(0.23-1.66) 0.86(0.33-2.21) 0.80(0.31-2.05) MBzP (µg/g creatinine) 1.9048 (n=55) 1.9048 to 4.4776 (n=54) 4.4776 to 8.2000(n=55) 8.2000(n=54) 2y AD Crude OR (95% CI) 1.00 1.14(0.46-2.79) 0.98(0.40-2.42) 2.52(1.09-5.80)* 2y AD Adjusted OR (95% CI)a 1.00 1.10(0.44-2.69) 0.93(0.37-2.31) 2.50(1.08-5.79)* 5y AD Crude OR (95% CI) 1.00 1.22(0.48-3.10) 0.65(0.24-1.74) 2.03(0.83-4.94) 5y AD Adjusted OR (95% CI)a 1.00 1.12(0.43-2.88) 0.59(0.22-1.61) 1.98(0.81-4.87) MEHP (µg/g creatinine) 17.2222 (n=54) 17.2222 to 32.7273 (n=57) 32.7273 to 71.3208 (n=53) 71.3208(n=54) 2y AD Crude OR (95% CI) 1.00 1.37(0.58-3.25) 1.48(0.62-3.53) 1.44(0.60-3.43) 2y AD Adjusted OR (95% CI)a 1.00 1.38(0.53-3.56) 1.79(0.68-4.67) 1.31(0.50-3.45) 5y AD Crude OR (95% CI) 1.00 1.69(0.65-4.37) 1.94(0.73-5.16) 2.04(0.80-5.21) 5y AD Adjusted OR (95% CI)a 1.00 1.66(0.62-4.44) 1.64(0.60-4.49) 1.76(0.67-4.64) 1
*p<0.05
aadjusted for gender, gestational age, maternal education, maternal history of atopy, and pre-natal ETS exposure 1
Figure legend
Fig. 1. Urine phthalate metabolites concentrations (geometric mean) at different stages. Asterisk(*) denotes p<0.05 1 2 3 4 5