Taipei Medical University
C
ardiothoracic
R
atio
A
ssociation
w
ith
N
utritional
S
tatus
i
n
H
emodialysis
P
atients
I
ntroduction
The cardiothoracic ratio (CTR) is determined by dividing the maximal horizontal width of the heart by the
horizontal inner width of the rib cage. It’s an easy parameter available from chest
radiographs. The CTR independently correlates with the left ventricular mass (LVM) and nutritional status.
O
bjective
S
ubjects and Methods
R
esults and Discussion
C
onclusion
Chen CY
1, Yang SH
2, Wu PY
3, Yang SH
1,41.2.3School of Nutrition and Health Sciences, Taipei Medical University 4Nutrition research center, Taipei Medical University Hospital
To evaluate whether CTR is a good indicator of nutritional status on hemodialysis (HD) patients or not?
All study patients were recruited from the HD centers at the Taipei Medical University Hospital. This longitudinal observational study included 68 patients. Exclusion criteria were malignancies, obvious infection
disease, hospitalization, surgery or renal transplantation within the three months preceding the investigation. Patients who met the inclusion criteria were classified into 2 groups according to their CTR. And we collected subjects’ anthropometric, biochemical and dietary data.
CTR could be an indicator to evaluate HD patient’s nutritional status.
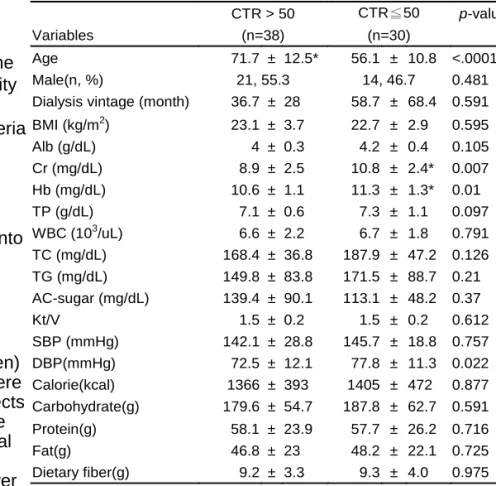
Table 1. Subjects’ characteristic, anthropometric, blood pressure, biochemical data and dietary data of hemodialysis(HD) patients, by cardiothoracic ratio(CTR)(n=68).1
CTR > 50 CTR≦50 p-value
Variables (n=38) (n=30)
Age 71.7 ± 12.5* 56.1 ± 10.8 <.0001
Male(n, %) 21, 55.3 14, 46.7 0.481
Dialysis vintage (month) 36.7 ± 28 58.7 ± 68.4 0.591
BMI (kg/m2) 23.1 ± 3.7 22.7 ± 2.9 0.595 Alb (g/dL) 4 ± 0.3 4.2 ± 0.4 0.105 Cr (mg/dL) 8.9 ± 2.5 10.8 ± 2.4* 0.007 Hb (mg/dL) 10.6 ± 1.1 11.3 ± 1.3* 0.01 TP (g/dL) 7.1 ± 0.6 7.3 ± 1.1 0.097 WBC (103/uL) 6.6 ± 2.2 6.7 ± 1.8 0.791 TC (mg/dL) 168.4 ± 36.8 187.9 ± 47.2 0.126 TG (mg/dL) 149.8 ± 83.8 171.5 ± 88.7 0.21 AC-sugar (mg/dL) 139.4 ± 90.1 113.1 ± 48.2 0.37 Kt/V 1.5 ± 0.2 1.5 ± 0.2 0.612 SBP (mmHg) 142.1 ± 28.8 145.7 ± 18.8 0.757 DBP(mmHg) 72.5 ± 12.1 77.8 ± 11.3 0.022 Calorie(kcal) 1366 ± 393 1405 ± 472 0.877 Carbohydrate(g) 179.6 ± 54.7 187.8 ± 62.7 0.591 Protein(g) 58.1 ± 23.9 57.7 ± 26.2 0.716 Fat(g) 46.8 ± 23 48.2 ± 22.1 0.725 Dietary fiber(g) 9.2 ± 3.3 9.3 ± 4.0 0.975 1
Values are Mean ± SD. BMI=Body Mass Index, Alb=Albumin,
Cr=Creatinie, Hb=Hemoglobin, TP=Total Protein, WBC=White Blood Cell, TC=Total Cholesterol, TG= Triglyceride, AC-sugar=preprandial blood glucose , SBP= Systolic Blood Pressure, DBP= Diastolic Blood Pressure. * means significantly difference at p < 0.05 by and chi-square test.
Total 68 patients (35 men and 33 women) with a mean HD duration of 46 months were enrolled in this study. Thirty eight of subjects had CTR more than 50%. Table 1 lists the characteristic, anthropometric, biochemical and dietary data.Subjects with CTR more than 50% were significantly elder and lower serum creatinine and hemoglobin (p<0.05). The CTR was positively correlated with age, but negatively correlated with serum
creatinine and hemoglobin (p<0.05).
The serum creatinine levels represent the muscle bulk and reflect the nutritional status in the dialysis patients. A higher serum creatinine level indicates a larger muscle mass and a better nutrition. Studies also showed that HD patients with cardiomegaly (CTR > 50% ) were elder, required more
erythropoietin treatment to meet target hematocrit level.