1997
1997
to
to
2000
2000
and
and
2003
2003
to
to
2005
2005
The Body Height
The Body Height
and Body Weight of Preschool Children
and Body Weight of Preschool Children
in Taipei City
in Taipei City
Ting
Ting-
-yun
yun
Juang、
Juang
、Shwu
Shwu-
-Huey Yang*
Huey Yang*
School of Nutrition and Health Sciences , Taipei Medical Univers
School of Nutrition and Health Sciences , Taipei Medical University , Taipei ,ity , Taipei , Taiwan , ROC
Taiwan , ROC
1997~2000 2003~2005 1993~96 Taiwan1 age N Mean±SD medium mode N Mean±SD medium mode Mean±SD
male 3 96 16.5±2.3 16.5 16.5 288 16.8±2.7 16.4 15.0 _ 4 275 18.9±3.1 18.0 17.5 591 18.6±3.1 18.0 18.0 17.5±2.6 5 414 21.3±3.7a 20.5 20.0 603 20.8±3.9b 20.3 20.3 20.1±2.9 6 84 22.6±4.3 21.5 19.0 250 22.4±4.2 21.5 21.5 22.2±4.6 female 3 97 16.2±2.3 16.0 16.0 266 15.9±2.4 15.5 15.5 _ 4 211 18.3±2.7a 18.0 19.0 525 17.9±2.8b 17.5 17.5 105.1±4.2 5 411 20.7±3.5a 20.0 20.0 556 19.7±3.3b 19.0 19.0 109.9±4.7 6 74 22.0±3.4 22.0 19.0 222 21.3±3.7 21.0 21.0 117.7±7.9 1997~2000 2003~2005 1993~96 Taiwan1 age N Mean±SD medium mode N Mean±SD medium mode Mean±SD
male 3 96 100.0±4.0b 99.5 98.0 291 100.9±5.6a 100.5 100.0 _ 4 275 106.6±4.9b 106.2 105.0 592 106.9±5.3a 106.5 105.0 107.7±9.7 5 414 112.8±5.0 113.0 112.0 602 113.1±5.6 113.1 114.0 112.9±5.0 6 84 116.4±4.7 116.0 113.0 244 117.0±5.8 117.0 117.0 119.0±6.5 female 3 97 98.6±4.4 97.8 97.0 267 98.7±5.5 99.0 100.0 _ 4 211 105.7±5.0 105.0 108.0 526 105.9±5.0 106.0 105.0 105.1±4.2 5 411 112.5±5.0 112.5 112.0 556 111.8±6.1 112.0 112.0 109.9±4.7 6 74 116.8±5.6 116.5 113.0 210 116.3±6.1 116.0 117.0 117.7±7.9 1997~2000 2003~2005 1993~96 Taiwan1 DOH2
age N Mean±SD medium mode N Mean±SD medium mode Mean±SD Normal male 3 96 16.6±1.4 16.4 16.7 288 16.5±1.9 16.1 14.1 _ 14.8~17.7 4 275 16.7±1.8a 16.4 15.7 591 16.3±2.0b 16.0 15.4 15.2±1.9 14.4~17.7 5 414 16.7±2.2a 16.3 15.5 601 16.2±2.2b 15.9 15.2 15.8±1.9 14.0~17.7 6 84 16.6±2.5 15.9 15.7 244 16.3±2.2 15.8 15.1 15.5±2.1 13.9~17.9 female 3 97 16.5±2.1 16.2 15.2 266 16.2±1.7 16.0 17.0 _ 14.5~17.2 4 211 16.4±1.7a 16.3 14.6 525 15.9±1.8b 15.6 15.4 15.0±1.5 14.2~17.1 5 411 16.5±2.0 16.0 15.7 556 15.7±1.9 15.4 15.1 14.9±1.6 13.9~17.1 6 74 15.9±1.8 15.7 14.9 210 15.6±1.8 15.3 14.6 15.2±2.1 13.6~17.2
The purpose of this study was to evaluate the body height and weight of preschool children , aged from 3 to 6 years old , in Taipei City. We collect the data from1997 to 2000 and 2003 to 2005 years to Taipei Medical University Hospital to inspect their health. And calculates body mass index (BMI)then try to compare the differents between 1997 to 2000 and 2003 to 2005.
We collect preschool
children’s body heights and
body weights from1997 to 2000 and 2003 to 2005 years of Taipei Medical University Hospital to inspect their health. A total of 2102 and 3281 preschool , including 1122 (53.4%)and 1724 (52.5%)boys , 980 (46.6%) and 1557 (47.5%)girls。We measure the body height and body weight then calculates the BMI. And use SAS 8.2 to analyze the data.
Introduction
Materials and
methods
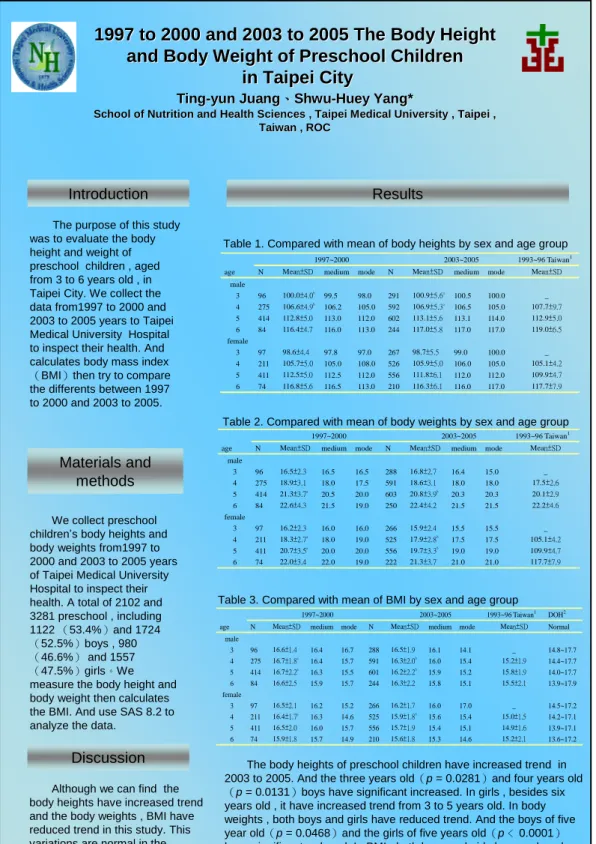
Results
Discussion
Table 1. Compared with mean of body heights by sex and age group
Table 2. Compared with mean of body weights by sex and age group
Table 3. Compared with mean of BMI by sex and age group
The body heights of preschool children have increased trend in 2003 to 2005. And the three years old(p = 0.0281)and four years old (p = 0.0131)boys have significant increased. In girls , besides six years old , it have increased trend from 3 to 5 years old. In body weights , both boys and girls have reduced trend. And the boys of five year old(p = 0.0468)and the girls of five years old(p ﹤0.0001) have significant reduced. In BMI , both boys and girls have reduced trend. And the boys of four years old(p = 0.0022)、five years old(p = 0.0004)and the girls of four years old(p = 0.0004) have significant reduced.
Although we can find the body heights have increased trend and the body weights , BMI have reduced trend in this study. This variations are normal in the standard of Department of Health , Executive Yuan , R.O.C. ( DOH ). It show that preschool children were growth fined in Taipei city.