行政院國家科學委員會專題研究計畫 成果報告
二存活函數之對等性檢定
計畫類別: 個別型計畫 計畫編號: NSC91-2118-M-004-002- 執行期間: 91 年 08 月 01 日至 93 年 09 月 30 日 執行單位: 國立政治大學統計學系 計畫主持人: 薛慧敏 報告類型: 精簡報告 報告附件: 出席國際會議研究心得報告及發表論文 處理方式: 本計畫可公開查詢中 華 民 國 93 年 9 月 21 日
Sample Size for Evaulaiton of Equivalence
and Non-inferiority Tests in the Comparison
of Two Survival Functions
H. M. Hsueh,1 J. P. Liu2 and T. J. Yao2,∗
1 Department of Statistics, National Cheng Chi University, Taipei, Taiwan 2Division of Biostatistics and Bioinformatics, National Health Research
Institutes, Taipei, Taiwan
Summary. In oncology, increasing number of active control trials have been conducted to compare a test therapy to a standard therapy. These new ther-apies are developed for less invasive or easy administration, or for reduced toxicity and thus to improve the quality of life at the minimal expense of survival. Therefore, evaluation of equivalence or non-inferiority based on censored endpoints such as overall survivals between test and active control becomes an important and practical issue. Under the assumption of pro-portional hazards, Wellek (1993) proposed a log-rank test for assessment of equivalence of two survival functions. In this paper, an explicit form of the asymptotic variance of the maximum likelihood estimator for the treatment effect is derived. It follows that the asymptotic power and sample size for-mulae can also be obtained. Alternatively, a two one-sided test (TOST) is proposed to evaluate the equivalence of two survival functions. The criti-cal values of the proposed TOST depend upon only the asymptotic variance
∗email: [email protected]
and the standard normal percentiles, which greatly simplify the sample size determination. In addition, a procedure for testing non-inferiority based on censored endpoint is derived and the corresponding sample size formula is also provided. It can be shown that when the sample size is large, the same sample size formulae can be derived for both the log-rank test and TOST when two survival functions are assumed to be equal. The sample size for-mulas for both procedures take into account the accrual pattern and the duration of the study. A simulation is conducted to empirically investigate the performance on size, power, and sample size of the proposed procedures and the log-rank test. Numerical examples are provided to illustrate the proposed procedures.
Key words: Equivalence, Non-inferiority, Survival Function, Two one-sided test procedure, Power, Sample size
1. Introduction
There are increasing number of comparative clinical trials where new treat-ments are compared to an active control. Many active control trials are de-signed due to ethical concerns, especially for life-threatening diseases. How-ever, for many others, the new treatments are developed for less invasive or easier administration, or for reduced toxicity and thus to improve the quality of life at minimal cost of efficacy. Therefore, the assessment of equivalence or non-inferiority in efficacy is an important and practical issue. For example, investigators in gynecological oncology were interested in the evaluation of the efficacy and toxicity of adjuvant therapy after radical hysterectomy and pelvic lymphadenectomy in stage IB or IIA cervical carcinoma patients with pelvic lymph node metastases. The current standard adjuvant therapy is
the concomitant chemo-radiotherapy (CT+RT) (cisplatin plus radiotherapy). However, postoperative radiotherapy is associated with significant morbid-ity. Some retrospective studies indicated that the adjuvant chemotherapy alone (CT) (cisplatin, onvovin and bleomycin) seemed to have comparable recurrenc-free survival rate and significantly less morbidity. The investigators would like to confirm the findings with a randomized trial and prove that the recurrence-free survival for patients treated with CT and for patients treated with CT+RT are equivalent.
For another example, axillary lymph nodes dissection has been a standard procedure in patients with breast carcinoma for staging and the prevention of metastases. However, the disease for the majority of early stage patients have not metastasized to the lymph nodes and this procedure can cause com-plications in the axillary area and the upper arm. To avoid the unnecessary complications, investigators have developed techniques in the identification of the sentinel nodes. It is then of interest to see if the disease-free survival of patients with sentinel nodes dissection alone is as good as that of patients with axillary nodes dissection.
For patients with stage IV nasopharyngeal carcinoma (NPC), concurrent chemoradiotherapy (cisplatin/5-FU) plus adjuvant (cisplatin/5-FU) has been proved to prolong survival. However, the adjuvant therapy may increase the chances of long term toxicity. At least 20% patients suffered severe toxicity, mostly vomiting or mucositis, while receiving adjuvant chemotherapy, and more than 11% patients surffered late complication, mostly hearing impair-ment or neck fibrosis (Cheng et al., 2000). Certain herbal medicine were then proposed to replace the adjuvant therapy in the hope to maintain the
survival effect but reduce the risk of side effects. It is thus relevant to have a comparative trial to test the hypothesis that five-year survival rate for this herbal medicine is equivalent to that afforded by cisplatin/5-FU in this patient population.
Several works have been published to address the issues in design and analysis of equivalence or non-inferiority trials for binary endpoints, such as Hsueh, Liu and Chen (2001), Kang and Chen (2000), Chan (1998), and Farrington and Manning (1990), among others. Much less work has been developed when the primary endpoint is the time-to-failure data. How-ever, many equivalence/non-inferiority trials are designed for treatments to life-treatening disease, and for which time-to-failure is usually the primary endpoint, as described in the previous three examples. Literature for the equivalence in time-to-failure data is scarce. Under proportional hazards assumptions, Wellek (1993) proposed a log-rank test based on the asymp-totic normality of the maximum partial likelihood estimator and an approx-imation form of the asymptotic variance. The test also used a noncentral chi-square percentile with a data-dependent noncentrality parameter as the critical value.
In this paper, we follow the development of Wellek and further derive an explicit form of the asymptotic variance. With this form, sample size deter-mination is possible without simulation studies. In addition, we proposed the two one-sided test (TOST) as an alternative of the log-rank test. The critical values of TOST only depend on the asymptotic variance and the standard normal percentiles, which greatly simplifies sample size determination. We also allocate much effort in pointing out issues in the application of the
re-sults to actual trial designs. In Section 2, some basic notations and Wellek’s test are introduced. The asymptotic variance is derived explicitly. To reduce the complexity in the calculation of the critical value, an alternative two one-sided test(TOST) is proposed in Section 3. Corresponding sample size formulas are given in Section 4. Some simulation and numerical results are presented in Section 5 and an example is illustrated in Section 6. Discussion and final remarks are provided in Section 7.
2. The asymptotic variance
We consider that two unrelated samples (T1, · · · , Tn1), and (Tn1+1, · · · , Tn1+n2)
of possibly right censored survival times are given such that Ti ∼ S1(·) for
1 ≤ i ≤ n1 and Ti ∼ S2(·) for n1+ 1 ≤ i ≤ n1 + n2. We assume that S1(·)
and S2(·) belong to the same proportional hazards model and with no loss
of generality, S1(·) is the survivor function for the control group. That is,
S2(t) = {S1(t)}e
θ
for all t > 0 and some θ.
Hence, for i = 1, · · · , n1+ n2, Ti has hazard function
λ(t) = λ1(t)eziθ where λ1(t) = d dt{− log S1(t)}, zi = ( 0, for 1 ≤ i ≤ n1; 1, for n1+ 1 ≤ i ≤ n1+ n2.
We considered the hypotheses of equivalence by restricting the uniform ab-solute difference between S1(·) and S2(·) as the following
H0 : sup
for some δ > 0. Wellek (1993) showed that, by the continuity of S1(·) and
reparametrization, the hypotheses (1) are equivalent to
Ha 0 : |θ| ≥ θ∗ versus H1a : |θ| < θ∗ (2) where θ∗ satisfies eθ∗/(1−eθ∗) − eθ∗eθ∗/(1−eθ∗) = δ.
The partial log-likelihood for θ can be shown as
log L(θ) = d+2θ − k X j=1 dj+log{rj1+ rj2eθ}, where for v = 1, 2; j = 1, · · · , k,
rjv = number of items at risk in the vth sample at the jth smallest failure time t(j),
d+v = total number of failures in the vth sample,
dj+ = total number of failures at the jth smallest failure time. Hence, the maximum partial likelihood estimator ˆθ satisifies
k X j=1 dj+ rj2eθˆ (rj1+ rj2eθˆ) = d+2,
and the observed information at ˆθ is I(ˆθ) = k X j=1 dj+rj1rj2eθˆ (rj1+ rj2eθˆ)2 , as N = n1+ n2 → ∞ I(ˆθ)/N → 1/vp 2(θ),
where the reciprocal 1/v2(θ) is the limiting value of the observed information
Defining ˜Cα(ψ) as ˜
Cα(ψ) = { αth quantile of a χ2 distribution with df=1 and noncentrality parameter ψ2 }1/2
for arbitrary ψ > 0, Wellek (1993) proposed an aymptotic UMP level α test with rejection region
√
N|ˆθ|/v(ˆθ) < ˜Cα
n√
Nθ∗/v(ˆθ)o. (3) Without an explicit form of v(θ), Wellek suggested estimating √N/v(ˆθ) by
the observed information
q
I(ˆθ). This test procedure is later referred as the
log-rank test for equivalence in this paper.
In fact, an explicit form of the limiting value v2(θ) can be derived. Let T
be the event time, C be the censoring time and ∆ be the censoring indicator, i.e. ∆ = 1 if T ≤ C and ∆ = 0 if T > C. We define fi as the p.d.f. corresponding to the survival function Si, and Sci(t) = P r(C > t|Z = i − 1) as the censoring function for group i, i = 1, 2. In addition, let ρ = limN →∞n2/N, and 0 < ρ < 1. Therefore, we have the following results.
Theorem 1. If the trial has an infinity duration, then
1/v2(θ) = Z ∞ 0 p(s)q(s)u(s)ds. where p(s) = P r(Z = 1 | T = s, ∆ = 1) = ρSc2(s)f2(s) ρSc2(s)f2(s) + (1 − ρ)Sc1f1(s) ≡ 1 − q(s), u(s) = P r(T = s, ∆ = 1) = ρSc2(s)f2(s) + (1 − ρ)Sc1f1(s).
The proof of Theorem 1 is given in the Appendix. With this explicit form of v2(θ), the asymptotic behavior of the log-rank test can be evaluated
an-alytically, and the sample size determination is possible without simulation, as will be shown in Section 4. However, in practice, a trial is always de-signed within a finite period of accrual time plus an additional finite period of follow-up time. Therefore, the following result is much more relevant and useful.
Corollary 1. If the accural period of the trial is T0, and an additional
follow-up period of τ is considered, assuming an uniform accrual rate, then
1/v2(θ) = Z T0 0 Z T0+τ −t 0 p(s)q(s)u(s)ds 1 T0 dt.
3. A two one-sided test (TOST)
Wellek’s test procedure is complicated to apply because of the necessity to evaluate the noncentral chi-square percentile in (3) . It is easy to see that the hypotheses in (2) can be partitioned into two one-sided hypotheses,
Ha
U 0 : θ ≤ −θ∗ versus HU 1a : θ > −θ∗
and
Ha
L0 : θ ≥ θ∗ versus HL1a : θ < θ∗. By the intersection-union principle, Ha
0 is rejected if both HU 0a , HL0a are re-jected. Thus the rejection region of the two one-sided test procedure (TOST) at level α can be easily shown as
ZL= (ˆθ − θ∗)
q
I(ˆθ) < −zα, and ZU = (ˆθ + θ∗)
q
Denotes Φ(·) as the standard normal distribution function. The following theorem gives the asymptotic power functions of the log-rank test (3) and the two one-sided test (4), respectively.
Theorem 2. At θ = θ0, |θ0| < θ∗, the log-rank test (3) has asymptotic power
βLR(θ0) = Φ ³ ˜ Cα n√ Nθ∗/v(θ0)o−√Nθ0/v(θ0)´− Φ³− ˜Cα n√ Nθ∗/v(θ0)o−√Nθ0/v(θ0)´;
and the two one-sided test (4) has asymptotic power βT OST(θ0) = Φ ³ −zα+ √ Nθ∗/v(θ0) −√Nθ0/v(θ0)´− Φ³zα− √ Nθ∗/v(θ0) −√Nθ0/v(θ0)´.
Furthermore, the TOST test for the hypotheses of equality can be easily modified to a test for the hypotheses of non-inferiority:
H0L: inft>0{S2(t) − S1(t)} ≤ −δ versus H1L : inft>0{S2(t) − S1(t)} > −δ,
or equivalently,
H0La : θ ≥ θ∗ versus H1La : θ < θ∗.
The corresponding one-sided test procedure based on ZL in (4) is used.
Corollary 2. At θ = θ0, θ0 < θ∗, the non-inferiority test procedure has
asymptotic power βN I(θ0) = Φ ³ −zα+ √ Nθ∗/v(θ0) −√Nθ0/v(θ0)´.
4. Sample size determination
At the design stage of clinical trials, determination of the sample size is always a key element. It plays an important role in assessing the feasibility of a trial. For clinical trials to test the equivalence between the survival functions of two study arms, the sample size is often required to acheieve a pre-determined level of power, β∗, at S
1(·) = S2(·), or θ0 = 0 in proportional hazards models.
With the explicit form of v(θ), the sample size formulae of the log-rank test, TOST and the non-inferiority test can be derived analytically.
Corollary 3. For the asymptotic power greater than β∗ at θ0 = 0, the
sample size required for the log-rank test (3) is the smallest integer N such that
˜
Cα
n√
Nθ∗/v(0)o≥ z(1−β∗)/2. (5) The TOST (4) should have sample size no less than
n
zα+ z(1−β∗)/2
o2
v2(0)/θ∗2,
while the sample size required for the non-inferiority test ZL is at least
n
zα+ z(1−β∗)
o2
v2(0)/θ∗2.
Notice that, at θ0 = 0, p(s), q(s) and u(s) in v2(0) are simplified as
p(s) = ρSC2(s)
ρSC2(s) + (1 − ρ)SC1(s)
= 1 − q(s),
and
respectively. We can see that the sample size evaluation for TOST only re-quires one calculation involving standard normal percentiles, while it rere-quires repeated calculations of noncentral chi-square percentiles for the log-rank test.
Even though the preceding test procedures can be applied to any propor-tional hazards models without specific forms of the survivor functions, the determination of the sample size depends on the specified f1(·), SC1(·) and
SC2(·) in v2(0).
5. Simulation results
Several simulation studies were performed in order to study the small sample performance of the three test procedures. The first simulation study used the same parameters as the one reported in Wellek for comparison. The sam-ples of the control arm were generated under a lognormal survivor function,
S1(t) = Φ(2 − ln(t)) and an independent exponential censoring distribution
function, SC1(t) = 1 − exp{−t/50}. The censoring rate for this arm is about 19%. The samples of the treatment arm were generated at both boundaries of the hypothesis with δ = 0.15 and at an identical alternative S2 = S1, all
with SC2 = SC1. The empirical type I error rates and power were thus calcu-lated based on 10,000 replications. The computations were carried out using FORTRAN 90 on an x86 Family 6 Model 8 Stepping 10 PC. The results of different sample sizes are presented in Table 1-1. The corresponding approx-imation of the asymptotic size and power were also evaluated at θ0 = ±θ∗ and θ0 = 0, respectively, and presented in the same Table. Table 1-2 shows
the simulation results under the same distributional assumptions as those for Table 1-1 except that the maximum allowable difference δ is reduced to
0.10. For the other 2 simulation studies, the survivor function for the control group was specified in an exponential model: S1(t) = exp(−t/λ1), where
λ1 is selected such that S1(5) = 0.55, and the censoring distribution was
SC1(t) = SC2 = exp(−t/4λ1). Note that the censoring distribution was
se-lected such that the censoring rate is 20% for infinite duration. The results are shown in Table 2-1 when δ = 0.15 and Table 2-2 when δ = 0.10.
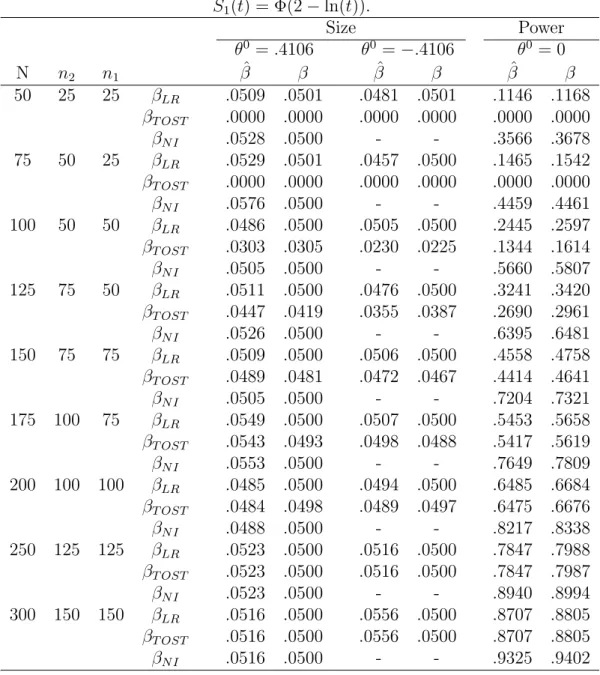
In general, TOST is more conservative when compared to the log-rank test. For very small sample sizes, TOST is extremely conservative, but the differences between TOST and the log-rank test decreases as the sample size increases. Under both distribution models, when δ = 0.15, the type I error rate and power for the log-rank test and TOST are virtually identical after the total sample size reaches 250, where the type I error rate is approximately controlled. In fact, it can be shown that the sample sizes for both tests approximate to the same value for large N. Let χ2
ψ be a chi-square random variable with noncentrality parameter ψ2, then
α = P (χ2
ψ ≤ ˜Cα2(ψ)) = Φ( ˜Cα(ψ) − ψ) − Φ(− ˜Cα(ψ) − ψ). We see that as ψ goes to infinity,
Φ( ˜Cα(ψ) − ψ) ≈ α, and ˜Cα(ψ) ≈ ψ − zα.
That is, the asymptotic power of the log-rank test βLR(θ0) can be approxi-mated by the asymptotic power of TOST βT OST(θ0) provided N is sufficiently large. If a trial to test the equivalence of two survivor functions is designed with sufficient power, say the most commonly required 80%, the sufficient total sample size will be greater than 250. In other words, with reasonable
sample sizes, TOST has the same performance as the log-rank test and has the advantage of easily evaluable rejection region and power.
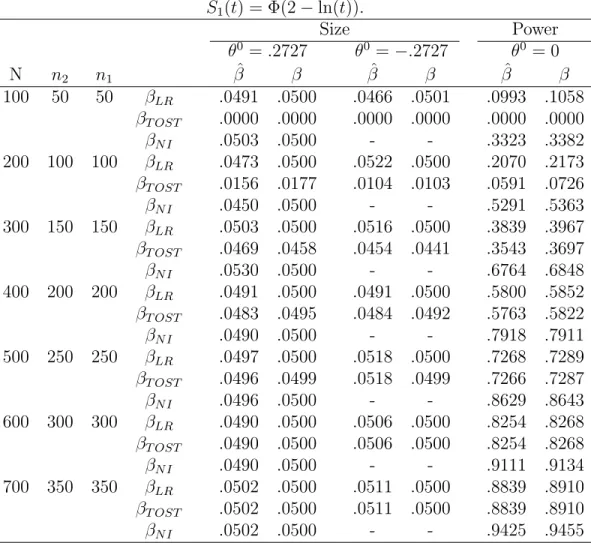
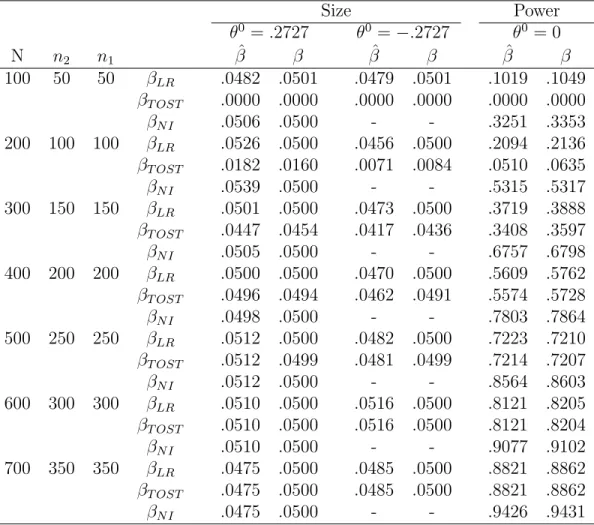
We can see that the maximum allowable difference δ is very influential on sample size determination. Under both survivor models, when δ reduces to 0.10, the performance of the log-rank test and TOST becomes identical as the total sample size reaches 500. For a test with 80% power, the required sample size is close to 600.
6. Numerical examples
In the example of stage IV NPC, the 5-year survival rate has been reported to be 55% when treated with CCRT plus adjuvant chemotherapy (Cheng et al, 2000). Medical investigators are interested to see if the survivor function remain unchanged with the substitution of the adjuvant chemotherapy by a herbal medicine after CCRT. A randomized clinical trial is then designed to test the hypothesis of equivalence in the survivor functions of the two arms. Table 3 shows the sample sizes for the rank test and TOST under a log-normal model or an exponential model. The parameter for either model was determined so that S1(5) = 0.55. In addition, exponential models are used
for the censoring distributions, for which the parameters were determined so that the censoring rate was 20% under either survival model. That is, for the log-normal model, S1(t) = Φ(1.735 − ln(t)) and SC1(t) = SC2(t) = 1 − exp{−t/35.7}; and for the exponential model,S1(t) = 1 − exp{−t/8.36}
and SC1(t) = SC2(t) = 1 − exp{−t/33.5}. Equal allocation for the two arms was assumed, and δ was set at 0.15. For illustration, the sample sizes for the non-inferiority test are also shown in Table 3. We note that under the case
of SC1(t) = SC2(t), and at θ = 0, ∆ and T are independent with Z. For ∀s,
p(s) = P (Z = 1|T, ∆) = P (Z = 1) = ρ = 1 − q(s),
then
1/v2(0) = ρ(1 − ρ)Z ∞
0 P (T = s, ∆ = 1)ds = ρ(1 − ρ)P (∆ = 1)
is proportional to the probability of uncensored observations regardless of the specifications of S1 and SC1. Therefore, the sample size is inversely pro-portional to the uncensoring proportion. In our example, since the censoring rate and the allocation proportion are the same for both models, they have the identical sample sizes for trials with infinite duration.
In addition to the sample size calculations for trials with infinite duration, we also calculated the sample sizes for the more realistic cases with 5 years of uniform accrual and 1 or 2 additional years of follow-up, using the expression for 1/v2(θ) in Corollary 1. The results indicate that when the accrual
dura-tion is limited to 5 years, the sample size is approximately doubled or tripled for additional 2 or 1 year of follow-up. With these specifications, sample sizes under the log-normal model are larger than those under exponential model by about 10% for the cases with 1 year follow-up and 5% for the cases with 2 years of follow-up. Similar to the unlimited case, with independence between ∆, T and Z at θ = 0, the values of 1/v2(θ) for the limited accrual case is
proportional to
EUET{E(∆|T )|T < T0+ τ − U},
and hence the sample size for the limited accrual case is inversely proportional to the probability of uncensored observation up to time T0 + τ . Thus the
difference in sample size between the unlimited and the limited accrual cases is believed to increase as the uncensoring proportion within the limited study period decreases. We like to emphasize the fact that the sample sizes for the log-rank test and for TOST are identical for all cases in Table 3.
7. Discussion
We have proposed a two one-sided test for testing the equivalence of two survivor curves. With moderate or large sample sizes, the type I error rates evaluated at the boundaries and the power evaluated at S1 = S2for TOST are
virtually identical to those for the log-rank test proposed by Wellek. These tests are developed under the assumption of proportional hazards. However, as in most of the designs for comparative clinical trials, distributional models need to be specified for sample size determination. We like to point out that, when we reject the null hypothesis in a log-rank test or TOST, the maximal difference between S1(t) and S2(t) is equal to or smaller than an acceptable
boundary δ. It is easy to show that for all proportional hazards models, this maximum occurs at time t∗ where S
1(t∗) = exp [θ∗/{1 − exp(θ∗)}] and θ∗ is
the corresponding equivalence limit. Therefore, the sample size required to perform these tests with certain power could be very different from the the sample size required to test the equivalence of survival at a fixed time.
For example, the 5-year disease-free survival is about S1(5) = 95% for
patients with early stage breast carcinoma after surgery with axillary lymph nodes dissection. A comparative trial is designed to test the non-inferiority in disease-free survival for patients with sentinel nodes dissection (STND) in-stead of axillary nodes dissection (AXND). The investigators consider STND group as non-inferior if the 5-year disease-free survival S2(5) is at least 90%,
that is , δ = 5%, then under exponential models and S2(t) = S1(t)exp(θ),
θ = 0.7198 at the boundary S2(5) = 90%, which leads to a very small sample
size, 24 per arm, for equal allocation and infinite accrual without censoring. We note here that if we relax the model assumption and calculate the sample size to test the non-inferiority between two proportions using method por-posed by Kang and Chen (2000), then we need 251 patients per arm and each patient has to be followed for 5 years.
However, if the investigators consider STND to be non-inferior to AXND only if the difference between survival is at most 5% at any time, then it is the same as requiring S2(t∗) ≥ S1(t∗)−5% at time t∗, where t∗is solved to be 90.5
years! This leads to θ∗ = 0.1360 and a sample size of 669 per arm. Neither of the two results seem appealing. The former case concentrates on one single time point and thus highly depends on the model assumptions. The latter case considers the time period that goes beyond any practically meaningful length. One reasonable alternative is to let investigators determine the lengh of interest, say 15 years, and then test the non-inferiority within this time period. Since |S1(t) − S2(t)| is an unimodal function of t and 15 < t∗, it is
easy to see that the maximum for this period [0, 15] occurs at t0 = 15. This
leads to θ0 = 0.3297 and a sample size of 114 per arm.
In general, the sample sizes sufficient to prove equivalence or non-inferiority are larger than the sample sizes sufficient to prove difference. In designing trials for equivalence or non-inferiority based on censored endpoints, there are several non-trivial issues as pointed out in this paper. The investiga-tors should be aware of the implications of the assumptions in sample size caculation in order to develop appropriate and feasible designs.
Appendix A
Proof of Theorem 1
Let U = min(T, C) and λi is the hazard of the ith sample, i = 1, 2. Since 1 NI(θ) = 1 N k X j=1 dj+rj1rj2eθ (rj1+ rj2eθ)2 = k X j=1 (dj+/N)(rj1/N)(rj2/N)eθ {(rj1/N) + (rj2/N)eθ}2 . in which, for i = 1, 2, as n → ∞, dj+ N p → P (Z = i, U ≥ t(j)) ≡ u(t(j)), rji N p → P (U ≥ t(j), Z = i − 1),
where λi(t) = P (T = t|Z = i − 1)/P (T ≥ t|Z = i − 1). Thus with eθ =
λ2(t)/λ1(t), ∀t, (rj1/N)(rj2/N)eθ {(rj1/N) + (rj2/N)eθ}2 = ( (rj1/N) (rj1/N) + (rj2/N)eθ ) ( (rj2/N)eθ (rj1/N) + (rj2/N)eθ ) p ≈ ( P (U ≥ t(j), Z = 0)λ1 P (U ≥ t(j), Z = 0)λ1+ P (U ≥ t(j), Z = 1)λ2 ) · ( P (U ≥ t(j), Z = 1)λ2 P (U ≥ t(j), Z = 0)λ1+ P (U ≥ t(j), Z = 1)λ2 )
For P (U ≥ t(j), Z = i) = P (C ≥ t(j)|Z = i)P (T ≥ t(j)|Z = i),
P (U ≥ t(j), Z = i − 1)λi = P (C > t(j)|Z = i − 1)P (T = t(j)|Z = i − 1)P (Z = i − 1) = P (∆ = 1, T = t(j), Z = i − 1), and (dj+/N)(rj1/N)(rj2/N)eθ {(rj1/N) + (rj2/N)eθ}2 p ≈ P (Z = 1|∆ = 1, T = t(j))P (Z = 0|∆ = 1, T = t(j)) ≡ p(t(j))q(t(j)).
Then the asymptotic properties can be obtained following a standard ap-proach for failure time data by using the Martingale Theory and found that
1 NI(θ) p → Z ∞ 0 p(s)q(s)u(s)ds ≡ 1 v2(θ). Appendix B Proof of Theorem 2
At θ = θ0, |θ0| < θ∗, the log-rank test (3) has asymptotic power
βLR(θ0) = P ( √ N|ˆθ|/v(ˆθ) < ˜Cα n√ Nθ∗/v(ˆθ)o) ≈ P (√N|ˆθ|/v(θ0) < ˜C α n√ Nθ∗/v(θ0)o) = P (− ˜Cα n√ Nθ∗/v(θ0)o<√N ˆθ/v(θ0) < ˜C α n√ Nθ∗/v(θ0)o) ≈ Φ³C˜α n√ Nθ∗/v(θ0)´−√Nθ0/v(θ0)o− Φ³− ˜Cα n√ Nθ∗/v(θ0)o−√Nθ0/v(θ0)´,
as n goes to infinity. The asymptotic power of TOST can be easily derived in similar way.
REFERENCES
Chan, I. F. (1998) Exact tests of equivalence and efficacy with a non-zero lower bound for comparative studies. Statistics in Medicine 17, 1403– 1413.
Cheng, S. H., Jian, J. J-M, Tsai, S. Y.C., Yen, K. L., Chu, N-M, Chan, K-Y, Tan, T-D, Cheng, J.C., Leu, S-Y, Hsieh, C-Y and Huang, A. T. (2000) Long-term survival of nasopharyngeal carcinoma following
concomitant radiotherapy and chemotherapy. Int. J. Radiation Oncology
Farrington, C. P. and Manning, G. (1990) Test statistics and sample size formulae for comparative bunomial trials with null hypothesis of non-zero risk difference or non-unity relative risk. Statistics in Medicine 9, 1447– 1454.
Hsueh, H. M., Liu, J. P. and Chen, J. J. (2001) Unconditional exact tests for equivalence or non-inferiority for paired binary data. Biometrics 57, 478– 483.
Kang, S-H and Chen, J. J. (2000) An approximate unconditional test of non-inferiority between two proportions. Statistics in Medicine 19, 2089– 2100.
Wellek, S. (1993) A log-rank test for equivalence of two survivor functions.
Table 1-1. With δ = .15, empirical power ˆβ / asymptotic power β, of
Wellek’s test, TOST and the noninferiority test in a log-normal case :
S1(t) = Φ(2 − ln(t)). Size Power θ0 = .4106 θ0 = −.4106 θ0 = 0 N n2 n1 βˆ β βˆ β βˆ β 50 25 25 βLR .0509 .0501 .0481 .0501 .1146 .1168 βT OST .0000 .0000 .0000 .0000 .0000 .0000 βN I .0528 .0500 - - .3566 .3678 75 50 25 βLR .0529 .0501 .0457 .0500 .1465 .1542 βT OST .0000 .0000 .0000 .0000 .0000 .0000 βN I .0576 .0500 - - .4459 .4461 100 50 50 βLR .0486 .0500 .0505 .0500 .2445 .2597 βT OST .0303 .0305 .0230 .0225 .1344 .1614 βN I .0505 .0500 - - .5660 .5807 125 75 50 βLR .0511 .0500 .0476 .0500 .3241 .3420 βT OST .0447 .0419 .0355 .0387 .2690 .2961 βN I .0526 .0500 - - .6395 .6481 150 75 75 βLR .0509 .0500 .0506 .0500 .4558 .4758 βT OST .0489 .0481 .0472 .0467 .4414 .4641 βN I .0505 .0500 - - .7204 .7321 175 100 75 βLR .0549 .0500 .0507 .0500 .5453 .5658 βT OST .0543 .0493 .0498 .0488 .5417 .5619 βN I .0553 .0500 - - .7649 .7809 200 100 100 βLR .0485 .0500 .0494 .0500 .6485 .6684 βT OST .0484 .0498 .0489 .0497 .6475 .6676 βN I .0488 .0500 - - .8217 .8338 250 125 125 βLR .0523 .0500 .0516 .0500 .7847 .7988 βT OST .0523 .0500 .0516 .0500 .7847 .7987 βN I .0523 .0500 - - .8940 .8994 300 150 150 βLR .0516 .0500 .0556 .0500 .8707 .8805 βT OST .0516 .0500 .0556 .0500 .8707 .8805 βN I .0516 .0500 - - .9325 .9402
Table 1-2. With δ = .1, empirical power ˆβ / asymptotic power β, of
Wellek’s test, TOST and the noninferiority test in a log-normal case :
S1(t) = Φ(2 − ln(t)). Size Power θ0 = .2727 θ0 = −.2727 θ0 = 0 N n2 n1 βˆ β βˆ β βˆ β 100 50 50 βLR .0491 .0500 .0466 .0501 .0993 .1058 βT OST .0000 .0000 .0000 .0000 .0000 .0000 βN I .0503 .0500 - - .3323 .3382 200 100 100 βLR .0473 .0500 .0522 .0500 .2070 .2173 βT OST .0156 .0177 .0104 .0103 .0591 .0726 βN I .0450 .0500 - - .5291 .5363 300 150 150 βLR .0503 .0500 .0516 .0500 .3839 .3967 βT OST .0469 .0458 .0454 .0441 .3543 .3697 βN I .0530 .0500 - - .6764 .6848 400 200 200 βLR .0491 .0500 .0491 .0500 .5800 .5852 βT OST .0483 .0495 .0484 .0492 .5763 .5822 βN I .0490 .0500 - - .7918 .7911 500 250 250 βLR .0497 .0500 .0518 .0500 .7268 .7289 βT OST .0496 .0499 .0518 .0499 .7266 .7287 βN I .0496 .0500 - - .8629 .8643 600 300 300 βLR .0490 .0500 .0506 .0500 .8254 .8268 βT OST .0490 .0500 .0506 .0500 .8254 .8268 βN I .0490 .0500 - - .9111 .9134 700 350 350 βLR .0502 .0500 .0511 .0500 .8839 .8910 βT OST .0502 .0500 .0511 .0500 .8839 .8910 βN I .0502 .0500 - - .9425 .9455
Table 2-1 With δ = .15, empirical power ˆβ / asymptotic power β, of
Wellek’s test, TOST and the noninferiority test in an exponential model:
S1(t) = exp(−t/λ1), where λ1 is selected such that S1(5) = 0.55, and the
censoring distribution SC1(t) = SC2= exp(−t/λc), where λc is selected such that the censoring rate is 20%.
Size Power θ0 = .4106 θ0 = −.4106 θ0 = 0 N n2 n1 βˆ β βˆ β βˆ β 50 25 25 βLR .0461 .0501 .0520 .0501 .1063 .1155 βT OST .0000 .0000 .0000 .0000 .0000 .0000 βN I .0526 .0500 - - .3485 .3645 100 50 50 βLR .0529 .0500 .0495 .0500 .2401 .2548 βT OST .0315 .0293 .0200 .0210 .1317 .1518 βN I .0515 .0500 - - .5735 .5759 150 75 75 βLR .0482 .0500 .0525 .0500 .4504 .4671 βT OST .0460 .0479 .0494 .0464 .4347 .4542 βN I .0479 .0500 - - .7140 .7762 200 100 100 βLR .0539 .0500 .0489 .0500 .6399 .6599 βT OST .0529 .0498 .0484 .0496 .6378 .6589 βN I .0539 .0500 - - .8200 .8295 250 125 125 βLR .0469 .0500 .0523 .0500 .7722 .7919 βT OST .0469 .0500 .0523 .0500 .7722 .7918 βN I .0469 .0500 - - .8871 .8959 300 150 150 βLR .0480 .0500 .0510 .0500 .8622 .8754 βT OST .0480 .0500 .0509 .0500 .8622 .8754 βN I .0480 .0500 - - .9331 .9377 350 175 175 βLR .0492 .0500 .0517 .0500 .9219 .9266 βT OST .0492 .0500 .0517 .0500 .9219 .9266 βN I .0492 .0500 - - .9616 .9633
Table 2-2 With δ = .1, empirical power ˆβ / asymptotic power β of Wellek’s
test, TOST and the noninferiority test in a exponential model:
S1(t) = exp(−t/λ1), where λ1 is selected such that S1(5) = 0.55, and the
censoring distribution SC1(t) = SC2= exp(−t/λc), where λc is selected such that the censoring rate is 20%.
Size Power θ0 = .2727 θ0 = −.2727 θ0 = 0 N n2 n1 βˆ β βˆ β βˆ β 100 50 50 βLR .0482 .0501 .0479 .0501 .1019 .1049 βT OST .0000 .0000 .0000 .0000 .0000 .0000 βN I .0506 .0500 - - .3251 .3353 200 100 100 βLR .0526 .0500 .0456 .0500 .2094 .2136 βT OST .0182 .0160 .0071 .0084 .0510 .0635 βN I .0539 .0500 - - .5315 .5317 300 150 150 βLR .0501 .0500 .0473 .0500 .3719 .3888 βT OST .0447 .0454 .0417 .0436 .3408 .3597 βN I .0505 .0500 - - .6757 .6798 400 200 200 βLR .0500 .0500 .0470 .0500 .5609 .5762 βT OST .0496 .0494 .0462 .0491 .5574 .5728 βN I .0498 .0500 - - .7803 .7864 500 250 250 βLR .0512 .0500 .0482 .0500 .7223 .7210 βT OST .0512 .0499 .0481 .0499 .7214 .7207 βN I .0512 .0500 - - .8564 .8603 600 300 300 βLR .0510 .0500 .0516 .0500 .8121 .8205 βT OST .0510 .0500 .0516 .0500 .8121 .8204 βN I .0510 .0500 - - .9077 .9102 700 350 350 βLR .0475 .0500 .0485 .0500 .8821 .8862 βT OST .0475 .0500 .0485 .0500 .8821 .8862 βN I .0475 .0500 - - .9426 .9431
Table 3. Sample size requried per arm under each model with ρ = 1/2,
δ = ..15 and S1(5) = .55, censoring rate =.20
Log-normal case Exponential case
β∗ (∞, ∗)a (5, 1)b (5, 2)c (∞, ∗)a (5, 1)b (5, 2)c ..7 LRT1 107 302 233 107 271 224 TOST2 107 302 234 107 271 224 NIT3 70 198 153 70 178 147 ..8 LRT 127 360 278 127 323 266 TOST 127 360 278 127 323 266 NIT 92 260 201 92 234 192 ..9 LRT 161 454 351 161 408 336 TOST 161 454 351 161 408 336 NIT 127 360 272 127 323 266
(∞, ∗)a: infinity accrual and follow-up;
(5, 1)b : 5 years of uniform accrual and 1 additional year of follow up;
(5, 2)c : 5 years of uniform accrual and 2 additional years of follow up;
LRT1 : Wellek’s Log-Rank test;
TOST2 : two one-sided test;